Home > Comparison > Technology > KLAC vs MRVL
The strategic rivalry between KLA Corporation and Marvell Technology defines the current trajectory of the semiconductor industry. KLA operates as a capital-intensive process control and yield management leader, while Marvell focuses on high-margin mixed-signal and storage solutions. This head-to-head pits precision manufacturing against integrated circuit innovation. This analysis will clarify which company’s strategy offers the superior risk-adjusted return for a diversified portfolio seeking exposure to semiconductor technology.
Table of contents
Companies Overview
KLA Corporation and Marvell Technology, Inc. both hold critical roles in the semiconductor industry’s global supply chain.
KLA Corporation: Precision Process Control Leader
KLA Corporation dominates the semiconductor process control sector. It generates revenue by providing advanced inspection and metrology systems that improve chip manufacturing yield. In 2026, KLA focuses strategically on expanding its process-enabling solutions across semiconductor, PCB, and display markets to address increasing complexity and quality demands.
Marvell Technology, Inc.: Integrated Circuit Innovator
Marvell Technology excels in designing and selling diverse integrated circuits including Ethernet controllers and storage solutions. Its revenue engine revolves around high-performance networking and storage chips. Recently, Marvell has emphasized strengthening its product portfolio in data infrastructure and cloud computing applications to capture growing demand in digital transformation.
Strategic Collision: Similarities & Divergences
Both companies operate in semiconductors but diverge sharply in focus. KLA pursues a closed ecosystem of precision manufacturing tools while Marvell adopts an open infrastructure approach through integrated circuits. Their competition centers on serving evolving semiconductor customers, from fabrication to end-use. KLA’s stability contrasts with Marvell’s growth-driven profile, reflecting distinct investment dynamics amid sector shifts.
Income Statement Comparison
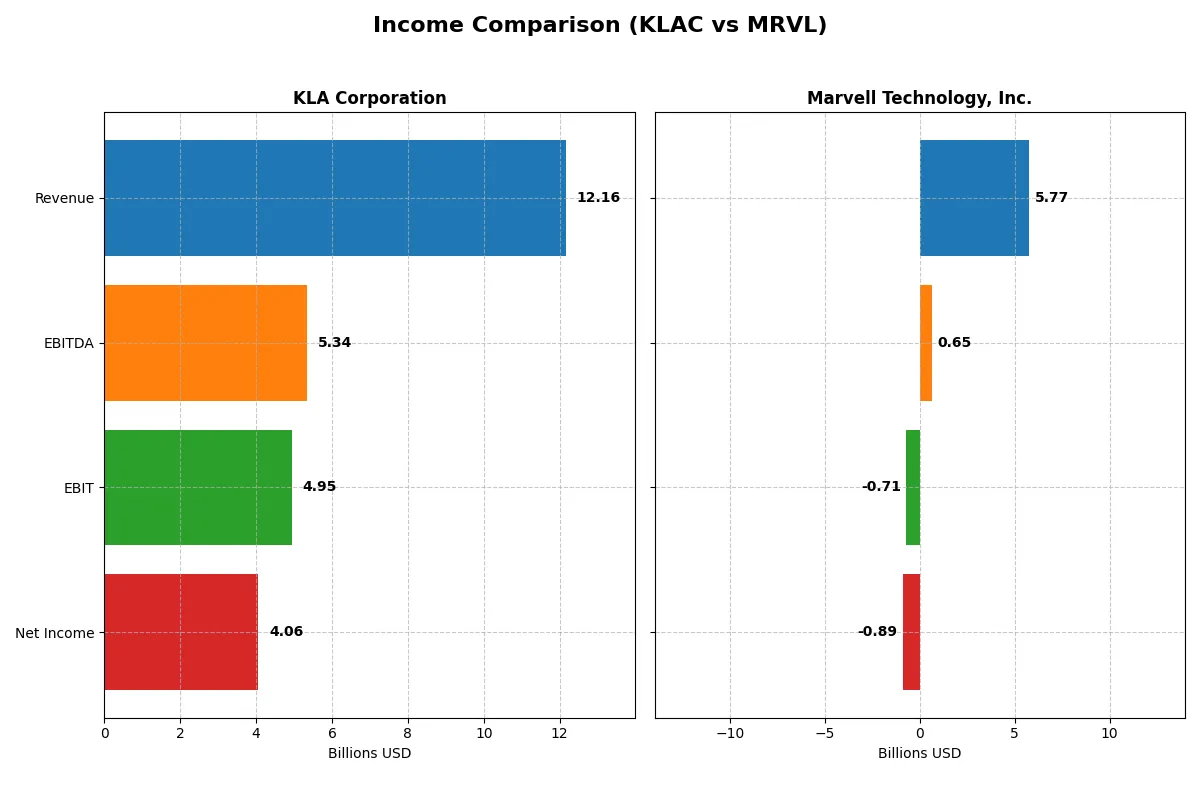
This data dissects the core profitability and scalability of both corporate engines to reveal who dominates the bottom line:
| Metric | KLA Corporation (KLAC) | Marvell Technology, Inc. (MRVL) |
|---|---|---|
| Revenue | 12.2B | 5.77B |
| Cost of Revenue | 4.58B | 3.39B |
| Operating Expenses | 2.33B | 3.10B |
| Gross Profit | 7.58B | 2.38B |
| EBITDA | 5.34B | 652M |
| EBIT | 4.95B | -705M |
| Interest Expense | 302M | 189M |
| Net Income | 4.06B | -885M |
| EPS | 30.53 | -1.02 |
| Fiscal Year | 2025 | 2025 |
Income Statement Analysis: The Bottom-Line Duel
This income statement comparison reveals which company runs a more efficient and profitable corporate engine through recent financial performance.
KLA Corporation Analysis
KLA’s revenue surged by 24% in 2025 to $12.2B, paired with a net income jump of 47% to $4.1B. Its gross margin holds strong at 62%, while net margin impressively reaches 33%. The company’s operating and net income growth demonstrate robust momentum and superior cost control, fueling significant EPS gains.
Marvell Technology, Inc. Analysis
Marvell’s revenue modestly grew 4.7% to $5.8B in 2025, yet it sustained a net loss of $885M. Gross margin remains decent at 41%, but negative EBIT and net margins reflect ongoing profitability challenges. Despite slight EPS improvement, Marvell’s operating efficiency deteriorates, signaling struggles to convert sales growth into earnings.
Margin Dominance vs. Revenue Resilience
KLA clearly outperforms Marvell on all profitability metrics, boasting healthy margins and strong bottom-line growth. Marvell’s revenue growth lacks accompanying profit gains, resulting in persistent losses. For investors, KLA’s profile offers a proven, efficient earnings engine, while Marvell remains a higher-risk turnaround candidate.
Financial Ratios Comparison
These vital ratios act as a diagnostic tool to expose the underlying fiscal health, valuation premiums, and capital efficiency of the companies analyzed:
| Ratios | KLA Corporation (KLAC) | Marvell Technology, Inc. (MRVL) |
|---|---|---|
| ROE | 87% | -7% |
| ROIC | 38% | -4% |
| P/E | 29.3 | -110.4 |
| P/B | 25.4 | 7.3 |
| Current Ratio | 2.62 | 1.54 |
| Quick Ratio | 1.83 | 1.03 |
| D/E | 1.30 | 0.32 |
| Debt-to-Assets | 38% | 21% |
| Interest Coverage | 17.3 | -3.8 |
| Asset Turnover | 0.76 | 0.29 |
| Fixed Asset Turnover | 9.70 | 5.56 |
| Payout ratio | 22% | -23% |
| Dividend yield | 0.76% | 0.21% |
| Fiscal Year | 2025 | 2025 |
Efficiency & Valuation Duel: The Vital Signs
Financial ratios act as the company’s DNA, exposing hidden risks and operational excellence critical for investor insight.
KLA Corporation
KLA boasts a stellar 86.6% ROE and a commanding 33.4% net margin, signaling operational efficiency. However, its P/E of 29.3 and P/B of 25.4 mark the stock as stretched relative to typical tech benchmarks. Shareholders receive a modest 0.76% dividend yield, reflecting a cautious payout amid strong R&D investment at 11.1% of revenue.
Marvell Technology, Inc.
Marvell struggles with negative profitability metrics: a -6.6% ROE and -15.4% net margin show ongoing operational challenges. Despite an unusual negative P/E, its P/B of 7.3 suggests valuation pressure remains. The company retains a low 0.21% dividend yield and channels significant funds into R&D, absorbing 33.8% of revenue to fuel growth.
Premium Valuation vs. Operational Safety
KLA’s robust returns and solid liquidity contrast with Marvell’s weak profitability and higher risk profile. KLA offers a safer risk-reward balance, appealing to investors prioritizing operational strength. Marvell suits those willing to bet on growth amid uncertainty and stretched operational metrics.
Which one offers the Superior Shareholder Reward?
I see KLA Corporation (KLAC) delivers a more balanced shareholder reward than Marvell Technology (MRVL). KLAC pays a 0.76% dividend yield with a conservative 22% payout ratio, well-covered by free cash flow (FCF), and runs a robust buyback program. MRVL’s yield is a mere 0.21%, with negative payout ratios reflecting losses and minimal buybacks. Historically in semiconductors, steady dividends plus buybacks signal durability and shareholder alignment. KLAC’s model offers sustainable returns through disciplined capital allocation. MRVL’s reinvestment focus amid losses increases risk. I conclude KLAC provides the superior total return profile for 2026 investors.
Comparative Score Analysis: The Strategic Profile
The radar chart reveals the fundamental DNA and trade-offs of KLA Corporation and Marvell Technology, Inc., highlighting their strategic strengths and weaknesses:
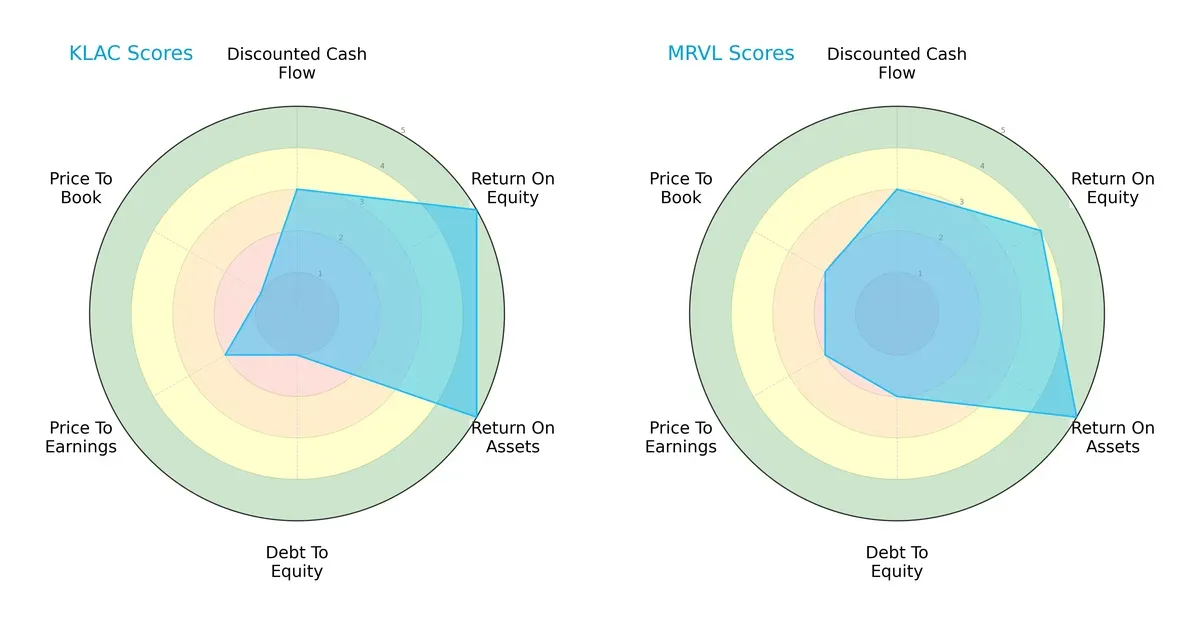
KLA leads with superior ROE (5 vs. 4) and ROA (5 vs. 5 tie), reflecting efficient profit generation and asset use. However, its debt-to-equity score (1) signals higher leverage risk than Marvell’s moderate 2. Valuation metrics favor Marvell slightly, with better P/B (2 vs. 1). Overall, Marvell presents a more balanced financial profile, while KLA relies heavily on operational efficiency but carries significant leverage risk.
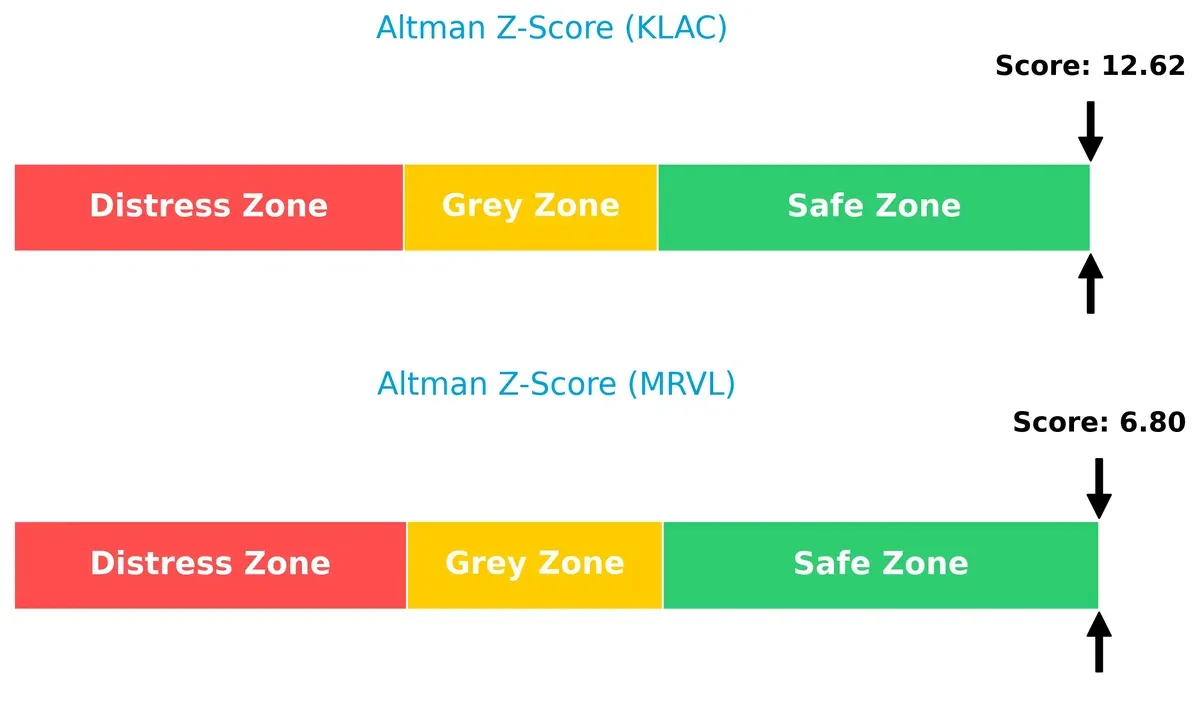
Bankruptcy Risk: Solvency Showdown
KLA’s Altman Z-Score at 12.6 far exceeds Marvell’s 6.8, placing both in the safe zone but underscoring KLA’s superior long-term solvency and resilience in this cycle:
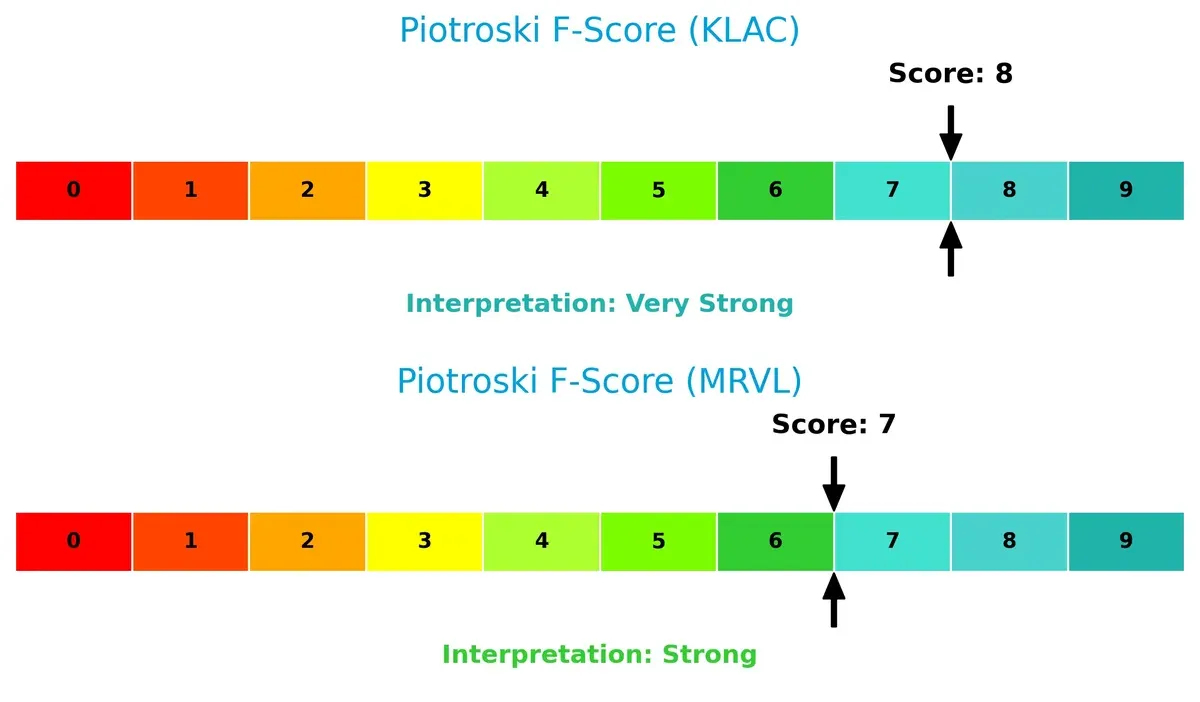
Financial Health: Quality of Operations
KLA scores an 8 on the Piotroski F-Score, indicating very strong financial health, compared to Marvell’s strong 7, reflecting solid but slightly less robust internal metrics:
How are the two companies positioned?
This section dissects KLAC and MRVL’s operational DNA by comparing revenue distribution and internal dynamics, including strengths and weaknesses. The goal is to confront their economic moats and identify which model offers the most resilient competitive advantage today.
Revenue Segmentation: The Strategic Mix
This visual comparison dissects how KLA Corporation and Marvell Technology diversify their income streams and reveals where their primary sector bets lie:
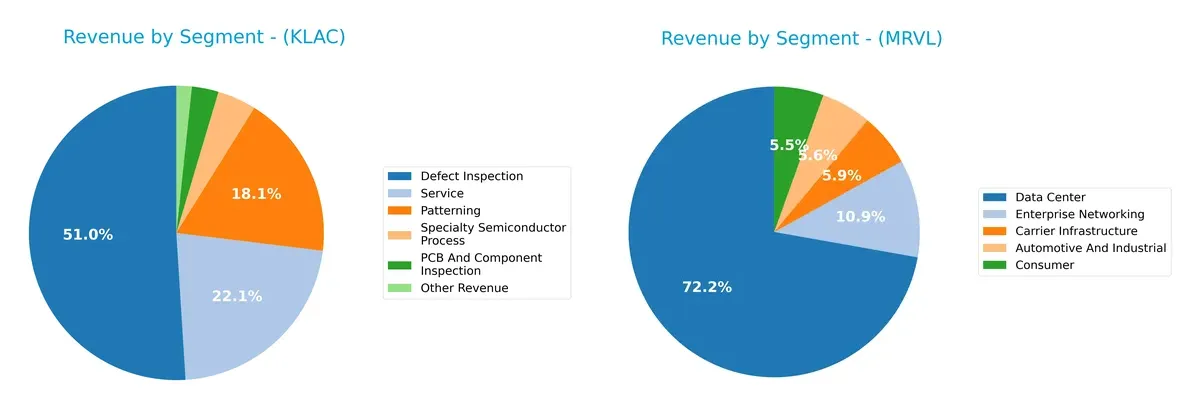
KLA leans heavily on Defect Inspection, generating $6.2B in 2025, dwarfing its other segments like Patterning ($2.2B) and Service ($2.7B). Marvell, meanwhile, pivots around Data Center revenue at $4.2B but balances with Enterprise Networking ($626M) and Carrier Infrastructure ($338M). KLA’s concentration signals infrastructure dominance but poses concentration risk. Marvell’s broader mix offers resilience through diversified end markets like automotive and consumer electronics.
Strengths and Weaknesses Comparison
This table compares the strengths and weaknesses of KLA Corporation and Marvell Technology, Inc.:
KLA Corporation Strengths
- High profitability with 33.41% net margin
- Strong ROE at 86.56%
- Favorable liquidity ratios above 1.5
- Diverse semiconductor process and inspection segments
- Significant global presence in China, Taiwan, and Korea
Marvell Technology Strengths
- Favorable debt-to-equity and current ratios indicate financial stability
- Large Data Center segment revenue of 4.16B
- Diversified revenue across automotive, enterprise, and consumer markets
- Presence in multiple international markets including China and US
KLA Corporation Weaknesses
- High valuation multiples (PE 29.34, PB 25.39) may pressure future returns
- Elevated debt-to-equity ratio of 1.3
- WACC exceeds 10%, implying higher capital costs
- Dividend yield is low at 0.76%
Marvell Technology Weaknesses
- Negative profitability ratios: net margin -15.35%, ROE -6.59%, ROIC -3.88%
- Negative interest coverage ratio signals risk
- Low asset turnover at 0.29 limits operational efficiency
- Declining or unstable revenue in some segments
KLA exhibits strong profitability and liquidity but faces valuation and leverage concerns. Marvell shows financial stability in balance sheet metrics but struggles with profitability and operational efficiency. These contrasts highlight different strategic challenges for both companies.
The Moat Duel: Analyzing Competitive Defensibility
A structural moat is the only safeguard preserving long-term profits against relentless competition erosion. Let’s examine two semiconductor leaders’ moats:
KLA Corporation: Precision Process Control Moat
KLA’s moat stems from its specialized process control technology, driving a 40.7% EBIT margin and 27.5% ROIC excess over WACC. Its growing profitability signals durable advantage. Expansion in advanced semiconductor markets should deepen this moat in 2026.
Marvell Technology, Inc.: Broad Product Portfolio Moat
Marvell leans on diverse semiconductor products but suffers a negative ROIC trend and -12.2% EBIT margin, indicating weak capital efficiency. Unlike KLA, its moat appears fragile. Market shifts in storage and networking could offer growth, yet risks remain high.
Precision Control vs. Product Breadth: The Moat Battle
KLA wields a deeper, more durable moat with strong value creation and margin stability. Marvell’s declining ROIC and losses reveal a vulnerable moat. KLA stands better poised to protect and grow its market share in 2026.
Which stock offers better returns?
Over the past year, KLA Corporation’s stock surged sharply, showing strong upward momentum while Marvell Technology, Inc. experienced modest gains followed by recent weakness.
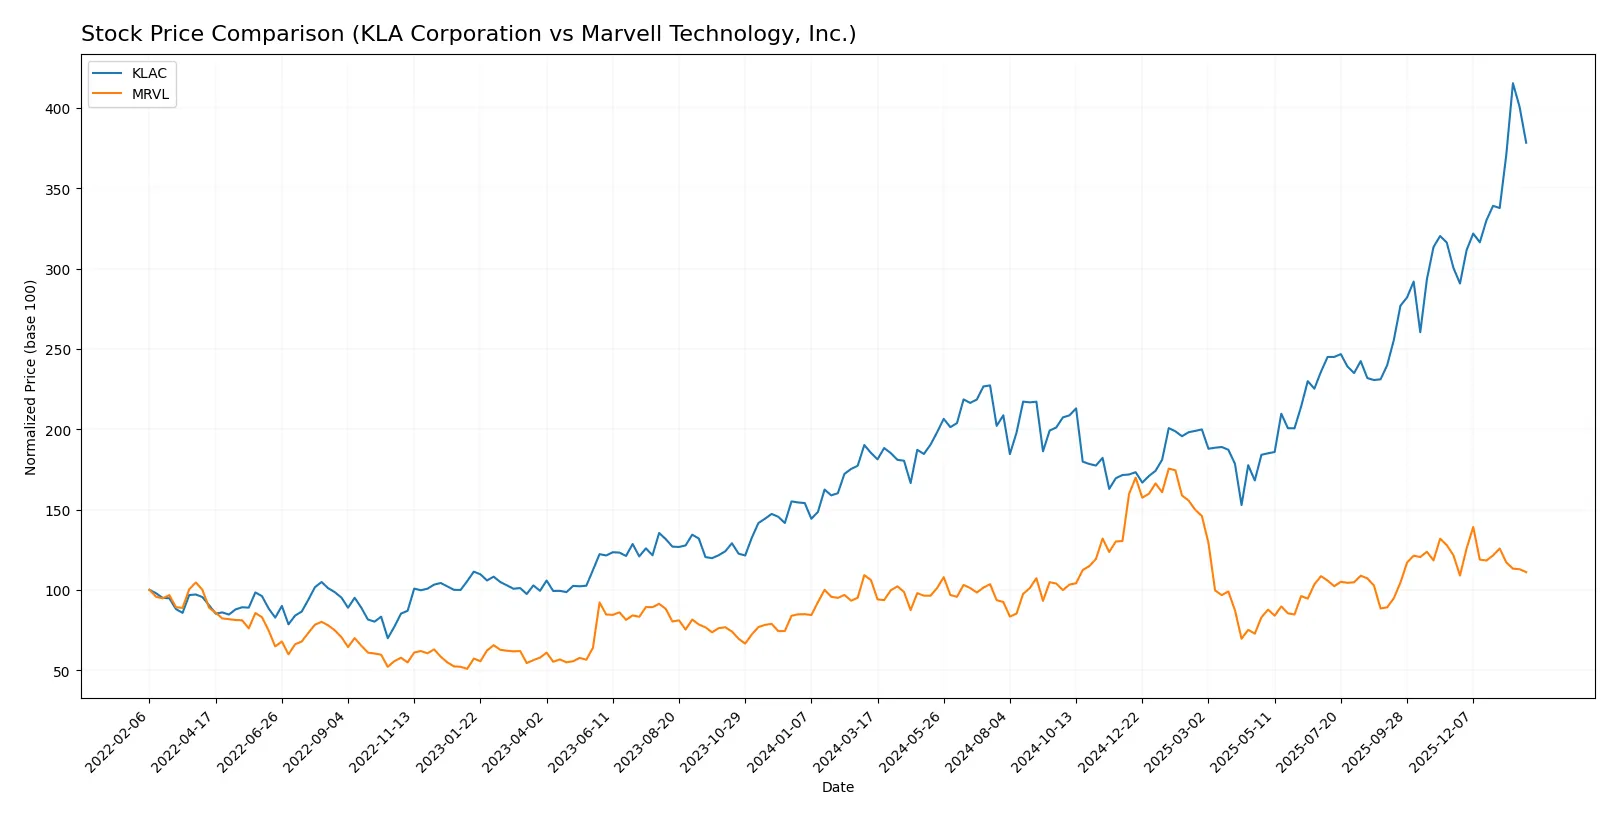
Trend Comparison
KLA Corporation’s stock rose 104.22% over the past 12 months, marking a bullish trend with accelerating gains and a high price volatility reflected by a 213.25 standard deviation.
Marvell Technology’s stock increased 4.64% over the same period, maintaining a bullish but decelerating trend with moderate volatility and recent negative price movement of -8.71%.
KLA’s stock significantly outperformed Marvell’s, delivering the highest market returns and stronger upward momentum over the analyzed year.
Target Prices
Analysts present a moderate upside potential for both KLA Corporation and Marvell Technology, reflecting cautious optimism in semiconductor demand.
| Company | Target Low | Target High | Consensus |
|---|---|---|---|
| KLA Corporation | 1400 | 1900 | 1672 |
| Marvell Technology, Inc. | 80 | 156 | 117 |
KLA’s consensus target of 1672 implies an 17% upside from its current 1428 price, signaling confidence in its advanced process control solutions. Marvell’s 117 target suggests a 48% potential gain, highlighting expectations for growth in storage and networking chips.

Don’t Let Luck Decide Your Entry Point
Optimize your entry points with our advanced ProRealTime indicators. You’ll get efficient buy signals with precise price targets for maximum performance. Start outperforming now!
How do institutions grade them?
Here are the latest institutional grades for KLA Corporation and Marvell Technology, Inc.:
KLA Corporation Grades
This table summarizes recent grades assigned to KLA Corporation by major financial institutions.
| Grading Company | Action | New Grade | Date |
|---|---|---|---|
| Oppenheimer | Maintain | Outperform | 2026-01-30 |
| Barclays | Maintain | Overweight | 2026-01-30 |
| Cantor Fitzgerald | Maintain | Overweight | 2026-01-30 |
| Jefferies | Maintain | Buy | 2026-01-30 |
| Stifel | Maintain | Buy | 2026-01-30 |
| Wells Fargo | Maintain | Overweight | 2026-01-30 |
| Needham | Maintain | Buy | 2026-01-30 |
| RBC Capital | Maintain | Sector Perform | 2026-01-30 |
| Deutsche Bank | Maintain | Hold | 2026-01-21 |
| Needham | Maintain | Buy | 2026-01-20 |
Marvell Technology, Inc. Grades
The following grades reflect recent institutional ratings for Marvell Technology, Inc.
| Grading Company | Action | New Grade | Date |
|---|---|---|---|
| Rosenblatt | Maintain | Buy | 2026-01-07 |
| Melius Research | Upgrade | Buy | 2026-01-05 |
| Benchmark | Downgrade | Hold | 2025-12-08 |
| JP Morgan | Maintain | Overweight | 2025-12-03 |
| Oppenheimer | Maintain | Outperform | 2025-12-03 |
| Roth Capital | Maintain | Buy | 2025-12-03 |
| Deutsche Bank | Maintain | Buy | 2025-12-03 |
| Needham | Maintain | Buy | 2025-12-03 |
| Evercore ISI Group | Maintain | Outperform | 2025-12-03 |
| Keybanc | Maintain | Overweight | 2025-12-03 |
Which company has the best grades?
KLA Corporation consistently receives strong buy and overweight ratings, with fewer hold grades. Marvell shows a mix of buy and outperform ratings but includes a recent downgrade to hold. KLA’s steadier positive grades may suggest greater institutional confidence.
Risks specific to each company
The following categories identify critical pressure points and systemic threats facing both firms in the 2026 market environment:
1. Market & Competition
KLA Corporation
- Dominates in semiconductor process control with strong market position but faces high competition in specialty segments.
Marvell Technology, Inc.
- Competes in diverse semiconductor niches but suffers from negative margins and weak asset turnover, indicating competitive pressure.
2. Capital Structure & Debt
KLA Corporation
- High debt-to-equity ratio (1.3) signals leverage risk despite strong interest coverage (16.37).
Marvell Technology, Inc.
- Lower debt-to-equity (0.32) reduces leverage risk, but negative interest coverage (-3.72) raises solvency concerns.
3. Stock Volatility
KLA Corporation
- Beta of 1.44 suggests moderate volatility typical for tech leaders.
Marvell Technology, Inc.
- Higher beta of 1.95 implies greater price swings and risk exposure to market cycles.
4. Regulatory & Legal
KLA Corporation
- Subject to standard semiconductor industry regulations in the US and globally; no major red flags.
Marvell Technology, Inc.
- Faces regulatory complexity due to broader geographic reach including Asia, increasing compliance risks.
5. Supply Chain & Operations
KLA Corporation
- Integrated supply chain with strong process control capabilities mitigates operational disruptions.
Marvell Technology, Inc.
- More exposed to global supply chain risks due to operations in multiple countries including emerging markets.
6. ESG & Climate Transition
KLA Corporation
- ESG initiatives supported by stable financials, but high capital intensity may challenge rapid climate transition.
Marvell Technology, Inc.
- Weaker profitability and financial metrics may limit capacity to invest aggressively in ESG improvements.
7. Geopolitical Exposure
KLA Corporation
- Primarily US-based but with global customers, faces moderate geopolitical risks from trade tensions.
Marvell Technology, Inc.
- Significant operations in Asia increase vulnerability to geopolitical instability and trade disputes.
Which company shows a better risk-adjusted profile?
KLA Corporation’s strongest risk is its elevated leverage, despite solid interest coverage and financial health. Marvell’s key risk is its negative profitability coupled with poor interest coverage, undermining solvency. I see KLA as the better risk-adjusted choice, supported by its very strong Altman Z-score (12.6) versus Marvell’s lower score (6.8). KLA’s robust Piotroski score (8) confirms financial resilience, while Marvell’s weaker score (7) reflects operational strain. The contrast in debt management and profitability trends justifies my caution toward Marvell.
Final Verdict: Which stock to choose?
KLA Corporation’s superpower lies in its robust capital efficiency and durable economic moat, reflected in its consistently growing ROIC well above WACC. This cash-generative powerhouse commands a premium valuation, which warrants vigilance given its elevated debt levels. It suits investors with an appetite for aggressive growth backed by solid fundamentals.
Marvell Technology’s strategic moat centers on its substantial R&D investment and intangible asset base, aiming for future innovation-led growth. While it offers a safer balance sheet with lower leverage, its current profitability and cash flow metrics lag significantly behind KLA’s. It fits portfolios focused on GARP—growth at a reasonable price—with a tolerance for operational turnaround risks.
If you prioritize durable value creation and high profitability, KLA outshines Marvell with its superior capital returns and financial strength. However, if you seek exposure to a potential growth rebound with a more conservative balance sheet, Marvell offers better stability amid its ongoing restructuring. Both present distinct analytical scenarios tailored to differing risk-return profiles.
Disclaimer: Investment carries a risk of loss of initial capital. The past performance is not a reliable indicator of future results. Be sure to understand risks before making an investment decision.
Go Further
I encourage you to read the complete analyses of KLA Corporation and Marvell Technology, Inc. to enhance your investment decisions: