Home > Comparison > Technology > KLAC vs LSCC
The strategic rivalry between KLA Corporation and Lattice Semiconductor Corporation shapes the semiconductor industry’s evolution. KLA operates as a capital-intensive process control and yield management leader, while Lattice focuses on programmable logic devices with a nimble, IP-driven model. This face-off contrasts scale and specialization, growth and innovation. This analysis seeks to identify which trajectory offers superior risk-adjusted returns for a diversified portfolio in a sector defined by rapid technological shifts and capital demands.
Table of contents
Companies Overview
KLA Corporation and Lattice Semiconductor drive innovation in the critical semiconductor sector, shaping technology’s future.
KLA Corporation: Semiconductor Process Control Leader
KLA Corporation dominates the semiconductor process control market with its integrated inspection and metrology systems. It generates revenue by selling advanced equipment and software that optimize chip manufacturing yield. In 2026, KLA focuses strategically on expanding its process-enabling solutions and enhancing yield management through cutting-edge diagnostics and software integration.
Lattice Semiconductor Corporation: FPGA Innovator
Lattice Semiconductor specializes in field programmable gate arrays (FPGAs) and video connectivity products. It earns revenue by selling these programmable chips and licensing IP cores globally. In 2026, Lattice prioritizes broadening its product portfolio for communications, automotive, and industrial markets while strengthening its licensing and patent monetization strategy.
Strategic Collision: Similarities & Divergences
Both companies operate in semiconductors but with contrasting philosophies. KLA builds a closed ecosystem centered on manufacturing process control, while Lattice embraces an open infrastructure via programmable logic and IP licensing. Their primary battleground is technological innovation in semiconductor efficiency and adaptability. These differences translate into distinct investment profiles: KLA offers stability through market dominance, whereas Lattice presents growth potential via flexible product offerings.
Income Statement Comparison
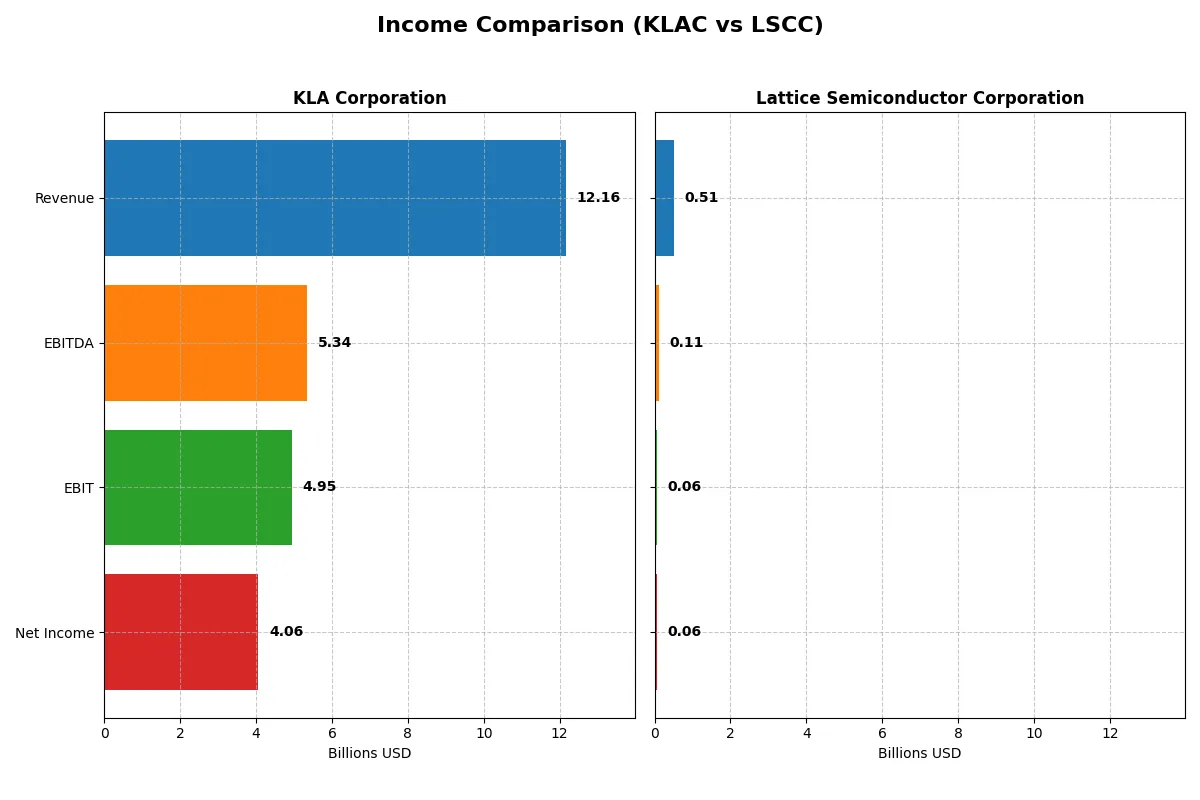
This data dissects the core profitability and scalability of both corporate engines to reveal who dominates the bottom line:
| Metric | KLA Corporation (KLAC) | Lattice Semiconductor Corporation (LSCC) |
|---|---|---|
| Revenue | 12.2B | 509M |
| Cost of Revenue | 4.58B | 169M |
| Operating Expenses | 2.33B | 306M |
| Gross Profit | 7.58B | 340M |
| EBITDA | 5.34B | 107M |
| EBIT | 4.95B | 61M |
| Interest Expense | 302M | 0.27M |
| Net Income | 4.06B | 61M |
| EPS | 30.53 | 0.44 |
| Fiscal Year | 2025 | 2024 |
Income Statement Analysis: The Bottom-Line Duel
This income statement comparison reveals which company operates its financial engine with greater efficiency and momentum.
KLA Corporation Analysis
KLA’s revenue surged from 6.9B in 2021 to 12.2B in 2025, nearly doubling its top line. Net income followed suit, rising from 2.1B to 4.1B, reflecting strong profitability. Gross and net margins remain robust at 62.3% and 33.4%, respectively. In 2025, KLA accelerated growth sharply, boosting EBIT by 41% year-over-year, showcasing operational leverage.
Lattice Semiconductor Corporation Analysis
Lattice Semiconductor’s revenue peaked at 737M in 2023 before falling 31% to 509M in 2024. Net income mirrored this volatility, dropping 76% to 61M in 2024. Despite a solid gross margin of 66.8%, its net margin is modest at 12%. The 2024 decline highlights challenges in sustaining growth and controlling costs amid weakening demand.
Growth and Margin Strength: KLA’s Dominance vs. Lattice’s Volatility
KLA outperforms clearly with steady revenue growth and expanding margins, nearly doubling net income over five years. Lattice shows commendable gross margin but suffers from recent sharp revenue and earnings declines. For investors prioritizing consistent profitability and margin expansion, KLA’s profile offers greater financial stability and growth momentum.
Financial Ratios Comparison
These vital ratios act as a diagnostic tool to expose the underlying fiscal health, valuation premiums, and capital efficiency of each company:
| Ratios | KLA Corporation (KLAC) | Lattice Semiconductor Corporation (LSCC) |
|---|---|---|
| ROE | 86.6% | 8.6% |
| ROIC | 38.0% | 4.6% |
| P/E | 29.3 | 132.7 |
| P/B | 25.4 | 11.4 |
| Current Ratio | 2.62 | 3.66 |
| Quick Ratio | 1.83 | 2.62 |
| D/E | 1.30 | 0.02 |
| Debt-to-Assets | 37.9% | 1.8% |
| Interest Coverage | 17.3 | 129.5 |
| Asset Turnover | 0.76 | 0.60 |
| Fixed Asset Turnover | 9.70 | 7.62 |
| Payout ratio | 22.3% | 0% |
| Dividend yield | 0.76% | 0% |
| Fiscal Year | 2025 | 2024 |
Efficiency & Valuation Duel: The Vital Signs
Financial ratios serve as a company’s DNA, uncovering hidden risks and operational strengths beyond surface-level results.
KLA Corporation
KLA exhibits strong profitability with an 86.6% ROE and a 33.4% net margin, signaling operational excellence. However, its valuation appears stretched, with a P/E of 29.3 and P/B at 25.4, both unfavorable. The company returns value through a modest 0.76% dividend yield, balancing shareholder payouts with reinvestment in R&D.
Lattice Semiconductor Corporation
Lattice posts weaker profitability, with an 8.6% ROE and 12% net margin, reflecting a less efficient operation. Its valuation is highly stretched, marked by a sky-high P/E of 132.7 and P/B of 11.4, both unfavorable. It pays no dividends, opting instead for aggressive reinvestment in research to fuel growth.
Premium Valuation vs. Operational Safety
KLA delivers superior profitability and a balanced risk profile despite high valuation multiples. Lattice trades at a steep premium with weaker returns, exposing investors to elevated risk. KLA suits those favoring operational stability, while Lattice fits growth-oriented investors willing to accept valuation risk.
Which one offers the Superior Shareholder Reward?
I compare KLA Corporation (KLAC) and Lattice Semiconductor Corporation (LSCC) on dividends, buybacks, and sustainable shareholder returns. KLAC pays a modest dividend yield near 0.76%, with a payout ratio around 22%, well covered by strong free cash flow of 28/share. KLAC also maintains significant buybacks, adding to total returns. LSCC pays no dividend, reinvesting heavily in R&D and growth, with free cash flow of 0.87/share and a lean balance sheet. LSCC’s buyback program is minimal, reflecting its growth focus. Historically, KLAC’s balanced model offers more predictable, sustainable shareholder rewards. I conclude KLAC provides the superior total return profile in 2026 due to its disciplined capital allocation and shareholder distributions.
Comparative Score Analysis: The Strategic Profile
The radar chart reveals the fundamental DNA and trade-offs of KLA Corporation and Lattice Semiconductor Corporation, highlighting their financial strengths and vulnerabilities:
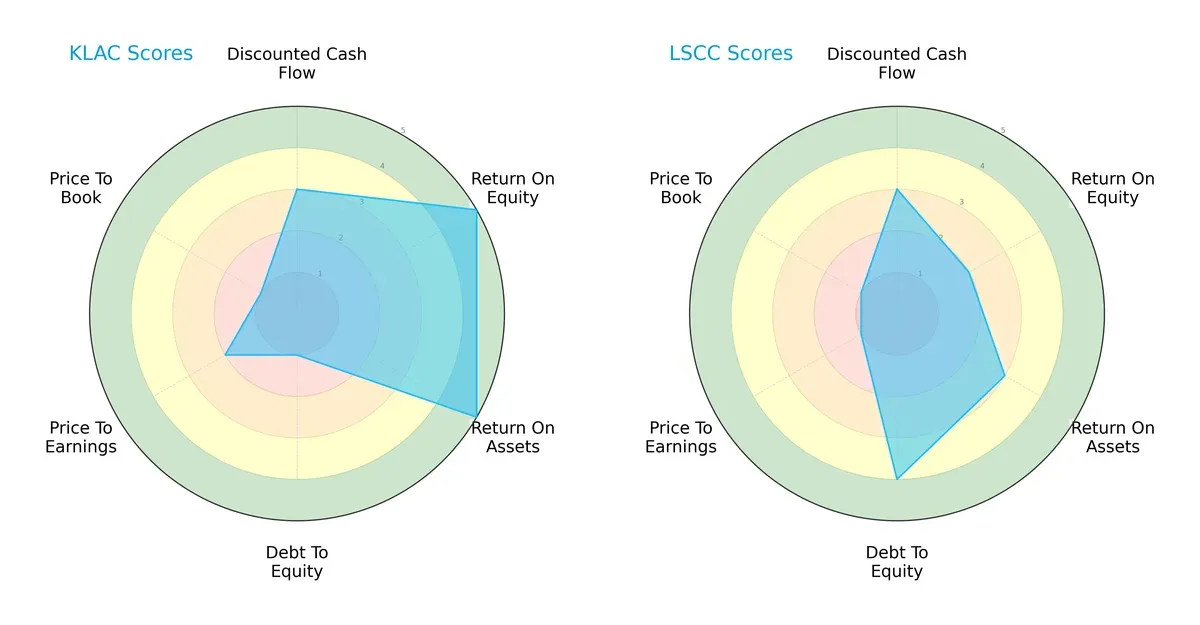
KLA dominates in profitability with very favorable ROE and ROA scores of 5 each, while Lattice Semiconductor shows moderate efficiency. Conversely, Lattice boasts a stronger balance sheet with a debt-to-equity score of 4 versus KLA’s weak 1. Valuation metrics reveal both firms face challenges, but KLA’s profile is more unbalanced, relying heavily on operational efficiency. Lattice presents a more balanced risk approach but lacks KLA’s profit generation edge.
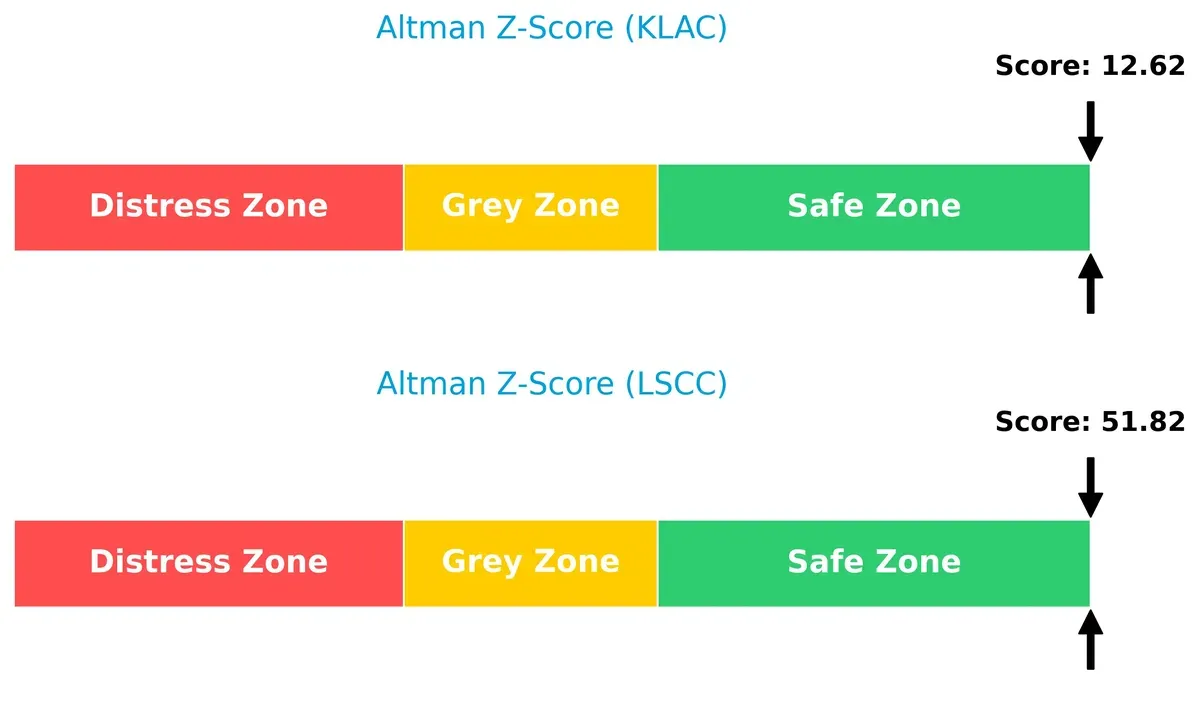
Bankruptcy Risk: Solvency Showdown
The Altman Z-Score comparison shows both companies in the safe zone, but Lattice Semiconductor’s exceptionally high score of 51.8 far exceeds KLA’s 12.6, indicating superior long-term solvency resilience in today’s cycle:
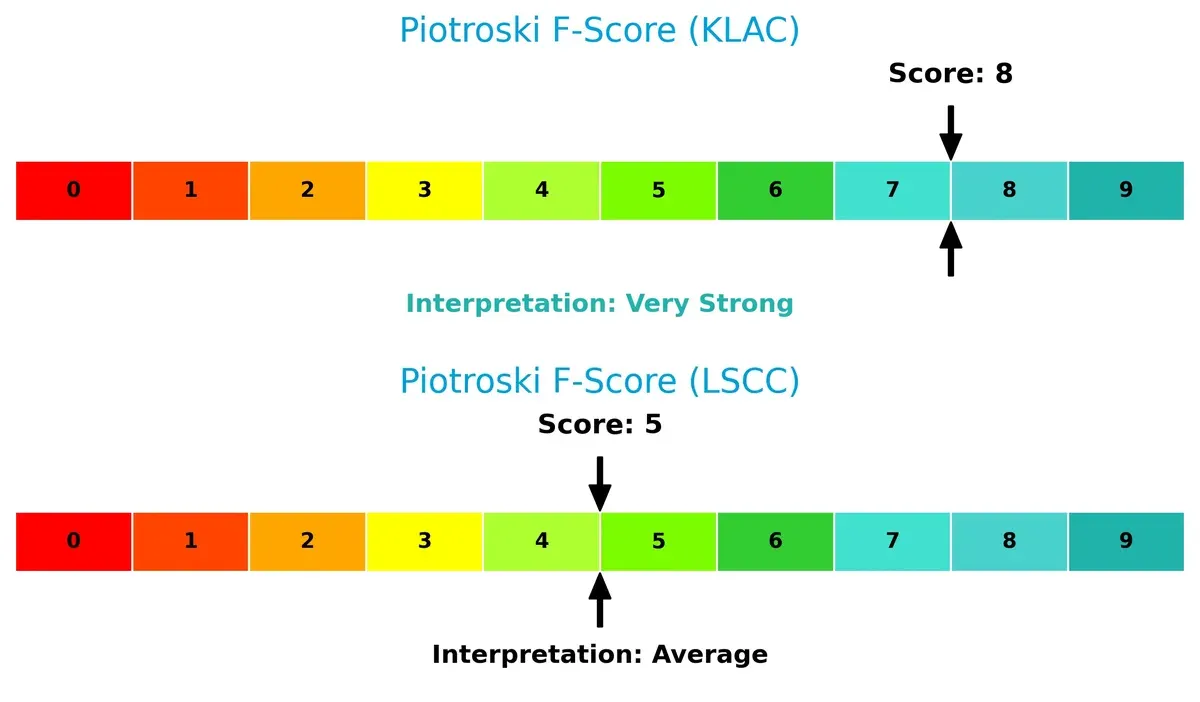
Financial Health: Quality of Operations
KLA scores an 8 on the Piotroski F-Score, signaling very strong financial health and operational quality. Lattice’s score of 5 suggests average strength with potential red flags in internal metrics compared to KLA’s robust profile:
How are the two companies positioned?
This section dissects the operational DNA of KLAC and LSCC by comparing their revenue distribution by segment and internal dynamics, including strengths and weaknesses. The objective is to confront their economic moats and identify which model offers the most resilient, sustainable competitive advantage in today’s market.
Revenue Segmentation: The Strategic Mix
This visual comparison dissects how KLA Corporation and Lattice Semiconductor diversify their income streams and where their primary sector bets lie:
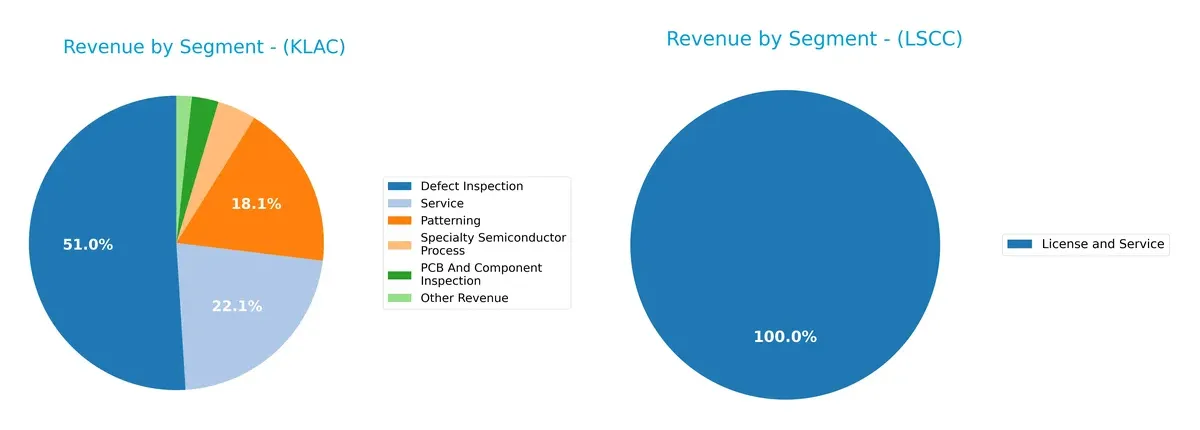
KLA’s revenue anchors in Defect Inspection at $6.2B and Service at $2.7B, showing a concentrated but strong ecosystem lock-in. Patterning ($2.2B) and Specialty Semiconductor Process ($517M) add moderate diversity. In contrast, Lattice leans heavily on Product Revenue from Distributors ($332M), with smaller contributions from Direct Sales ($51M) and License and Service ($17M). KLA’s model pivots on infrastructure dominance, while Lattice faces higher concentration risk within fewer segments.
Strengths and Weaknesses Comparison
This table compares the Strengths and Weaknesses of KLA Corporation and Lattice Semiconductor Corporation:
KLA Corporation Strengths
- High net margin at 33.41%
- Strong ROE of 86.56%
- Robust ROIC at 37.97%
- Diverse revenue streams across multiple semiconductor segments
- Solid global presence including China, Taiwan, North America
- Favorable liquidity ratios with current ratio 2.62
Lattice Semiconductor Strengths
- Favorable net margin at 12.0%
- Very low debt-to-equity at 0.02
- Strong interest coverage ratio of 228.11
- Geographic diversification across Americas, Asia, Europe
- Favorable quick ratio of 2.62
- Effective fixed asset turnover at 7.62
KLA Corporation Weaknesses
- High PE (29.34) and PB (25.39) ratios indicate premium valuation
- Debt-to-equity ratio of 1.3 is relatively high
- WACC at 10.42% unfavorable relative to ROIC
- Dividend yield low at 0.76%
- Moderate leverage with debt-to-assets at 37.89%
- Some segments like PCB inspection less significant
Lattice Semiconductor Weaknesses
- Low ROE at 8.6% and ROIC at 4.59% below WACC
- High PE ratio at 132.74
- Current ratio unfavorable despite strong quick ratio
- No dividend yield
- Limited revenue segments focused on licensing and services
- Smaller scale and lower net margin than KLA
KLA demonstrates financial strength with superior profitability and diversified revenue but trades at high valuation multiples and carries moderate debt. Lattice Semiconductor shows solid liquidity and conservative leverage but faces challenges in profitability and valuation. Each company’s financial profile suggests distinct strategic priorities regarding growth, capital efficiency, and risk management.
The Moat Duel: Analyzing Competitive Defensibility
A structural moat alone preserves long-term profits against relentless competitive pressure. Here’s how these two semiconductor players stack up:
KLA Corporation: Precision Process Control Moat
KLA’s moat stems from its advanced process control technology, driving high ROIC above WACC by 27.5%. Its financials show robust margin stability and 40%+ EBIT. Expansion in Asian markets and new inspection tech deepen this advantage in 2026.
Lattice Semiconductor Corporation: Niche FPGA Cost Moat
Lattice relies on a cost advantage in niche FPGA products, but its ROIC trails WACC by 7%, signaling value erosion. Recent revenue declines and shrinking margins highlight vulnerability, though market expansion in automotive chips offers potential upside.
Verdict: Process Innovation vs. Cost Niche
KLA’s precision-driven moat is wider and more durable, backed by rising ROIC and margin growth. Lattice’s cost moat is narrower and weakening, leaving KLA better positioned to defend and grow its market share in 2026.
Which stock offers better returns?
The past year shows stark contrasts in price dynamics: KLA Corporation surged over 100%, while Lattice Semiconductor Corporation remained nearly flat, despite both exhibiting recent acceleration phases.
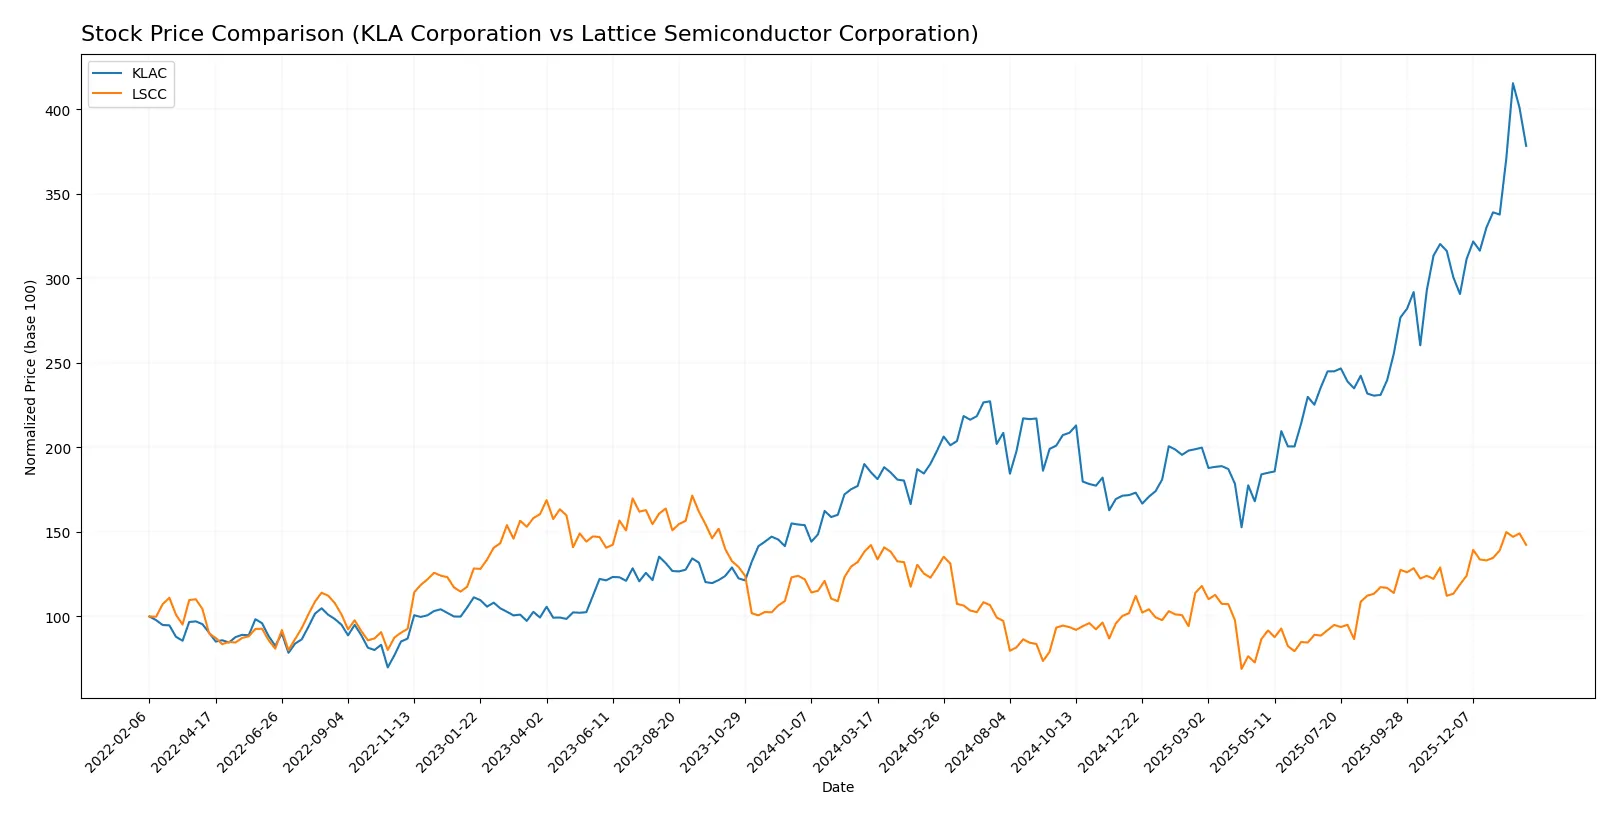
Trend Comparison
KLA Corporation’s stock rose 104.22% over the past 12 months, marking a bullish trend with accelerating gains and a high volatility reflected by a 213.25 std deviation. The price ranged from 576.53 to 1567.82, showing strong momentum.
Lattice Semiconductor Corporation’s price increased marginally by 0.09% over the same period, indicating a neutral trend. It showed acceleration but with low volatility (11.16 std deviation), and a price range between 39.03 and 84.8.
KLA’s stock delivered substantially higher market performance than Lattice Semiconductor, driven by pronounced price appreciation and stronger momentum throughout the year.
Target Prices
Analysts present a cautiously optimistic consensus for both KLA Corporation and Lattice Semiconductor Corporation.
| Company | Target Low | Target High | Consensus |
|---|---|---|---|
| KLA Corporation | 1400 | 1900 | 1672.25 |
| Lattice Semiconductor Corporation | 65 | 105 | 84.67 |
The target consensus for KLA stands well above its current price of 1427.94, indicating upside potential. Lattice Semiconductor’s consensus aligns closely with its current price of 80.52, signaling balanced expectations.

Don’t Let Luck Decide Your Entry Point
Optimize your entry points with our advanced ProRealTime indicators. You’ll get efficient buy signals with precise price targets for maximum performance. Start outperforming now!
How do institutions grade them?
The following tables summarize recent institutional grades for KLA Corporation and Lattice Semiconductor Corporation:
KLA Corporation Grades
This table lists the latest grades from major investment firms for KLA Corporation.
| Grading Company | Action | New Grade | Date |
|---|---|---|---|
| Oppenheimer | maintain | Outperform | 2026-01-30 |
| Barclays | maintain | Overweight | 2026-01-30 |
| Cantor Fitzgerald | maintain | Overweight | 2026-01-30 |
| Jefferies | maintain | Buy | 2026-01-30 |
| Stifel | maintain | Buy | 2026-01-30 |
| Wells Fargo | maintain | Overweight | 2026-01-30 |
| Needham | maintain | Buy | 2026-01-30 |
| RBC Capital | maintain | Sector Perform | 2026-01-30 |
| Deutsche Bank | maintain | Hold | 2026-01-21 |
| Needham | maintain | Buy | 2026-01-20 |
Lattice Semiconductor Corporation Grades
This table displays recent grades assigned by financial analysts to Lattice Semiconductor Corporation.
| Grading Company | Action | New Grade | Date |
|---|---|---|---|
| Susquehanna | maintain | Positive | 2026-01-22 |
| Keybanc | maintain | Overweight | 2026-01-13 |
| Baird | maintain | Outperform | 2025-11-04 |
| Rosenblatt | maintain | Buy | 2025-11-04 |
| Benchmark | maintain | Buy | 2025-11-04 |
| Stifel | maintain | Buy | 2025-11-04 |
| Needham | maintain | Buy | 2025-11-04 |
| Susquehanna | maintain | Positive | 2025-10-22 |
| Keybanc | maintain | Overweight | 2025-09-30 |
| Needham | maintain | Buy | 2025-09-22 |
Which company has the best grades?
KLA Corporation and Lattice Semiconductor both receive strong buy and outperform ratings. KLA has a broader range of overweight and buy grades from top firms, reflecting more consistent confidence. Investors may view KLA’s steady analyst support as a sign of relative stability.
Risks specific to each company
The following categories identify critical pressure points and systemic threats facing both firms in the 2026 market environment:
1. Market & Competition
KLA Corporation
- Established leader with strong process control solutions faces intense pressure from rapid semiconductor innovation cycles.
Lattice Semiconductor Corporation
- Smaller player with niche FPGA focus competes in fragmented markets, challenged by larger integrated device manufacturers.
2. Capital Structure & Debt
KLA Corporation
- Leverage is relatively high (D/E 1.3), posing moderate financial risk amid rising WACC at 10.42%.
Lattice Semiconductor Corporation
- Exceptionally low debt (D/E 0.02) offers strong financial stability and low risk from interest obligations.
3. Stock Volatility
KLA Corporation
- Beta of 1.44 indicates moderate volatility, aligned with semiconductor sector averages.
Lattice Semiconductor Corporation
- Higher beta of 1.67 signals greater stock price fluctuations and higher investor risk.
4. Regulatory & Legal
KLA Corporation
- Operates globally with exposure to U.S. export controls on advanced semiconductor tech.
Lattice Semiconductor Corporation
- Faces regulatory scrutiny in key markets but benefits from less complex compliance demands.
5. Supply Chain & Operations
KLA Corporation
- Complex, global supply chain vulnerable to geopolitical tensions and chip shortages.
Lattice Semiconductor Corporation
- Smaller scale supply chain enables agility but risks dependency on limited suppliers.
6. ESG & Climate Transition
KLA Corporation
- Increasing pressure to reduce carbon footprint and align with semiconductor industry’s climate goals.
Lattice Semiconductor Corporation
- Growing focus on ESG compliance, though currently less publicly scrutinized due to smaller size.
7. Geopolitical Exposure
KLA Corporation
- Significant exposure to U.S.-China tensions affecting semiconductor technology exports.
Lattice Semiconductor Corporation
- Moderate geopolitical risk due to diversified customer base but impacted by global trade uncertainties.
Which company shows a better risk-adjusted profile?
KLA Corporation’s main risk lies in its leverage amid rising capital costs and geopolitical tensions. Lattice Semiconductor’s key risk is its high stock volatility and valuation multiples, raising concerns about price sustainability. Overall, KLA presents a more balanced risk-adjusted profile, supported by robust profitability and strong Altman Z-Score. Recent data shows Lattice’s extremely high P/E ratio (132.74) flags significant valuation risk despite low debt, reinforcing investor caution.
Final Verdict: Which stock to choose?
KLA Corporation’s superpower lies in its durable competitive advantage, demonstrated by a soaring ROIC well above its cost of capital. It consistently converts innovation into robust profitability and cash flow. A point of vigilance is its elevated debt-to-equity ratio, which could pressure financial flexibility. It fits well in portfolios seeking aggressive growth with a solid technological moat.
Lattice Semiconductor’s strategic moat is its lean balance sheet and strong liquidity, offering safety and operational resilience. However, it struggles to convert R&D into high returns, reflected in a declining ROIC trend. Compared to KLA, it offers a more conservative risk profile but limited growth efficiency. It suits GARP investors balancing growth potential with financial prudence.
If you prioritize robust value creation and market leadership, KLA outshines with its superior profitability and expanding economic moat. However, if you seek a lower-risk, well-capitalized name with steady liquidity, Lattice Semiconductor offers better stability despite its weaker returns. Each scenario aligns with distinct investor profiles navigating growth versus safety in semiconductor exposure.
Disclaimer: Investment carries a risk of loss of initial capital. The past performance is not a reliable indicator of future results. Be sure to understand risks before making an investment decision.
Go Further
I encourage you to read the complete analyses of KLA Corporation and Lattice Semiconductor Corporation to enhance your investment decisions: