Home > Comparison > Financial Services > KKR vs BK
The strategic rivalry between KKR & Co. Inc. and The Bank of New York Mellon Corporation shapes the asset management landscape. KKR operates as a private equity and real estate investment firm with a global, diversified portfolio. In contrast, BNY Mellon delivers comprehensive custody, wealth, and investment services with a broad client base. This analysis evaluates their distinct business models to identify which offers a superior risk-adjusted return for diversified portfolios in a dynamic financial sector.

Table of contents
Companies Overview
KKR & Co. Inc. and The Bank of New York Mellon Corporation are pivotal players in global asset management, shaping financial services worldwide.
KKR & Co. Inc.: Global Private Equity Powerhouse
KKR is a leading private equity and real estate investment firm. It generates revenue by executing leveraged buyouts, growth equity, and credit special situations across diverse sectors. In 2026, KKR focuses on impact investments and expanding its global footprint, targeting mid to large enterprises with strategic minority and controlling stakes.
The Bank of New York Mellon Corporation: Custody and Wealth Management Giant
BNY Mellon specializes in custody, wealth management, and securities services. Its core revenue stems from custody, clearing, and investment management solutions for institutional and high-net-worth clients. The firm prioritizes integrated cash management and technology-driven services to enhance client solutions in a competitive asset servicing market.
Strategic Collision: Similarities & Divergences
KKR and BNY Mellon both thrive in asset management, yet KKR pursues active ownership and private equity investments, while BNY Mellon offers custodial and wealth management services. Their primary battleground is the institutional investment space, where KKR targets direct equity control and BNY Mellon focuses on service infrastructure. These contrasting models define distinct risk and return profiles for investors.
Income Statement Comparison
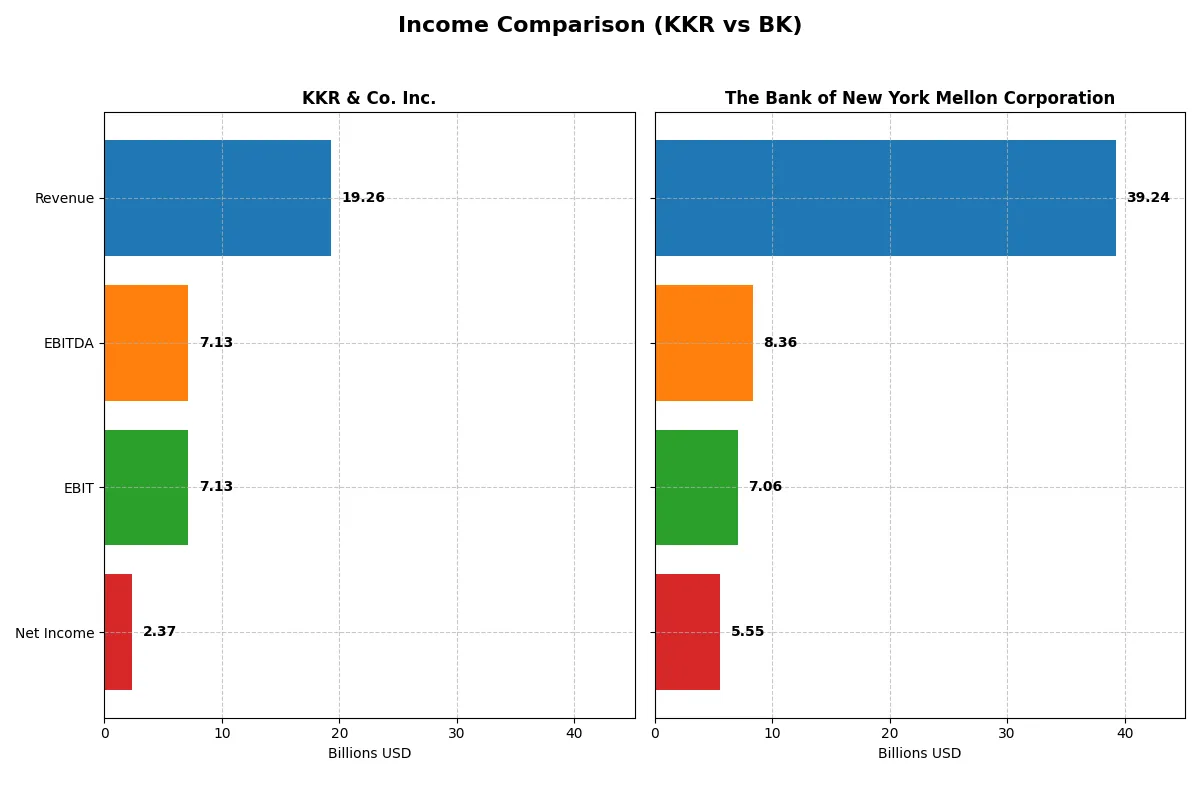
This data dissects the core profitability and scalability of both corporate engines to reveal who dominates the bottom line in the most recent fiscal year:
| Metric | KKR & Co. Inc. (KKR) | The Bank of New York Mellon Corporation (BK) |
|---|---|---|
| Revenue | 19.3B | 39.2B |
| Cost of Revenue | 11.2B | 19.4B |
| Operating Expenses | 7.6B | 12.8B |
| Gross Profit | 8.1B | 19.9B |
| EBITDA | 7.1B | 8.4B |
| EBIT | 7.1B | 7.1B |
| Interest Expense | 2.3B | 20.7B |
| Net Income | 2.4B | 5.5B |
| EPS | 2.52 | 7.46 |
| Fiscal Year | 2025 | 2025 |
Income Statement Analysis: The Bottom-Line Duel
This income statement comparison reveals the true efficiency and profitability of KKR & Co. Inc. and The Bank of New York Mellon Corporation over recent years.
KKR & Co. Inc. Analysis
KKR’s revenue grew 20% from 2021 to 2025 but dipped nearly 11% in the last year. Net income declined sharply by 50% over the period. Its gross margin stands strong at 41.8%, while net margin slipped to 12.3%. The 2025 decline in EBIT and net margin signals waning operational momentum and pressure on profitability.
The Bank of New York Mellon Corporation Analysis
BK’s revenue surged 147% over five years but declined slightly by 0.8% in 2025. Net income rose 48% overall and expanded 23% last year. Gross margin is robust at 50.6%, though EBIT margin is restrained at 18%. The bank improved net margin to 14.1%, reflecting solid operational efficiency and earnings growth momentum in 2025.
Margin Efficiency vs. Growth Resilience
BK outperforms KKR with higher and improving net margins and consistent net income growth. KKR shows weaker margin expansion and a declining bottom line despite revenue gains. For investors prioritizing steady profit growth and margin stability, BK’s profile appears more attractive given its favorable earnings trajectory and operational efficiency.
Financial Ratios Comparison
These vital ratios act as a diagnostic tool to expose the underlying fiscal health, valuation premiums, and capital efficiency of each company:
| Ratios | KKR & Co. Inc. (KKR) | The Bank of New York Mellon Corporation (BK) |
|---|---|---|
| ROE | 13.0% (2024) | 12.5% (2025) |
| ROIC | 0.25% (2024) | 6.38% (2025) |
| P/E | 42.6 (2024) | 14.7 (2025) |
| P/B | 5.55 (2024) | 1.85 (2025) |
| Current Ratio | 4.12 (2024) | 0.70 (2025) |
| Quick Ratio | 4.12 (2024) | 0.70 (2025) |
| D/E | 2.15 (2024) | 0.76 (2025) |
| Debt-to-Assets | 14.1% (2024) | 7.17% (2025) |
| Interest Coverage | 0.28 (2024) | 0.34 (2025) |
| Asset Turnover | 0.060 (2024) | 0.083 (2025) |
| Fixed Asset Turnover | 12.23 (2024) | 10.96 (2025) |
| Payout ratio | 19.9% (2024) | 25.4% (2025) |
| Dividend yield | 0.47% (2024) | 1.72% (2025) |
| Fiscal Year | 2024 | 2025 |
Efficiency & Valuation Duel: The Vital Signs
Financial ratios serve as a company’s DNA, uncovering hidden risks and highlighting operational strengths investors must understand.
KKR & Co. Inc.
KKR posts a solid 13.0% ROE and a favorable 14.2% net margin, signaling decent profitability. However, its valuation is stretched with a high P/E of 42.7 and P/B of 5.55. Dividend yield is low at 0.47%, reflecting a preference for reinvestment over shareholder payouts.
The Bank of New York Mellon Corporation
BK shows a comparable 12.5% ROE and a nearly identical 14.1% net margin. It trades at a reasonable P/E of 14.7 and a neutral P/B near 1.85, suggesting fair valuation. BK offers a higher dividend yield of 1.72%, balancing income with moderate growth.
Premium Valuation vs. Operational Safety
KKR’s premium valuation contrasts with BK’s more reasonable pricing. KKR’s elevated multiples imply higher risk, while BK offers steadier returns with income appeal. Investors seeking growth might lean toward KKR; income-focused profiles may prefer BK’s safer, dividend-rich structure.
Which one offers the Superior Shareholder Reward?
I compare KKR & Co. Inc. and The Bank of New York Mellon Corporation on dividends, payout ratios, and buybacks. KKR yields 0.47% with a 20% payout ratio and moderate buybacks, prioritizing reinvestment for growth. BK offers a 1.72% dividend yield, a 25% payout ratio, and consistent share repurchases, reflecting a balanced distribution. BK’s higher yield and payout suggest a stronger income focus, while KKR’s strategy leans on capital deployment for future gains. Considering sustainability and total return in 2026, BK delivers a more attractive shareholder reward through its reliable dividends and buybacks.
Comparative Score Analysis: The Strategic Profile
The radar chart reveals the fundamental DNA and trade-offs of KKR & Co. Inc. and The Bank of New York Mellon Corporation:
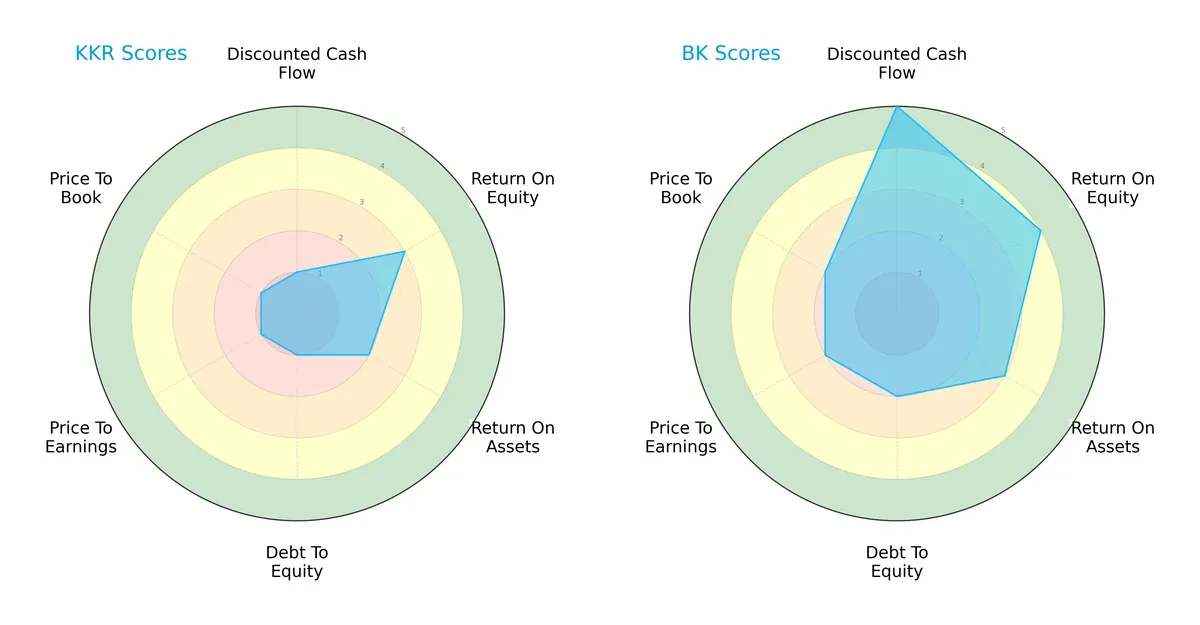
KKR shows significant weaknesses with very unfavorable scores in DCF, debt-to-equity, and valuation metrics. It relies heavily on moderate ROE but suffers from poor asset returns. BK offers a more balanced profile, excelling in DCF and profitability measures, though its debt and valuation scores remain unfavorable. BK’s strategic positioning appears more robust and diversified.
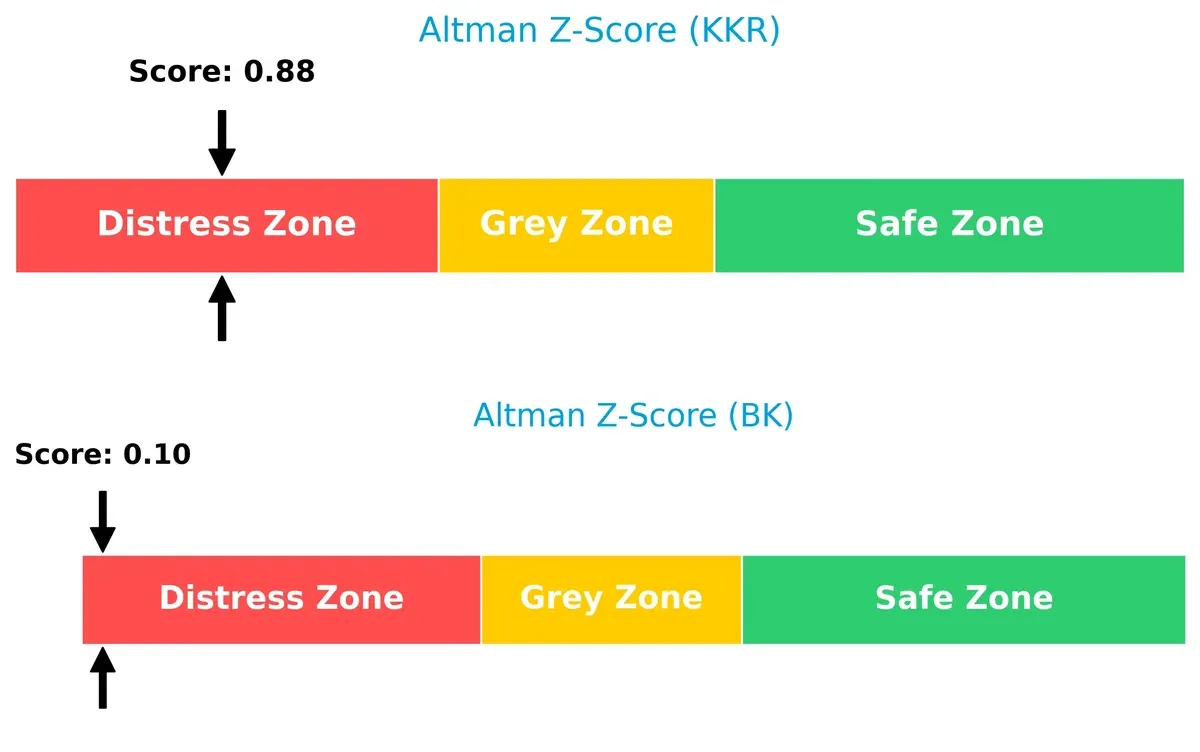
Bankruptcy Risk: Solvency Showdown
Both KKR and BK fall into the distress zone with Altman Z-Scores well below 1.8, signaling high bankruptcy risk in the current market cycle:
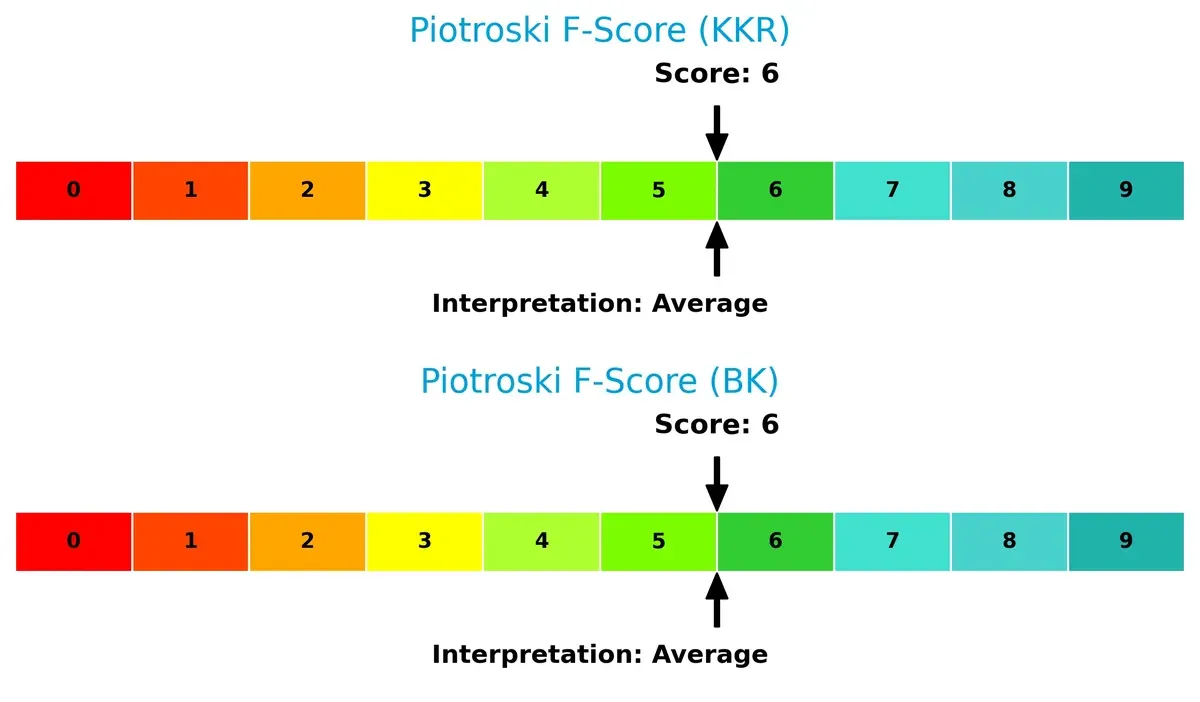
Financial Health: Quality of Operations
KKR and BK both post Piotroski F-Scores of 6, indicating average financial health. Neither shows critical red flags, but neither reaches peak operational strength:
How are the two companies positioned?
This section dissects the operational DNA of KKR and BK by comparing their revenue distribution and internal dynamics. The goal is to confront their economic moats to reveal which model offers the most resilient, sustainable competitive advantage today.
Revenue Segmentation: The Strategic Mix
This visual comparison dissects how KKR & Co. Inc. and The Bank of New York Mellon Corporation diversify their income streams and where their primary sector bets lie:
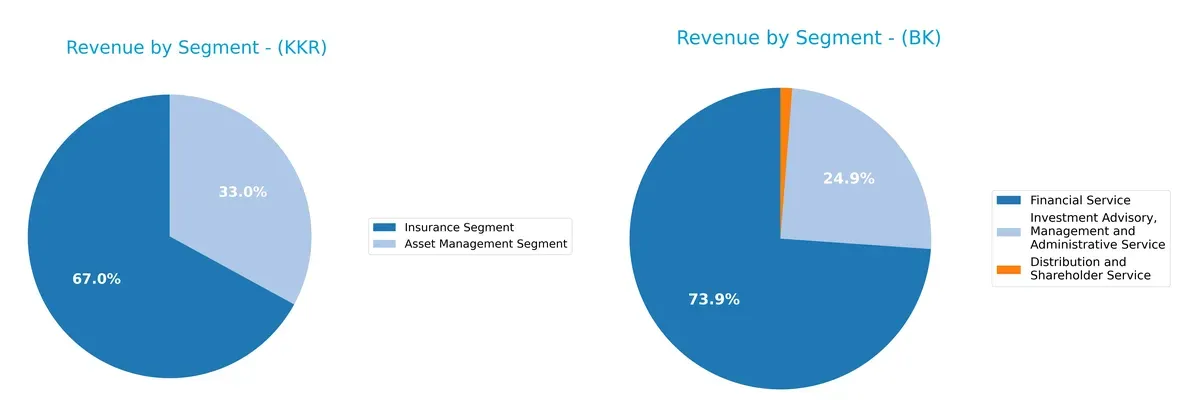
KKR leans heavily on its Insurance Segment, which dwarfs its Asset Management Segment at $14.7B versus $7.2B in 2024, showing moderate diversification. BK, meanwhile, anchors on Financial Service with $9.3B, supported by a strong $3.1B Investment Advisory segment, reflecting a more balanced mix. KKR’s concentration in insurance signals exposure to sector-specific risks, while BK’s diversification supports resilience through varied wealth and financial services.
Strengths and Weaknesses Comparison
This table compares the strengths and weaknesses of KKR & Co. Inc. and The Bank of New York Mellon Corporation based on diversification, profitability, financials, innovation, global presence, and market share:
KKR Strengths
- Strong growth in insurance and asset management segments
- Favorable net margin at 14.22%
- High quick ratio at 4.12 indicates liquidity
- Favorable debt-to-assets ratio at 14.11%
- High fixed asset turnover at 12.23
BK Strengths
- Balanced revenue across financial and advisory services
- Favorable net margin at 14.14%
- Reasonable price-to-earnings ratio at 14.74
- Favorable fixed asset turnover at 10.96
- Global revenue presence across Asia Pacific, EMEA, and US
KKR Weaknesses
- Unfavorable ROIC at 0.25% signals weak capital efficiency
- High price-to-book ratio at 5.55 suggests overvaluation
- Current ratio high at 4.12 may indicate inefficient asset use
- Debt-to-equity ratio at 2.15 is elevated
- Low dividend yield at 0.47%
BK Weaknesses
- Low current and quick ratios at 0.7 indicate liquidity pressure
- High WACC at 19.63% raises capital cost concerns
- Weak interest coverage at 0.34 suggests vulnerability
- Unfavorable asset turnover at 0.08
- Moderate dividend yield at 1.72%
KKR shows strengths in segment growth and liquidity but suffers from capital efficiency and valuation issues. BK benefits from diversified global revenue and favorable valuation yet faces liquidity and capital cost challenges. These factors shape each company’s strategic priorities in managing growth and financial health.
The Moat Duel: Analyzing Competitive Defensibility
A structural moat protects long-term profits from competition erosion. Without it, profits erode relentlessly. Let’s examine KKR and BNY Mellon’s moats:
KKR & Co. Inc.: Diversified Investment Expertise
KKR’s moat stems from deep intangible assets and industry knowledge in private equity and real estate. This shows in stable margins despite volatile revenue. New markets in Asia and infrastructure could deepen its edge in 2026.
The Bank of New York Mellon Corporation: Scale and Network Effects
BK leverages scale and network effects in securities and wealth services, contrasting KKR’s boutique focus. Its growing ROIC supports efficient capital use. Expansion in global custody and data analytics could widen its moat.
Moat Battle: Intangible Expertise vs. Scale Dominance
BK’s growing ROIC and network scale offer a slightly wider moat than KKR, whose ROIC is declining. BK is better positioned to defend market share amid rising competition in asset management.
Which stock offers better returns?
Over the past year, both KKR & Co. Inc. and The Bank of New York Mellon Corporation displayed notable price movements, with contrasting trading dynamics and momentum shifts.
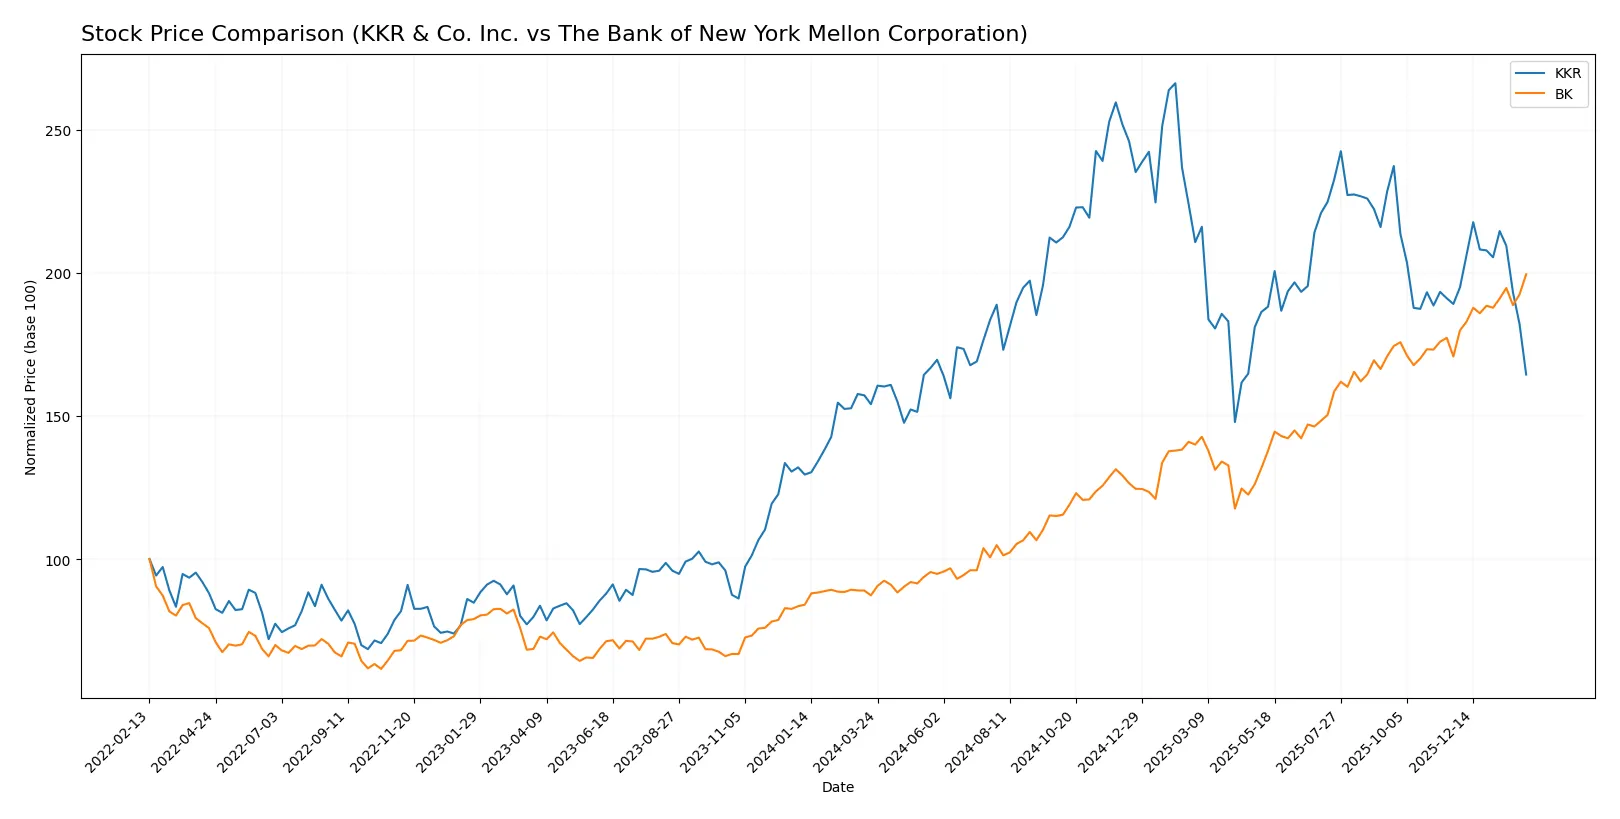
Trend Comparison
KKR’s stock gained 6.72% over the last 12 months, showing a bullish trend but with decelerating momentum. Prices ranged from 92.62 to 167.07, reflecting moderate volatility.
BK’s stock surged 128.49% over the same period, exhibiting a strong bullish trend with accelerating momentum. The price fluctuated between 54.41 and 124.32, showing higher volatility than KKR.
BK outperformed KKR substantially, delivering the highest market returns and continuing strong recent momentum compared to KKR’s recent bearish phase.
Target Prices
Analysts present a confident target consensus suggesting upside potential for both KKR & Co. Inc. and The Bank of New York Mellon Corporation.
| Company | Target Low | Target High | Consensus |
|---|---|---|---|
| KKR & Co. Inc. | 125 | 187 | 156 |
| The Bank of New York Mellon Corporation | 110 | 143 | 130.25 |
The target consensus for KKR at 156 indicates a 51% premium to its current 103.2 price, while BNY Mellon’s 130.25 target suggests a modest 5% upside from 124.32. Analysts expect stronger growth from KKR relative to BNY Mellon.

Don’t Let Luck Decide Your Entry Point
Optimize your entry points with our advanced ProRealTime indicators. You’ll get efficient buy signals with precise price targets for maximum performance. Start outperforming now!
How do institutions grade them?
Here is a summary of the recent institutional grades for KKR & Co. Inc. and The Bank of New York Mellon Corporation:
KKR & Co. Inc. Grades
The following table shows recent analyst grades from reputable firms for KKR:
| Grading Company | Action | New Grade | Date |
|---|---|---|---|
| Oppenheimer | Maintain | Outperform | 2026-02-06 |
| Barclays | Maintain | Overweight | 2026-02-06 |
| TD Cowen | Downgrade | Hold | 2026-01-14 |
| UBS | Maintain | Buy | 2026-01-13 |
| Barclays | Maintain | Overweight | 2026-01-09 |
| Barclays | Maintain | Overweight | 2025-12-12 |
| Barclays | Maintain | Overweight | 2025-11-11 |
| Oppenheimer | Maintain | Outperform | 2025-11-10 |
| TD Cowen | Maintain | Buy | 2025-11-10 |
| Morgan Stanley | Maintain | Overweight | 2025-10-21 |
The Bank of New York Mellon Corporation Grades
The following table summarizes recent analyst grades for The Bank of New York Mellon Corporation:
| Grading Company | Action | New Grade | Date |
|---|---|---|---|
| Keefe, Bruyette & Woods | Maintain | Outperform | 2026-01-14 |
| Citigroup | Maintain | Neutral | 2026-01-14 |
| RBC Capital | Maintain | Sector Perform | 2026-01-14 |
| Wells Fargo | Maintain | Equal Weight | 2026-01-14 |
| Morgan Stanley | Maintain | Overweight | 2026-01-14 |
| TD Cowen | Maintain | Buy | 2026-01-07 |
| Truist Securities | Upgrade | Buy | 2026-01-07 |
| Barclays | Maintain | Overweight | 2026-01-05 |
| Morgan Stanley | Maintain | Overweight | 2025-12-17 |
| TD Cowen | Maintain | Buy | 2025-10-20 |
Which company has the best grades?
KKR has a strong consensus around “Overweight” and “Outperform,” though TD Cowen recently downgraded it to “Hold.” The Bank of New York Mellon shows more mixed grades including “Neutral” and “Sector Perform,” but also several “Buy” and “Overweight” ratings. Investors may see KKR’s grade profile as more consistently positive.
Risks specific to each company
The following categories identify the critical pressure points and systemic threats facing both firms in the 2026 market environment:
1. Market & Competition
KKR & Co. Inc.
- Faces intense competition in private equity and real estate sectors, requiring constant deal sourcing and portfolio management excellence.
The Bank of New York Mellon Corporation
- Competes in asset management and custody with pressure from fintech disruptors and margin compression.
2. Capital Structure & Debt
KKR & Co. Inc.
- Exhibits high debt-to-equity ratio (2.15), signaling elevated financial risk. Interest coverage is moderate (3.1).
The Bank of New York Mellon Corporation
- Maintains moderate leverage (D/E 0.76) but faces poor interest coverage (0.34), raising concerns about debt servicing ability.
3. Stock Volatility
KKR & Co. Inc.
- Beta near 1.99 indicates high stock volatility, reflecting sensitivity to market swings and risk appetite.
The Bank of New York Mellon Corporation
- Beta of 1.09 shows moderate volatility, implying more stable stock price movements relative to the market.
4. Regulatory & Legal
KKR & Co. Inc.
- Operates globally with exposure to complex regulations across multiple jurisdictions, increasing compliance costs.
The Bank of New York Mellon Corporation
- Faces stringent banking and securities regulations, with potential legal risk from fiduciary and custody responsibilities.
5. Supply Chain & Operations
KKR & Co. Inc.
- Relies on diversified deal pipelines and operational integration of portfolio companies, vulnerable to economic cycles.
The Bank of New York Mellon Corporation
- Depends on technology infrastructure and operational efficiency; cyber risks and service disruptions pose significant threats.
6. ESG & Climate Transition
KKR & Co. Inc.
- Increasing focus on impact investing and renewable energy assets could raise transition costs but offers differentiation.
The Bank of New York Mellon Corporation
- ESG integration in investment and custody services is growing; regulatory pressure on sustainable finance increases compliance complexity.
7. Geopolitical Exposure
KKR & Co. Inc.
- Global investments across Asia, Europe, and emerging markets expose KKR to geopolitical volatility and currency risks.
The Bank of New York Mellon Corporation
- International operations expose BK to geopolitical tensions affecting capital flows and cross-border financial services.
Which company shows a better risk-adjusted profile?
KKR’s highest risk lies in its elevated leverage and stock volatility, increasing financial and market exposure. BK’s critical risk is weak interest coverage, threatening debt sustainability. Despite both in distress zones for bankruptcy risk, BK’s lower beta and moderate leverage suggest a marginally better risk-adjusted profile. BK’s strong recent discounted cash flow score signals relatively more stable valuation, justifying cautious investor preference.
Final Verdict: Which stock to choose?
KKR & Co. Inc. showcases a superpower in generating strong gross and EBIT margins, reflecting operational efficiency. However, its declining ROIC and elevated leverage demand vigilance. It suits investors willing to embrace cyclical volatility in pursuit of potential long-term gains, fitting an Aggressive Growth profile.
The Bank of New York Mellon Corporation offers a strategic moat through steady revenue growth and improving profitability, supported by a growing ROIC trend despite some value erosion. Its more balanced capital structure provides relative safety versus KKR, appealing to those seeking GARP (Growth at a Reasonable Price) opportunities.
If you prioritize aggressive expansion and operational leverage, KKR might be the compelling choice due to its margin strength and growth potential despite financial risks. However, if you seek stability with improving returns and a stronger growth trajectory, BK offers better stability and a more favorable risk-reward balance. Both require careful risk management given their respective financial nuances.
Disclaimer: Investment carries a risk of loss of initial capital. The past performance is not a reliable indicator of future results. Be sure to understand risks before making an investment decision.
Go Further
I encourage you to read the complete analyses of KKR & Co. Inc. and The Bank of New York Mellon Corporation to enhance your investment decisions: