Home > Comparison > Financial Services > KKR vs TROW
The strategic rivalry between KKR & Co. Inc. and T. Rowe Price Group, Inc. shapes the asset management landscape. KKR operates as a global private equity powerhouse with diversified investments across sectors and geographies. In contrast, T. Rowe Price focuses on public equity and fixed income mutual funds with a disciplined, research-driven approach. This analysis evaluates which firm’s business model offers superior risk-adjusted returns for a diversified portfolio amid evolving market dynamics.
Table of contents
Companies Overview
KKR & Co. Inc. and T. Rowe Price Group, Inc. stand as prominent leaders in the asset management sector, shaping global investment landscapes.
KKR & Co. Inc.: Global Private Equity Powerhouse
KKR commands the private equity and real estate investment market with a diversified approach. It generates revenue through acquisitions, leveraged buyouts, and credit special situations across multiple industries worldwide. In 2026, KKR focuses on strategic investments in energy, technology, and impact-driven sectors, maintaining a robust global footprint from the Americas to Asia.
T. Rowe Price Group, Inc.: Premier Public Market Investor
T. Rowe Price thrives as a publicly owned investment manager specializing in mutual funds for individuals and institutions. It earns primarily from managing equity and fixed income portfolios globally, applying fundamental and quantitative research. Its 2026 strategy emphasizes socially responsible investing and late-stage venture capital, reinforcing its commitment to ESG factors and innovation-driven growth.
Strategic Collision: Similarities & Divergences
KKR pursues a control-oriented, private equity model investing in diverse sectors and geographies, while T. Rowe Price champions an open-market mutual fund approach grounded in public equities. Their competition centers on capturing investor capital across public and private domains. Their distinct profiles reflect contrasting risk-return dynamics: KKR targets long-term value creation through ownership, T. Rowe Price delivers steady growth via diversified asset management.
Income Statement Comparison
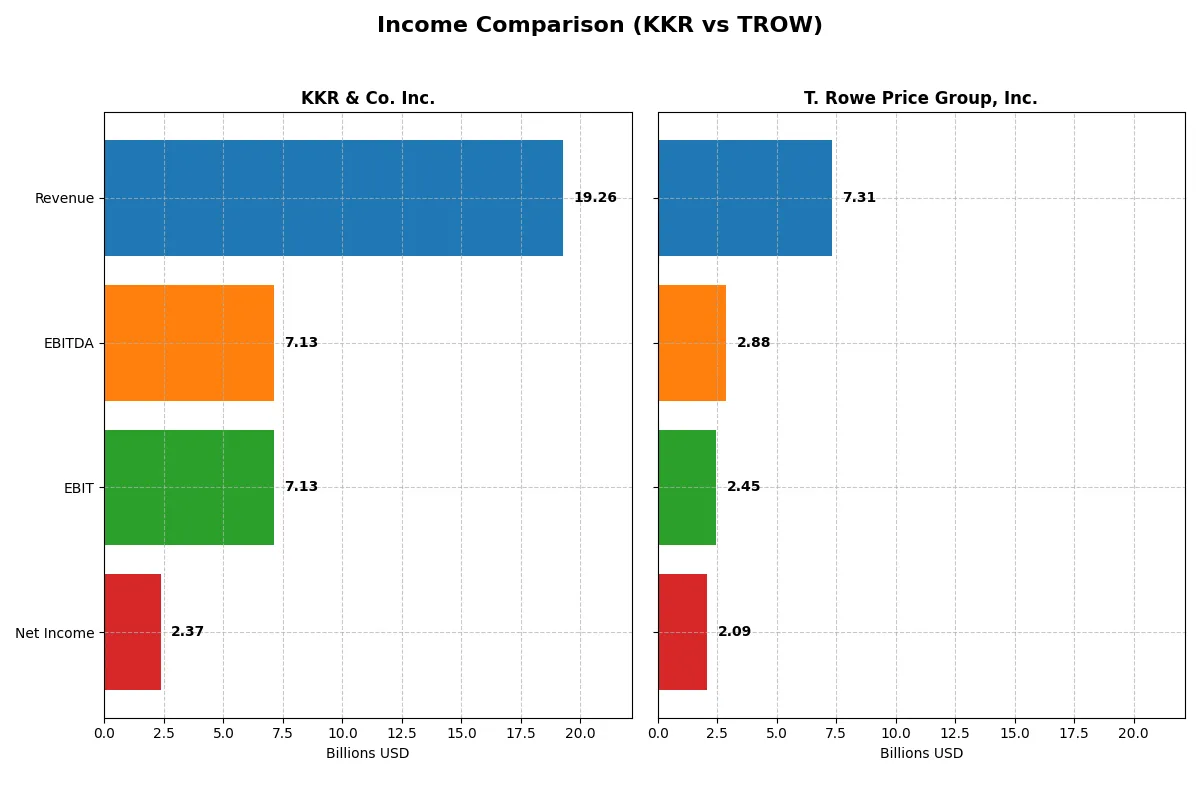
This data dissects the core profitability and scalability of both corporate engines to reveal who dominates the bottom line:
| Metric | KKR & Co. Inc. (KKR) | T. Rowe Price Group, Inc. (TROW) |
|---|---|---|
| Revenue | 19.3B | 7.3B |
| Cost of Revenue | 11.2B | 2.7B |
| Operating Expenses | 7.6B | 2.4B |
| Gross Profit | 8.1B | 4.6B |
| EBITDA | 7.1B | 2.9B |
| EBIT | 7.1B | 2.4B |
| Interest Expense | 2.3B | 0 |
| Net Income | 2.4B | 2.1B |
| EPS | 2.52 | 9.26 |
| Fiscal Year | 2025 | 2025 |
Income Statement Analysis: The Bottom-Line Duel
This income statement comparison reveals which company drives greater operational efficiency and profit generation in 2025.
KKR & Co. Inc. Analysis
KKR’s revenue declined 11% in 2025 to $19.3B, while net income fell 23% to $2.37B. Despite revenue pressure, a strong gross margin of 41.8% and net margin of 12.3% demonstrate resilient profitability. However, the 12% interest expense weighs on earnings, signaling financial cost challenges amid declining margins and EPS.
T. Rowe Price Group, Inc. Analysis
T. Rowe Price’s revenue grew modestly 3% to $7.3B, with net income narrowly down 1% to $2.1B. The firm sustains superior margin health, boasting a 62.7% gross margin and a robust 28.5% net margin. Zero interest expense and steady EPS growth of 1% reflect operational efficiency and stable earnings momentum.
Margin Strength vs. Revenue Scale
KKR commands a larger revenue base but faces shrinking margins and rising interest costs, undermining net income growth. T. Rowe Price, while smaller, maintains higher profitability ratios and steadier earnings. For investors prioritizing margin quality and consistent earnings, T. Rowe Price presents a more attractive profile over KKR’s scale-driven but margin-compressed model.
Financial Ratios Comparison
These vital ratios act as a diagnostic tool to expose the underlying fiscal health, valuation premiums, and capital efficiency of the companies compared:
| Ratios | KKR & Co. Inc. (KKR) | T. Rowe Price Group, Inc. (TROW) |
|---|---|---|
| ROE | 13.0% | 19.2% |
| ROIC | 0.25% | 22.2% |
| P/E | 42.6 | 11.0 |
| P/B | 5.55 | 2.11 |
| Current Ratio | 4.12 | 0 (not reported) |
| Quick Ratio | 4.12 | 0 (not reported) |
| D/E | 2.15 | 0 (no debt) |
| Debt-to-Assets | 14.1% | 0 (no debt) |
| Interest Coverage | 0.28 | 0 (no debt) |
| Asset Turnover | 0.06 | 0.51 |
| Fixed Asset Turnover | 12.2 | 5.96 |
| Payout Ratio | 19.9% | 54.5% |
| Dividend Yield | 0.47% | 4.96% |
| Fiscal Year | 2024 | 2025 |
Efficiency & Valuation Duel: The Vital Signs
Financial ratios act as a company’s DNA, exposing hidden risks and operational strengths that shape investment decisions.
KKR & Co. Inc.
KKR posts a moderate ROE of 13% with a solid net margin of 14.2%. However, its P/E of 42.65 signals an expensive valuation. The company shows a weak ROIC of 0.25%, raising efficiency concerns. Dividend yield is low at 0.47%, suggesting limited shareholder returns and possible reinvestment in other areas.
T. Rowe Price Group, Inc.
T. Rowe Price outperforms with a 19.2% ROE and a robust net margin of 28.5%. Its P/E ratio of 10.98 indicates a reasonably valued stock. The firm boasts a strong ROIC of 22.2%, highlighting operational efficiency. A 4.96% dividend yield reflects a shareholder-friendly capital allocation policy.
Premium Valuation vs. Operational Safety
T. Rowe Price presents a better balance of profitability and valuation, with strong returns and shareholder rewards. KKR’s expensive valuation and weak efficiency metrics pose risks. Investors seeking operational safety and income may favor T. Rowe Price’s profile over KKR’s stretched metrics.
Which one offers the Superior Shareholder Reward?
I see KKR offers a modest 0.47% dividend yield with a low payout ratio near 20%, signaling ample free cash flow for reinvestment and buybacks. Its buyback activity is less intense but sustainable, given a strong current ratio of 4.1. T. Rowe Price yields nearly 4.5%, paying out over 54% of earnings as dividends, supported by robust free cash flow and consistent buybacks. Historically, TROW’s higher dividend and buyback combination delivers a superior total return profile within asset management, aligning well with long-term shareholder value. I conclude T. Rowe Price offers the more attractive shareholder reward in 2026.
Comparative Score Analysis: The Strategic Profile
The radar chart reveals the fundamental DNA and trade-offs of KKR & Co. Inc. and T. Rowe Price Group, Inc.:
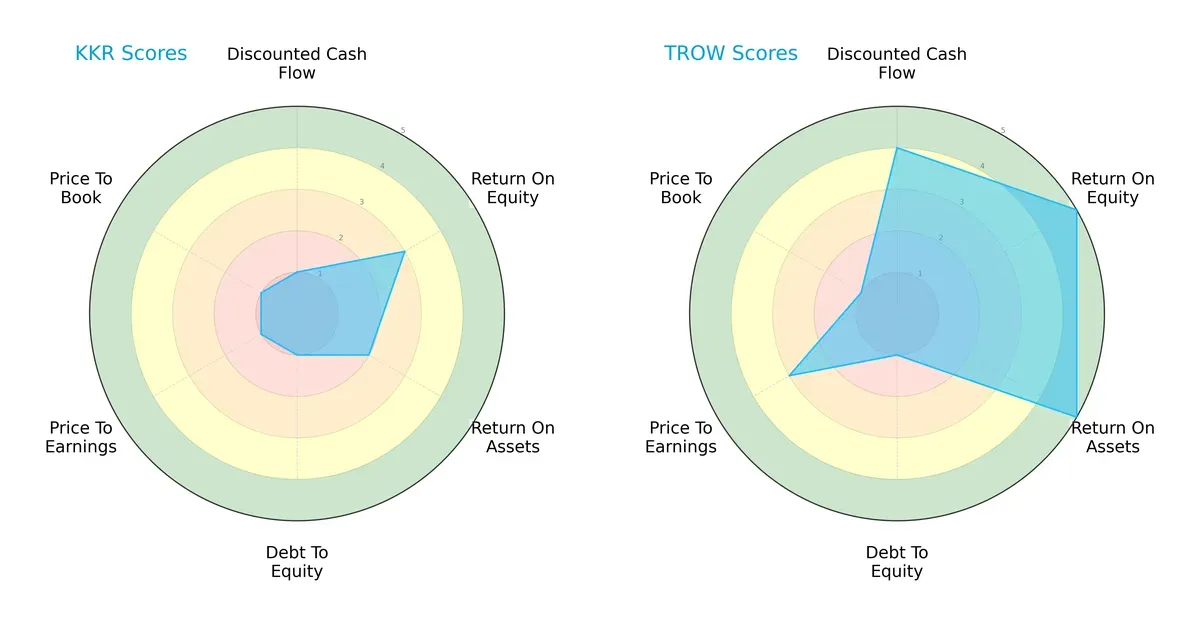
T. Rowe Price dominates in DCF, ROE, and ROA, showing operational efficiency and strong cash flow. Both firms have equally weak debt-to-equity scores, indicating leverage concerns. KKR’s valuation metrics lag significantly, reflecting possible market skepticism. Overall, T. Rowe Price presents a more balanced financial profile, while KKR relies heavily on a moderate ROE edge.
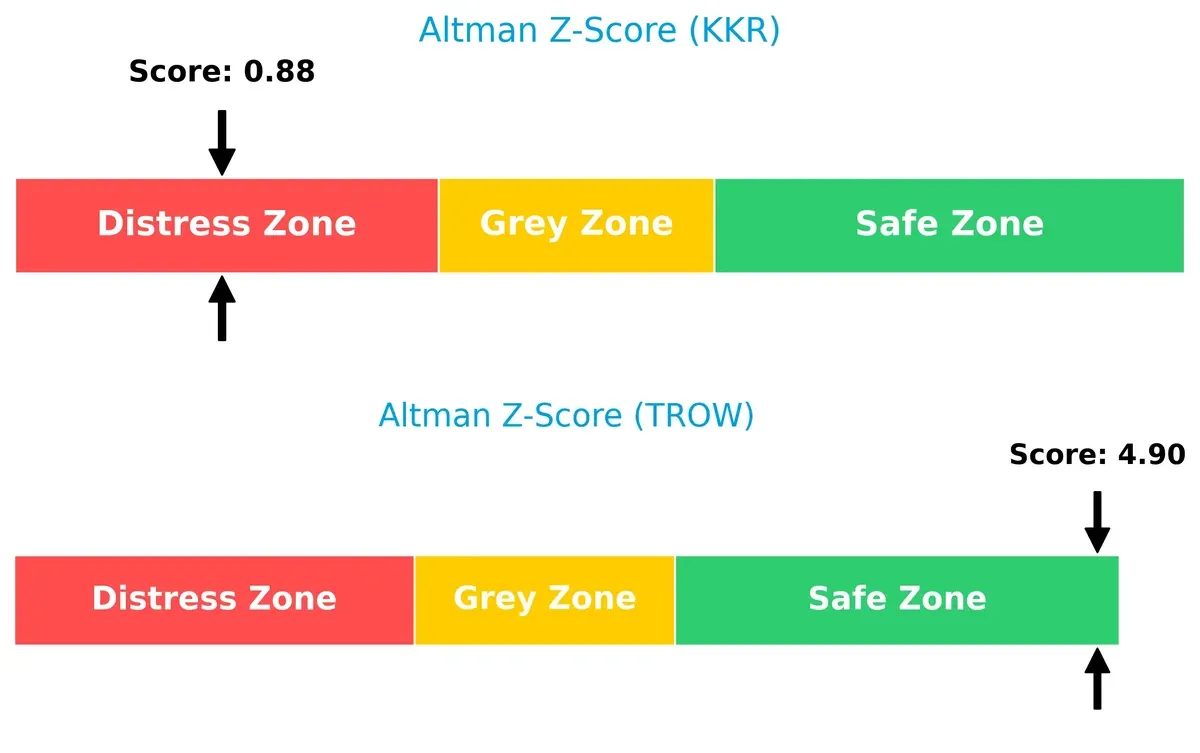
Bankruptcy Risk: Solvency Showdown
The Altman Z-Score starkly contrasts financial stability: KKR sits deep in the distress zone at 0.88, while T. Rowe Price safely exceeds 4.8, signaling robust solvency and survival prospects in this cycle:
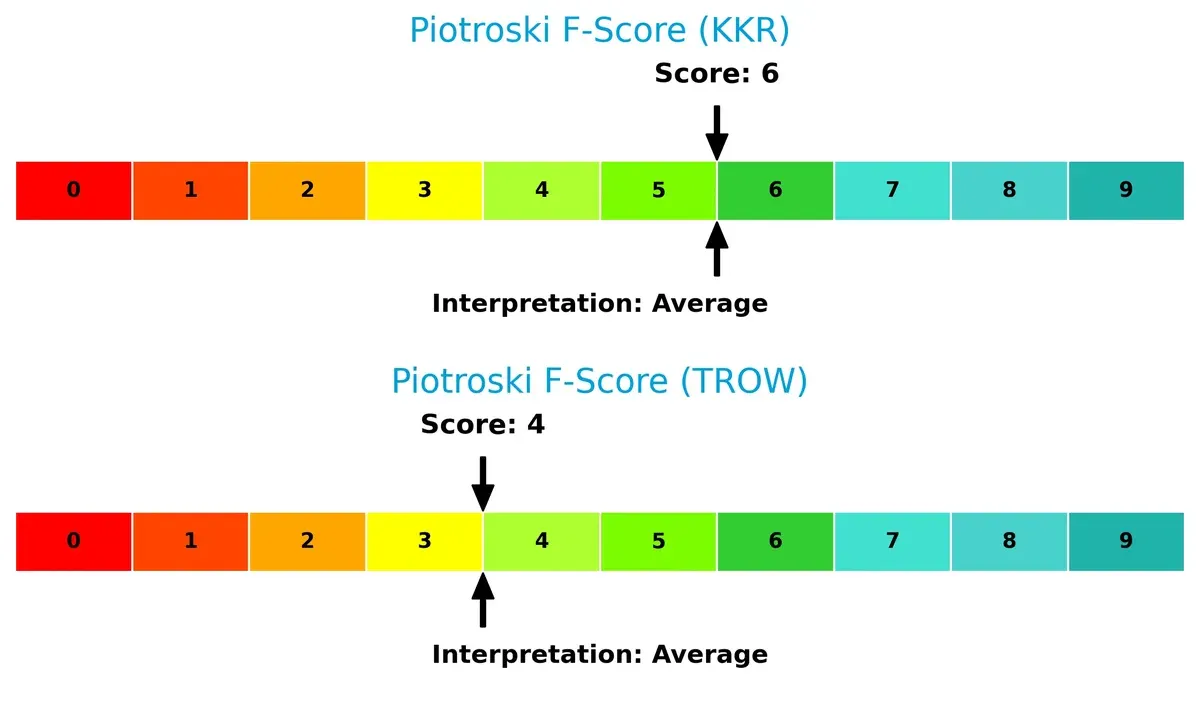
Financial Health: Quality of Operations
Both firms score moderately on Piotroski’s scale, with KKR at 6 and T. Rowe Price at 4. Neither indicates red flags, but KKR’s slightly higher score suggests marginally better internal financial health:
How are the two companies positioned?
This section dissects the operational DNA of KKR and TROW by comparing their revenue distribution and internal dynamics, including strengths and weaknesses. The goal is to confront their economic moats to reveal which model offers the most resilient and sustainable competitive advantage in today’s market.
Revenue Segmentation: The Strategic Mix
This visual comparison dissects how KKR & Co. Inc. and T. Rowe Price Group, Inc. diversify their income streams and where their primary sector bets lie:
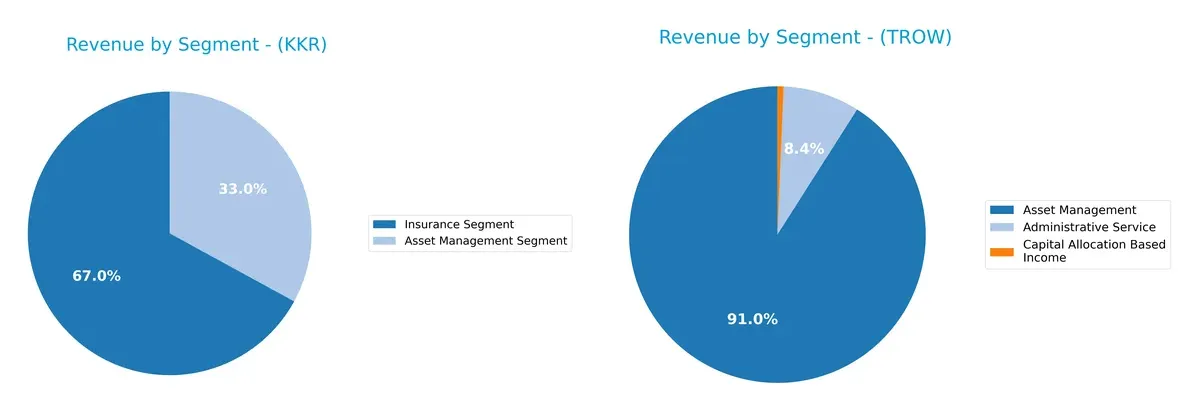
KKR leans heavily on its Insurance Segment, generating $14.7B in 2024, dwarfing its Asset Management at $7.2B. T. Rowe Price pivots around Asset Management with $6.4B, complemented by $588M from Administrative Services. KKR’s reliance on insurance shows ecosystem lock-in risk but captures infrastructure dominance. T. Rowe Price’s more balanced spread reduces concentration risk, favoring steady asset management fees over insurance volatility.
Strengths and Weaknesses Comparison
This table compares the Strengths and Weaknesses of KKR & Co. Inc. and T. Rowe Price Group, Inc.:
KKR Strengths
- Diversified revenue from Asset Management and Insurance segments
- Favorable net margin of 14.22%
- Strong quick ratio at 4.12
- Low debt to assets at 14.11%
- High fixed asset turnover of 12.23
TROW Strengths
- High profitability with net margin 28.53% and ROE 19.22%
- Strong ROIC at 22.19% well above WACC
- Favorable PE of 10.98
- Zero debt with favorable debt ratios
- High dividend yield at 4.96%
- Favorable interest coverage ratio
KKR Weaknesses
- Unfavorable ROIC at 0.25% indicating poor capital efficiency
- High debt to equity at 2.15
- Unfavorable PE and PB ratios indicating possible overvaluation
- Unfavorable asset turnover at 0.06
- Low dividend yield at 0.47%
TROW Weaknesses
- Unavailable current and quick ratios indicate liquidity concerns
- WACC higher than ROIC suggesting cost of capital pressure
- Neutral asset turnover at 0.51
- PB ratio only neutral
KKR’s strength lies in diversification and liquidity, but its capital efficiency and valuation metrics raise concerns. TROW excels in profitability and capital allocation but shows potential liquidity and cost of capital risks. Each company’s profile suggests distinct strategic priorities in managing growth and financial stability.
The Moat Duel: Analyzing Competitive Defensibility
A structural moat is the only reliable shield guarding long-term profits against relentless competition erosion:
KKR & Co. Inc.: Diversified Asset Control Moat
KKR’s moat stems from its diversified investment expertise and control over private equity assets. This yields strong margin stability despite revenue volatility. In 2026, expanding into impact investing could deepen its competitive edge.
T. Rowe Price Group, Inc.: Portfolio Management Reputation Moat
T. Rowe Price relies on brand trust and disciplined fund management, contrasting KKR’s asset control. Its high gross margin and value creation confirm a defensible position. Growth in ESG funds offers expansion potential in 2026.
Diversified Control vs. Brand Trust: The Moat Face-Off
KKR’s broad asset base offers a wider moat through diversified investments. However, T. Rowe Price’s higher ROIC over WACC signals a deeper moat in value creation. T. Rowe Price is better positioned to defend market share amid tightening margins.
Which stock offers better returns?
The past year shows divergent price dynamics for KKR & Co. Inc. and T. Rowe Price Group, Inc., with KKR exhibiting a moderate bullish trend, while T. Rowe Price faces a pronounced bearish slide.
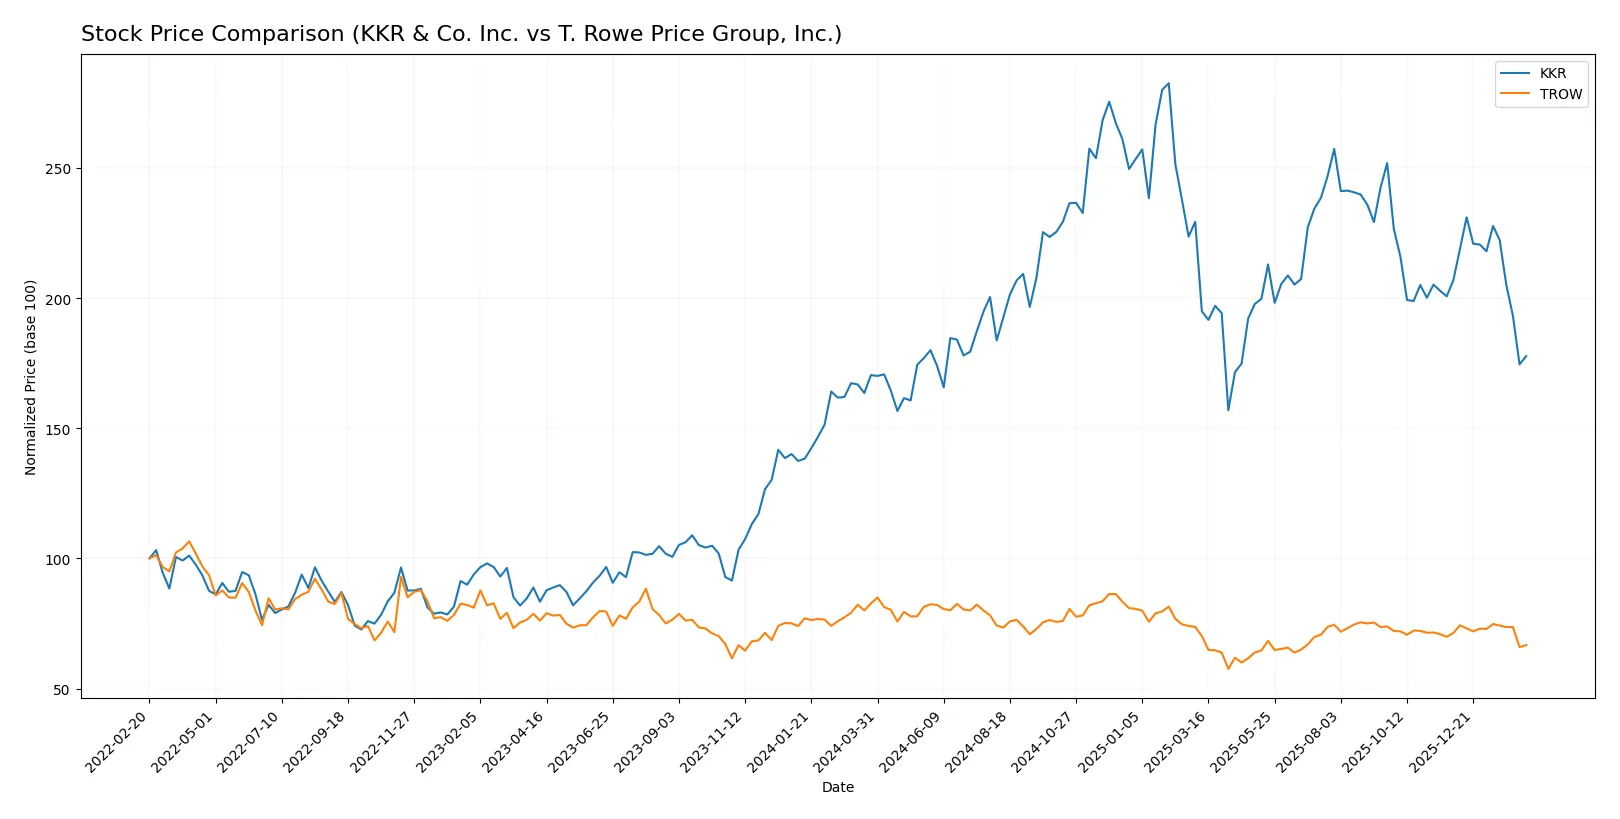
Trend Comparison
KKR’s stock rose 4.28% over the past 12 months, marking a bullish trend despite decelerating gains. The price fluctuated between 92.62 and 167.07, with volatility high at 18.11%.
T. Rowe Price’s stock declined 19.35% in the same period, confirming a bearish trend with decelerating losses. Price ranged from 82.6 to 123.84, showing lower volatility at 8.89%.
KKR outperformed T. Rowe Price by a wide margin over the past year, delivering positive returns versus a significant decline for its peer.
Target Prices
Analysts project solid upside potential for both KKR & Co. Inc. and T. Rowe Price Group, Inc.
| Company | Target Low | Target High | Consensus |
|---|---|---|---|
| KKR & Co. Inc. | 125 | 187 | 156 |
| T. Rowe Price Group | 94 | 123 | 108.25 |
KKR’s consensus target at $156 suggests a 49% premium to its current $104.67 price. T. Rowe’s $108.25 target implies a 13% gain from $95.64. Analysts expect KKR to outperform T. Rowe Price over the medium term.

Don’t Let Luck Decide Your Entry Point
Optimize your entry points with our advanced ProRealTime indicators. You’ll get efficient buy signals with precise price targets for maximum performance. Start outperforming now!
How do institutions grade them?
The following tables summarize recent grades from established grading companies for both firms:
KKR & Co. Inc. Grades
This table shows recent institutional grades and actions for KKR & Co. Inc.:
| Grading Company | Action | New Grade | Date |
|---|---|---|---|
| Oppenheimer | maintain | Outperform | 2026-02-06 |
| Barclays | maintain | Overweight | 2026-02-06 |
| TD Cowen | downgrade | Hold | 2026-01-14 |
| UBS | maintain | Buy | 2026-01-13 |
| Barclays | maintain | Overweight | 2026-01-09 |
| Barclays | maintain | Overweight | 2025-12-12 |
| Barclays | maintain | Overweight | 2025-11-11 |
| TD Cowen | maintain | Buy | 2025-11-10 |
| Oppenheimer | maintain | Outperform | 2025-11-10 |
| Morgan Stanley | maintain | Overweight | 2025-10-21 |
T. Rowe Price Group, Inc. Grades
This table shows recent institutional grades and actions for T. Rowe Price Group, Inc.:
| Grading Company | Action | New Grade | Date |
|---|---|---|---|
| JP Morgan | maintain | Underweight | 2026-02-05 |
| TD Cowen | maintain | Hold | 2026-02-05 |
| Evercore ISI Group | maintain | In Line | 2026-02-05 |
| Keefe, Bruyette & Woods | maintain | Market Perform | 2026-02-05 |
| Morgan Stanley | maintain | Equal Weight | 2026-02-03 |
| JP Morgan | maintain | Underweight | 2026-01-20 |
| Barclays | maintain | Underweight | 2026-01-15 |
| TD Cowen | maintain | Hold | 2026-01-14 |
| Morgan Stanley | maintain | Equal Weight | 2025-12-17 |
| Keefe, Bruyette & Woods | maintain | Market Perform | 2025-12-17 |
Which company has the best grades?
KKR & Co. Inc. consistently receives higher grades such as Outperform and Overweight, while T. Rowe Price Group carries predominantly Hold or Underweight ratings. This contrast may influence investor confidence and portfolio positioning.
Risks specific to each company
The following categories identify critical pressure points and systemic threats facing KKR & Co. Inc. and T. Rowe Price Group, Inc. in the 2026 market environment:
1. Market & Competition
KKR & Co. Inc.
- Faces intense competition in private equity and asset management with a broad industry focus.
T. Rowe Price Group, Inc.
- Competes in public equity and fixed income asset management with a strong global presence.
2. Capital Structure & Debt
KKR & Co. Inc.
- High debt-to-equity ratio of 2.15 signals elevated financial leverage risk.
T. Rowe Price Group, Inc.
- Virtually no debt, indicating a conservative capital structure and lower financial risk.
3. Stock Volatility
KKR & Co. Inc.
- Beta near 1.99 indicates high stock price volatility relative to the market.
T. Rowe Price Group, Inc.
- Beta of 1.54 shows moderate volatility, less risky than KKR.
4. Regulatory & Legal
KKR & Co. Inc.
- Exposure to complex regulations across diverse global investments raises compliance risk.
T. Rowe Price Group, Inc.
- Operates under stringent global financial regulations but with fewer regulatory complexities.
5. Supply Chain & Operations
KKR & Co. Inc.
- Operations depend on successful portfolio management in volatile sectors and regions.
T. Rowe Price Group, Inc.
- Relies on stable operational execution in asset management with a diversified client base.
6. ESG & Climate Transition
KKR & Co. Inc.
- Actively invests in impact and renewable energy sectors; ESG risks include transition costs.
T. Rowe Price Group, Inc.
- Focuses on socially responsible investing but faces pressure to align with evolving ESG standards.
7. Geopolitical Exposure
KKR & Co. Inc.
- Significant exposure to emerging markets and global regions with geopolitical instability.
T. Rowe Price Group, Inc.
- Global footprint with exposure to developed markets, reducing geopolitical risk comparatively.
Which company shows a better risk-adjusted profile?
KKR’s greatest risk lies in its high leverage and volatile market exposure, while T. Rowe Price faces regulatory and ESG adaptation challenges. T. Rowe Price’s stronger financials and lower debt deliver a superior risk-adjusted profile. Its Altman Z-score in the safe zone versus KKR’s distress zone confirms this.
Final Verdict: Which stock to choose?
KKR & Co. Inc. stands out as a cash machine with robust liquidity and a strong current ratio, signaling excellent short-term resilience. However, its declining ROIC and elevated leverage present a point of vigilance. It fits an aggressive growth portfolio willing to tolerate volatility for potential outsized gains.
T. Rowe Price Group, Inc. boasts a strategic moat with superior capital allocation and consistent value creation, reflected in solid ROIC above WACC. Its safer balance sheet and higher dividend yield offer better downside protection compared to KKR. This makes it suitable for a GARP (Growth at a Reasonable Price) portfolio seeking stability and income.
If you prioritize aggressive expansion and can tolerate financial leverage, KKR is the compelling choice due to its liquidity strength and growth orientation. However, if you seek durable competitive advantage and superior capital efficiency with better stability, T. Rowe Price outshines as the more prudent analytical scenario.
Disclaimer: Investment carries a risk of loss of initial capital. The past performance is not a reliable indicator of future results. Be sure to understand risks before making an investment decision.
Go Further
I encourage you to read the complete analyses of KKR & Co. Inc. and T. Rowe Price Group, Inc. to enhance your investment decisions: