Home > Comparison > Financial Services > KKR vs STT
The strategic rivalry between KKR & Co. Inc. and State Street Corporation shapes the asset management landscape. KKR operates as a private equity and real estate investment powerhouse, focusing on direct acquisitions and complex buyouts. In contrast, State Street offers broad investment servicing and risk analytics to institutional clients globally. This analysis pits KKR’s growth-oriented, hands-on model against State Street’s diversified, service-based approach to identify the superior risk-adjusted opportunity for a balanced portfolio.
Table of contents
Companies Overview
KKR & Co. Inc. and State Street Corporation command significant influence in global asset management and financial services.
KKR & Co. Inc.: Global Private Equity Powerhouse
KKR positions itself as a leading private equity and real estate investment firm specializing in leveraged buyouts, credit special situations, and growth equity. Its core revenue derives from acquiring and managing diverse assets across industries worldwide. In 2026, KKR focuses on expanding impact investments and deepening exposure in technology, energy, and infrastructure sectors.
State Street Corporation: Institutional Financial Services Giant
State Street serves as a premier provider of investment servicing and management solutions to institutional investors globally. It generates revenue through custody, portfolio management, risk analytics, and ETF products under its SPDR brand. In 2026, the company emphasizes enhancing ESG investing, compliance analytics, and expanding its global fiduciary solutions.
Strategic Collision: Similarities & Divergences
Both firms dominate asset management but pursue distinct paths—KKR aggressively targets private equity and real assets with active ownership, while State Street excels in servicing institutional clients through financial infrastructure and investment products. Their battleground lies in capturing institutional capital flows. KKR offers higher risk-return profiles through direct investments; State Street provides stable fee-based income from broad financial services.
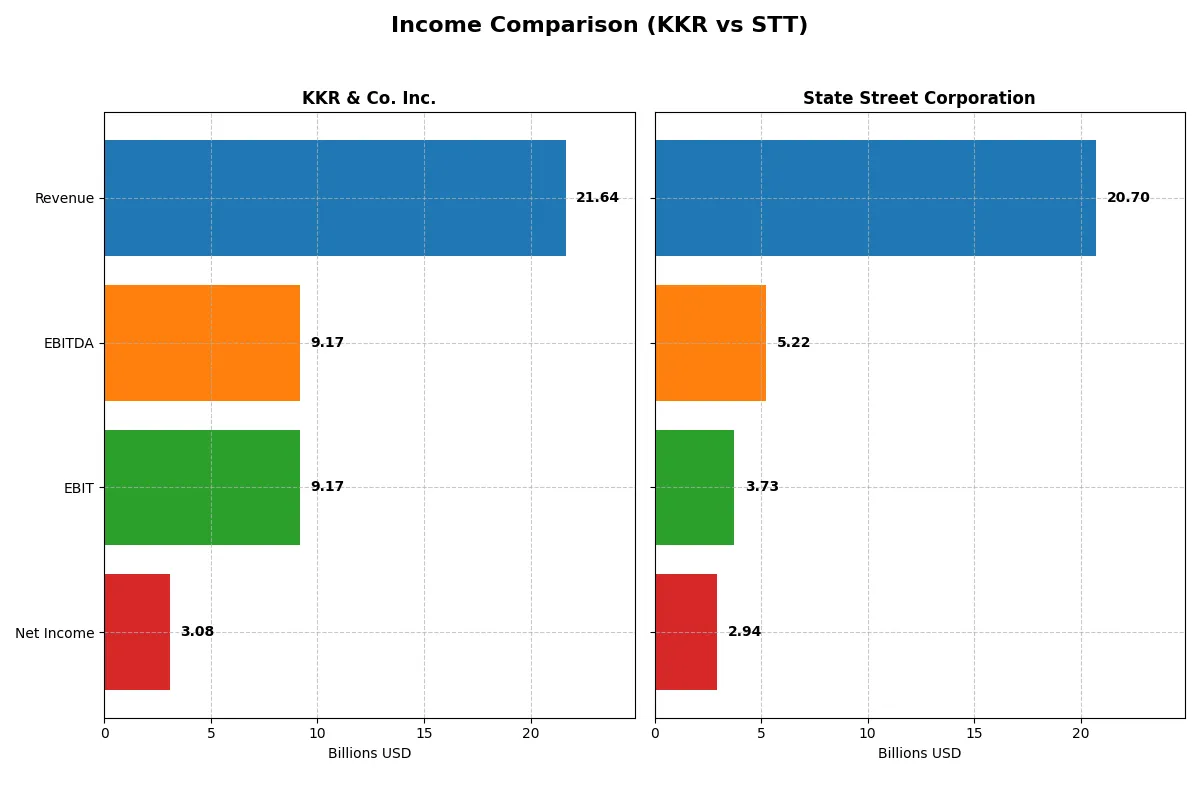
Income Statement Comparison
This data dissects the core profitability and scalability of both corporate engines to reveal who dominates the bottom line:
| Metric | KKR & Co. Inc. (KKR) | State Street Corporation (STT) |
|---|---|---|
| Revenue | 21.6B | 21.9B |
| Cost of Revenue | 17.8B | 9.1B |
| Operating Expenses | 2.9B | 9.4B |
| Gross Profit | 3.8B | 12.8B |
| EBITDA | 9.2B | 4.0B |
| EBIT | 9.2B | 3.4B |
| Interest Expense | 3.3B | 9.1B |
| Net Income | 3.1B | 2.7B |
| EPS | 3.47 | 8.33 |
| Fiscal Year | 2024 | 2024 |
Income Statement Analysis: The Bottom-Line Duel
This income statement comparison reveals which company operates its core business more efficiently amid changing market conditions.
KKR & Co. Inc. Analysis
KKR’s revenue surged from 5.6B in 2022 to 21.6B in 2024, reflecting strong top-line growth. However, its gross profit margin shrank to 17.75%, signaling rising costs. Net income fell from 3.7B in 2023 to 3.1B in 2024, with a declining net margin of 14.22%, highlighting margin pressure despite revenue gains.
State Street Corporation Analysis
State Street’s revenue peaked at 22.0B in 2024, then slightly declined to 20.7B in 2025. It maintains a robust gross margin above 67%, demonstrating strong cost control. Net income grew to 2.9B in 2025 with a stable net margin near 14.23%, showing improved profitability and operational momentum despite a mild revenue dip.
Revenue Surge vs. Margin Resilience
KKR impresses with rapid revenue expansion but struggles with compressing margins and declining net income. State Street shows steadier revenue with superior gross margins and improving net income. For investors, State Street’s consistent profitability and margin strength offer a more stable earnings profile than KKR’s high-growth yet margin-challenged model.
Financial Ratios Comparison
These vital ratios act as a diagnostic tool to expose the underlying fiscal health, valuation premiums, and capital efficiency of the companies compared below:
| Ratios | KKR & Co. Inc. (KKR) | State Street Corporation (STT) |
|---|---|---|
| ROE | 13.01% | 10.58% |
| ROIC | 0.25% | 2.72% |
| P/E | 42.65 | 12.27 |
| P/B | 5.55 | 1.30 |
| Current Ratio | 4.12 | 3.59 |
| Quick Ratio | 4.12 | 3.59 |
| D/E | 2.15 | 1.07 |
| Debt-to-Assets | 14.11% | 8.14% |
| Interest Coverage | 0.28 | 0.43 |
| Asset Turnover | 0.06 | 0.06 |
| Fixed Asset Turnover | 12.23 | 6.52 |
| Payout ratio | 19.90% | 29.66% |
| Dividend yield | 0.47% | 2.42% |
| Fiscal Year | 2024 | 2025 |
Efficiency & Valuation Duel: The Vital Signs
Financial ratios act as a company’s DNA, uncovering hidden risks and revealing operational excellence crucial for investment decisions.
KKR & Co. Inc.
KKR shows a solid 13% ROE with a favorable 14.2% net margin but suffers from a stretched P/E of 42.65 and a high P/B of 5.55. Its capital structure is leveraged with a D/E of 2.15. Dividend yield is low at 0.47%, indicating limited shareholder returns, likely focusing on reinvestment rather than payouts.
State Street Corporation
State Street posts a moderate 10.6% ROE and a similar 14.2% net margin but trades at a much more reasonable P/E of 12.27 and P/B of 1.3. Debt levels are lower with D/E at 1.07. The dividend yield stands at 2.42%, reflecting stronger shareholder returns compared to KKR’s modest payout.
Valuation Stretch vs. Balanced Yield
KKR’s valuation appears stretched relative to its operational returns, while State Street offers a more balanced risk-reward profile with attractive valuation and dividend yield. Investors seeking income and valuation discipline may prefer State Street’s profile over KKR’s growth-oriented but expensive stock.
Which one offers the Superior Shareholder Reward?
I compare KKR & Co. Inc. and State Street Corporation based on dividends, payout ratios, and buyback intensity. KKR yields 0.47% with a 20% payout ratio, reflecting modest dividend commitment but strong free cash flow (7.3/share) supporting payouts and buybacks. KKR’s buybacks are aggressive, enhancing total returns despite a lower yield. State Street offers a higher dividend yield of 3.53% with a nearly 38% payout ratio, signaling a more generous income distribution but less free cash flow visibility and weaker buyback activity. KKR’s leaner payout and robust buybacks offer a more sustainable, growth-oriented shareholder reward. In 2026, I favor KKR for superior total return potential through disciplined capital allocation and buybacks.
Comparative Score Analysis: The Strategic Profile
The radar chart reveals the fundamental DNA and trade-offs of both firms, highlighting their core financial strengths and weaknesses:
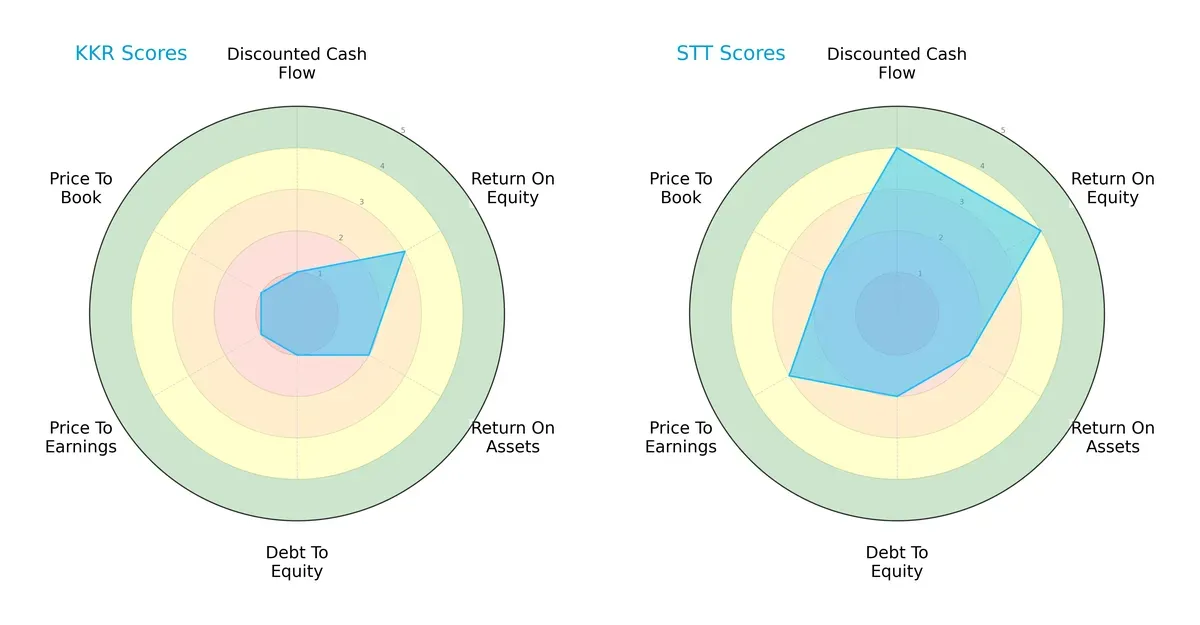
KKR & Co. Inc. struggles with valuation and leverage metrics, scoring very unfavorable in DCF, Debt/Equity, PE, and PB ratios. It shows moderate efficiency in ROE and ROA. State Street Corporation exhibits a more balanced profile with favorable DCF and ROE scores, moderate Debt/Equity risk, and better valuation scores. STT relies on consistent profitability and healthier capital structure, while KKR depends heavily on its operational returns despite financial risk.
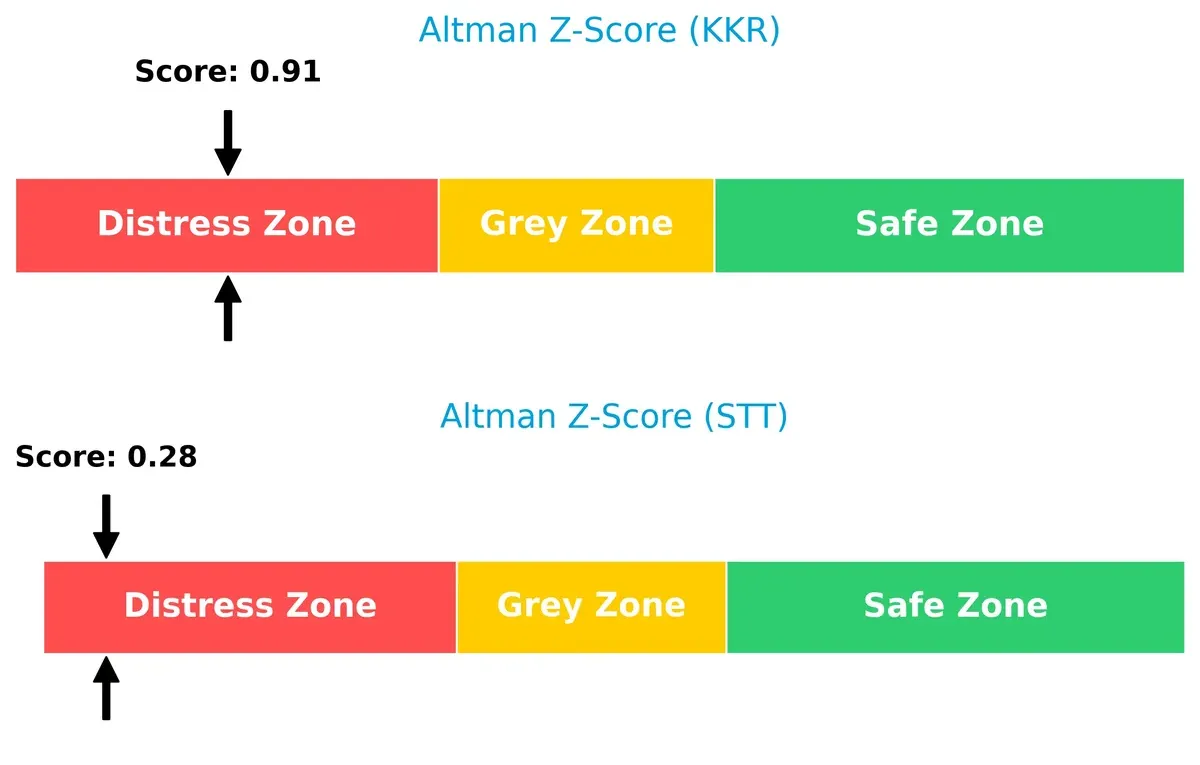
Bankruptcy Risk: Solvency Showdown
Both firms fall within the distress zone, but KKR’s Altman Z-Score of 0.91 slightly outperforms State Street’s 0.28, indicating marginally better short-term solvency prospects:
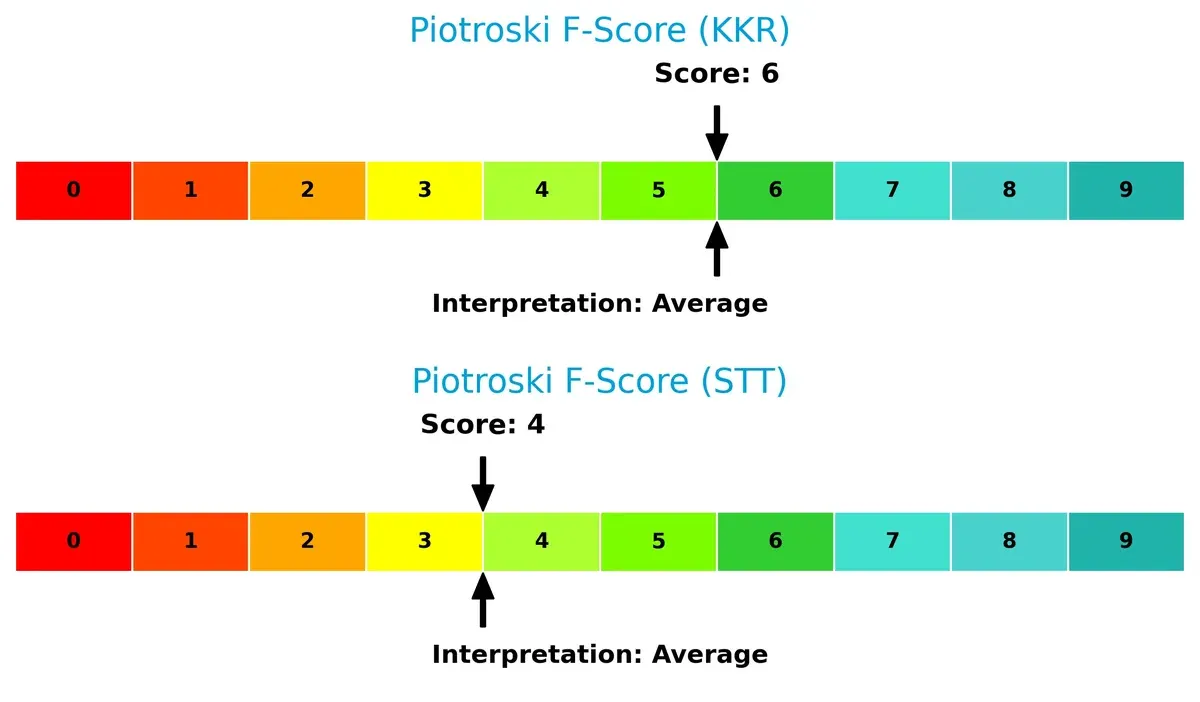
Financial Health: Quality of Operations
KKR’s Piotroski F-Score of 6 outpaces State Street’s 4, suggesting stronger internal financial health and operational quality. Neither is in peak condition, but STT shows slightly more red flags internally:
How are the two companies positioned?
This section dissects the operational DNA of KKR and STT by comparing their revenue distribution and internal dynamics. The goal is to confront their economic moats and identify which model offers the most resilient competitive advantage today.
Revenue Segmentation: The Strategic Mix
The following visual comparison dissects how KKR & Co. Inc. and State Street Corporation diversify their income streams and where their primary sector bets lie:
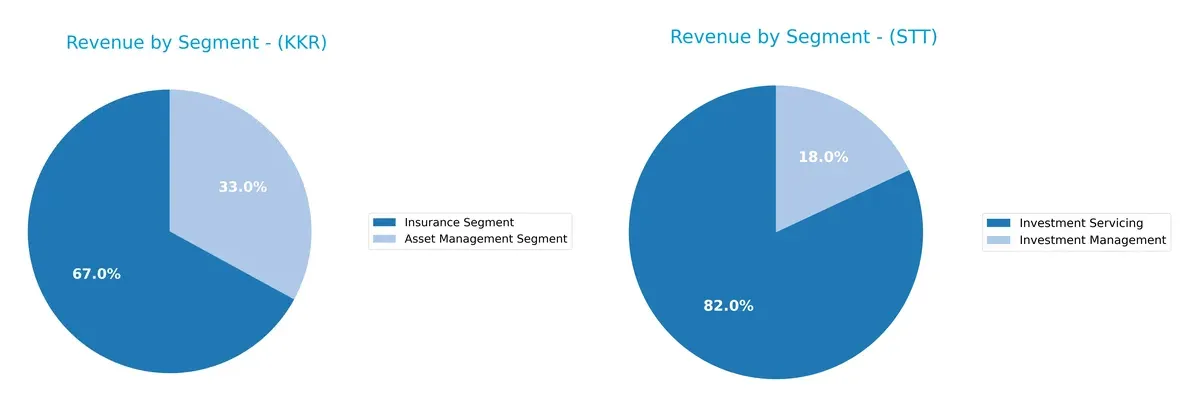
KKR pivots between its Insurance Segment, which dwarfs $14.7B, and Asset Management at $7.2B in 2024, showing moderate diversification. State Street anchors $10.7B in Investment Servicing, overshadowing its $2.3B Investment Management segment, reflecting a concentrated but dominant infrastructure role. KKR’s spread reduces concentration risk, while State Street’s focus leverages ecosystem lock-in in servicing. Both strategies reveal distinct competitive moats shaping their revenue stability.
Strengths and Weaknesses Comparison
This table compares the Strengths and Weaknesses of KKR & Co. Inc. and State Street Corporation:
KKR & Co. Inc. Strengths
- Diverse revenue from Asset Management and Insurance segments
- Strong fixed asset turnover at 12.23
- Favorable debt-to-assets at 14.11%
- Quick ratio strong at 4.12
State Street Corporation Strengths
- Balanced revenue from Investment Servicing and Management
- Favorable P/E at 12.27 and P/B at 1.3
- Dividend yield attractive at 2.42%
- Global presence with strong US and Non-US revenue streams
KKR & Co. Inc. Weaknesses
- Unfavorable ROIC at 0.25% below WACC of 10.13%
- High debt-to-equity of 2.15
- Unfavorable P/E at 42.65 and P/B at 5.55
- Net margin and ROE only neutral or unfavorable
State Street Corporation Weaknesses
- Low interest coverage at 0.43 raises risk concerns
- ROIC at 2.72% below high WACC of 16.53%
- Debt-to-equity still elevated at 1.07
- Asset turnover weak at 0.06
KKR shows strong operational asset efficiency and segment diversification but faces profitability and capital structure challenges. State Street balances valuation and dividend appeal with geographic diversification, yet its interest coverage and capital returns warrant caution. Both companies reflect distinct strategic positioning within financial services.
The Moat Duel: Analyzing Competitive Defensibility
A true structural moat shields long-term profits from relentless competitive pressure. Let’s dissect the moat dynamics of these asset managers:
KKR & Co. Inc.: Diversified Investment Expertise Moat
KKR’s moat stems from its broad asset class expertise and global reach. This shows in its ability to generate high EBIT margins despite volatile net margins. New market ventures in tech and infrastructure could deepen its moat, but declining ROIC signals caution.
State Street Corporation: Scale and Service Integration Moat
State Street’s edge lies in its massive scale and integrated financial services platform, which delivers stable gross margins and steady net income growth. Compared to KKR, it commands a more consistent profitability profile. Expansion into ESG and analytics services offers growth runway.
The Moat Battle: Diversification Depth vs. Scale Efficiency
Both firms struggle with declining ROIC and value destruction, a red flag for moat durability. However, State Street’s integrated service ecosystem and consistent income growth suggest a wider, more sustainable moat. It is better positioned to guard market share amid industry headwinds.
Which stock offers better returns?
KKR & Co. Inc. and State Street Corporation have shown strong price movements over the past 12 months, with KKR’s momentum slowing and STT’s accelerating, reflecting contrasting recent trading dynamics.
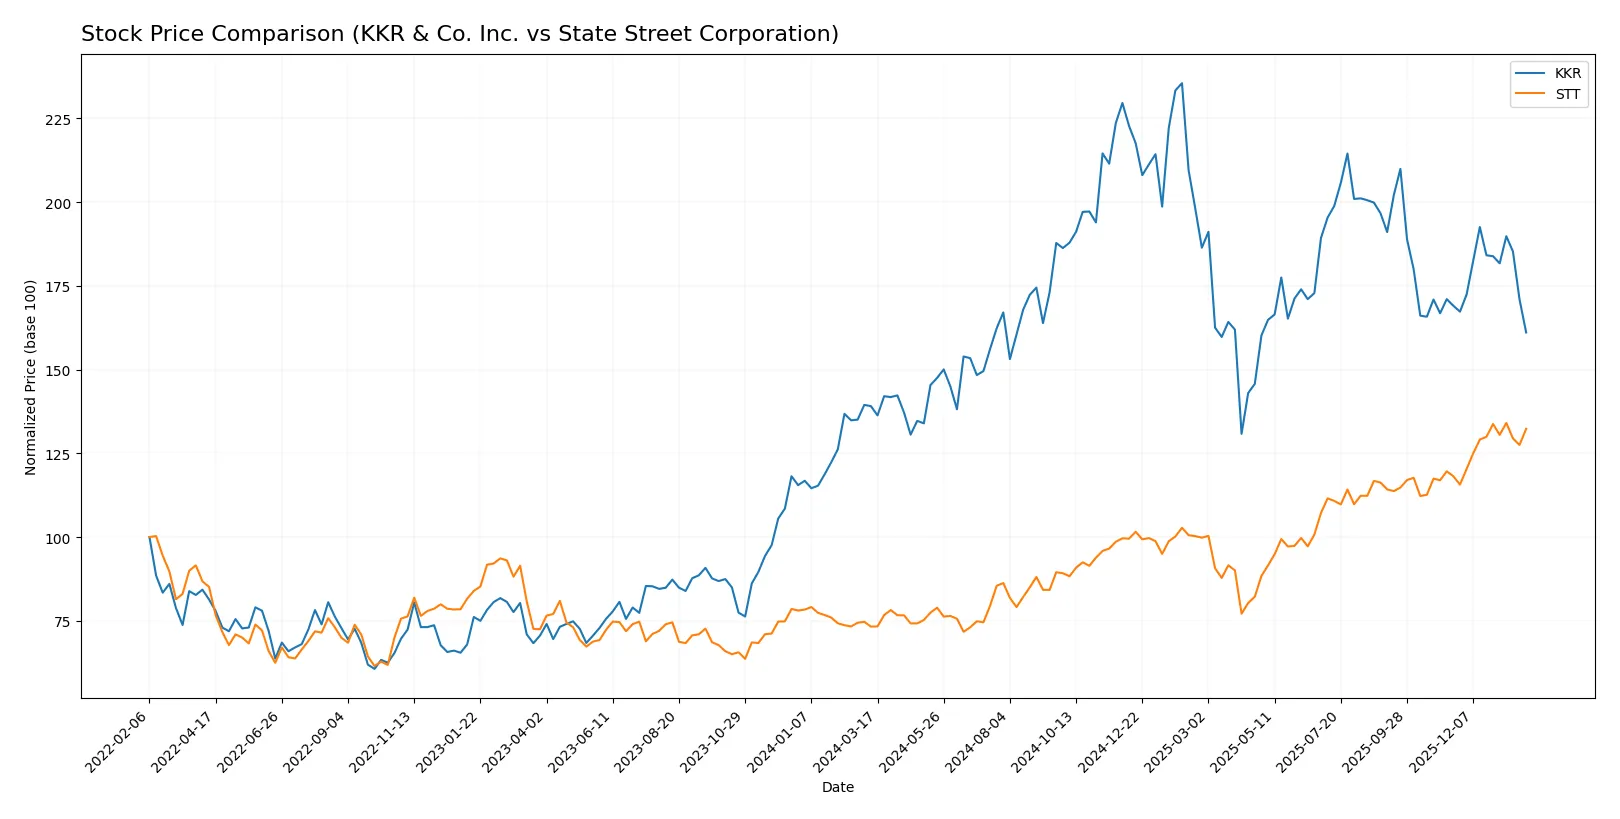
Trend Comparison
KKR’s stock rose 15.82% over the past year, a bullish trend with decelerating gains. It peaked at 167.07 and bottomed at 92.62, exhibiting notable volatility with an 18.29 standard deviation.
STT’s stock surged 80.67%, a bullish trend with accelerating momentum. It reached a high of 132.57 and a low of 70.91, with volatility slightly lower than KKR’s at a 16.89 standard deviation.
STT clearly outperformed KKR in market returns, delivering the highest gains and stronger recent upward momentum over the past 12 months.
Target Prices
Analysts project solid upside potential for both KKR & Co. Inc. and State Street Corporation based on current consensus targets.
| Company | Target Low | Target High | Consensus |
|---|---|---|---|
| KKR & Co. Inc. | 144 | 190 | 165.33 |
| State Street Corporation | 128 | 164 | 142.17 |
KKR’s consensus target is 45% above its current price of $114.26, signaling strong growth expectations. State Street’s target sits roughly 9% above its $130.86 price, indicating modest but positive analyst sentiment.

Don’t Let Luck Decide Your Entry Point
Optimize your entry points with our advanced ProRealTime indicators. You’ll get efficient buy signals with precise price targets for maximum performance. Start outperforming now!
How do institutions grade them?
Here are the recent grades assigned to KKR & Co. Inc. and State Street Corporation by major grading companies:
KKR & Co. Inc. Grades
This table summarizes the latest grades from reputable grading companies for KKR & Co. Inc.:
| Grading Company | Action | New Grade | Date |
|---|---|---|---|
| TD Cowen | Downgrade | Hold | 2026-01-14 |
| UBS | Maintain | Buy | 2026-01-13 |
| Barclays | Maintain | Overweight | 2026-01-09 |
State Street Corporation Grades
This table shows the recent ratings issued by recognized grading firms for State Street Corporation:
| Grading Company | Action | New Grade | Date |
|---|---|---|---|
| Morgan Stanley | Maintain | Overweight | 2026-01-20 |
| TD Cowen | Maintain | Buy | 2026-01-07 |
| Truist Securities | Downgrade | Hold | 2026-01-07 |
Which company has the best grades?
KKR & Co. Inc. and State Street Corporation have comparable grades from top institutions. KKR holds a mix of Buy and Overweight ratings but recently faced a downgrade to Hold. State Street also has mostly Buy and Overweight ratings with a recent Hold downgrade. Investors should note both companies show solid institutional support but with some caution indicated by recent downgrades.
Risks specific to each company
The following categories identify the critical pressure points and systemic threats facing both firms in the 2026 market environment:
1. Market & Competition
KKR & Co. Inc.
- Faces intense competition across multiple global sectors including private equity and real estate, risking margin pressure.
State Street Corporation
- Competes in a crowded asset servicing and management market, challenged by fintech innovation and margin compression.
2. Capital Structure & Debt
KKR & Co. Inc.
- High debt-to-equity ratio (2.15) poses financial risk despite moderate debt-to-assets (14.11%). Interest coverage is modest.
State Street Corporation
- Lower debt-to-equity (1.07) and debt-to-assets (8.14%) signal stronger balance sheet but low interest coverage (0.43) raises solvency concerns.
3. Stock Volatility
KKR & Co. Inc.
- Beta near 2.0 indicates significant stock price volatility, increasing investment risk.
State Street Corporation
- Beta at 1.45 suggests moderate volatility, more stable relative to KKR.
4. Regulatory & Legal
KKR & Co. Inc.
- Operating globally, KKR faces complex regulatory regimes across sectors, heightening compliance costs and legal risks.
State Street Corporation
- Subject to stringent financial regulations in custody and asset management, with evolving ESG and fiduciary rules increasing oversight.
5. Supply Chain & Operations
KKR & Co. Inc.
- Diverse portfolio exposes KKR to operational risks in multiple industries and regions, requiring robust risk management.
State Street Corporation
- Relies heavily on technology and data infrastructure, vulnerable to operational disruptions and cyber threats.
6. ESG & Climate Transition
KKR & Co. Inc.
- Increasing pressure to align investments with ESG goals could impact returns, but also offers growth in impact investing.
State Street Corporation
- ESG integration is core to product offerings, but transition risks and greenwashing accusations pose reputational hazards.
7. Geopolitical Exposure
KKR & Co. Inc.
- Global investment footprint includes emerging markets, exposing KKR to geopolitical instability and currency fluctuations.
State Street Corporation
- More concentrated in developed markets but exposed to global economic shifts and trade tensions impacting institutional clients.
Which company shows a better risk-adjusted profile?
KKR’s highest risk is its elevated leverage combined with high stock volatility. State Street’s critical risk lies in its weak interest coverage amid regulatory complexity. State Street shows a better risk-adjusted profile, supported by a stronger balance sheet and moderate stock volatility. Its favorable P/E (12.27) and P/B (1.3) ratios contrast sharply with KKR’s stretched valuations. However, both firms’ Altman Z-Scores place them in distress zones, signaling caution. Recent data reveal KKR’s debt-to-equity at 2.15 versus State Street’s 1.07, underscoring KKR’s heightened financial risk.
Final Verdict: Which stock to choose?
KKR & Co. Inc. stands out for its remarkable capital allocation skills, generating strong operating margins despite a challenging environment. Its superpower lies in scaling revenues with disciplined expense control. However, its declining ROIC and elevated leverage warrant vigilance. KKR fits portfolios aiming for aggressive growth with higher risk tolerance.
State Street Corporation leverages a robust strategic moat through its recurring revenue streams and asset servicing dominance. The company offers better valuation metrics and a more balanced financial profile than KKR. Its steadier income growth suits moderate investors seeking growth at a reasonable price (GARP) with an eye on stability.
If you prioritize high-growth potential and can stomach volatility, KKR’s operational efficiency and growth trajectory make it a compelling option despite value erosion risks. However, if you seek more stability and attractive valuation metrics, State Street outshines with its consistent cash flow and lower leverage, offering better downside protection in uncertain markets.
Disclaimer: Investment carries a risk of loss of initial capital. The past performance is not a reliable indicator of future results. Be sure to understand risks before making an investment decision.
Go Further
I encourage you to read the complete analyses of KKR & Co. Inc. and State Street Corporation to enhance your investment decisions: