Home > Comparison > Financial Services > KKR vs NTRS
The strategic rivalry between KKR & Co. Inc. and Northern Trust Corporation shapes the asset management landscape in 2026. KKR operates as a diversified private equity and real estate investment powerhouse, emphasizing control and growth equity. Northern Trust excels as a wealth management and asset servicing leader, focusing on institutional and high-net-worth clients. This analysis examines their contrasting models to identify which offers superior risk-adjusted returns for a well-diversified portfolio.
Table of contents
Companies Overview
KKR & Co. Inc. and Northern Trust Corporation stand as influential pillars in the asset management landscape.
KKR & Co. Inc.: Global Private Equity Powerhouse
KKR dominates as a private equity and real estate investment firm with a broad global footprint. Its core revenue stems from leveraged buyouts, credit special situations, and real estate investments across multiple industries and regions. In 2026, KKR strategically targets high-value buyouts and impact investments, emphasizing controlling stakes and board influence in portfolio companies.
Northern Trust Corporation: Comprehensive Wealth and Asset Manager
Northern Trust serves institutional and high-net-worth clients with an integrated platform of wealth management, asset servicing, and banking solutions. Its revenue engine revolves around custody, investment management, and trust services. The firm focuses on expanding its asset servicing capabilities and enhancing client relationships through tailored financial consulting and private banking.
Strategic Collision: Similarities & Divergences
KKR pursues aggressive, control-oriented investments with a global private equity approach, while Northern Trust emphasizes client-centric asset servicing and wealth management. Their competition primarily unfolds in institutional asset management and alternative investments. KKR’s high-risk, high-return profile contrasts with Northern Trust’s stable, fee-based recurring revenue, marking distinct investment paradigms in financial services.
Income Statement Comparison
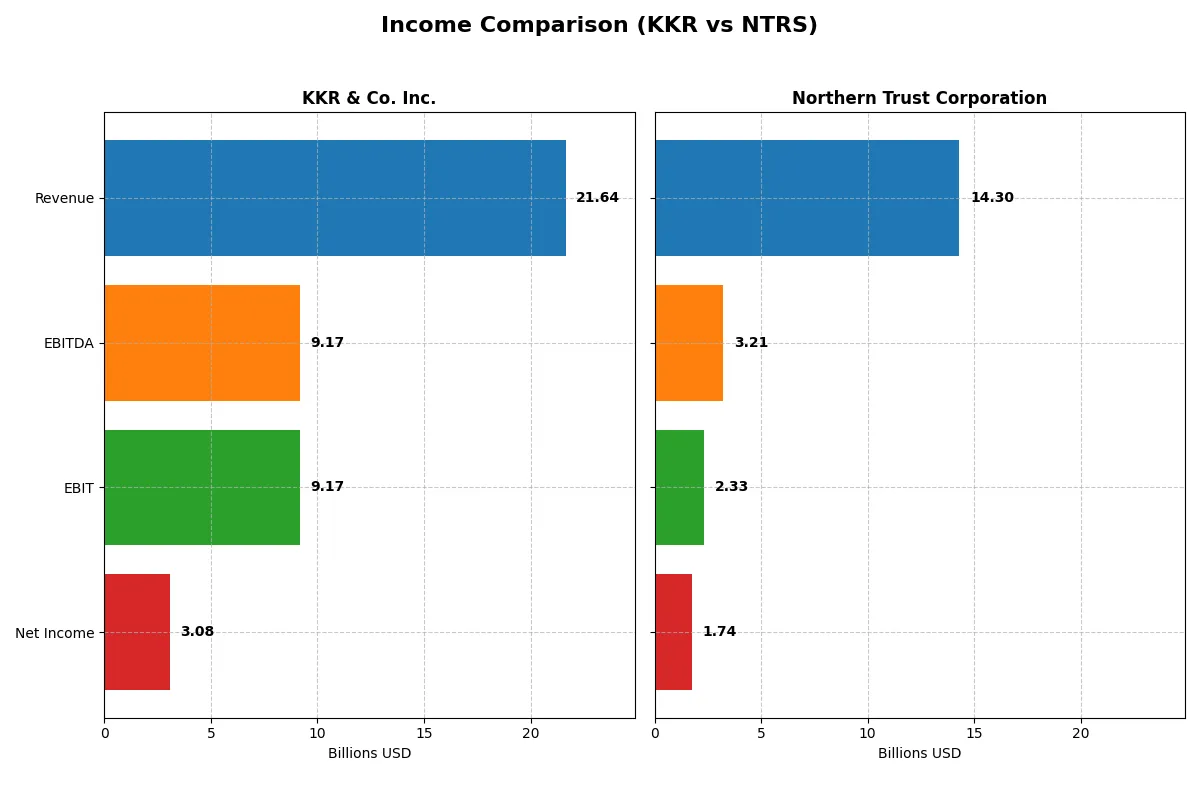
This data dissects the core profitability and scalability of both corporate engines to reveal who dominates the bottom line:
| Metric | KKR & Co. Inc. (KKR) | Northern Trust Corporation (NTRS) |
|---|---|---|
| Revenue | 21.6B | 15.9B |
| Cost of Revenue | 17.8B | 7.6B |
| Operating Expenses | 2.9B | 5.6B |
| Gross Profit | 3.8B | 8.3B |
| EBITDA | 9.2B | 3.4B |
| EBIT | 9.2B | 2.7B |
| Interest Expense | 3.3B | 7.6B |
| Net Income | 3.1B | 2.0B |
| EPS | 3.47 | 9.77 |
| Fiscal Year | 2024 | 2024 |
Income Statement Analysis: The Bottom-Line Duel
The income statement comparison below exposes the true operational efficiency and profitability momentum of each company’s core business engine.
KKR & Co. Inc. Analysis
KKR’s revenue surged 51% in 2024 to $21.6B, reflecting robust top-line growth over five years. However, gross profit declined nearly 21%, signaling margin pressure. The 14.2% net margin remains healthy but contracted sharply last year. Despite this, KKR sustains favorable EBIT margins above 40%, showing operational resilience amid rising costs.
Northern Trust Corporation Analysis
Northern Trust posted a 2025 revenue of $14.3B, down almost 10% year-over-year after steady growth since 2021. Its gross margin of 56.5% outpaces KKR, but net margin slipped to 12.2%. EBIT margin of 16.3% signals moderate profitability. Declining revenue and profitability metrics last year highlight challenges in maintaining momentum.
Margin Power vs. Revenue Scale
KKR commands superior scale and EBIT margins nearing 42%, yet suffers from margin erosion and net income decline. Northern Trust boasts stronger gross margins and steadier net income growth but faces recent revenue contraction. KKR’s size and operational leverage suit investors seeking scale; Northern Trust appeals more to those prioritizing margin stability.
Financial Ratios Comparison
These vital ratios act as a diagnostic tool to expose the underlying fiscal health, valuation premiums, and capital efficiency of each company:
| Ratios | KKR & Co. Inc. (KKR) | Northern Trust Corporation (NTRS) |
|---|---|---|
| ROE | 13.01% | 13.40% |
| ROIC | 0.25% | 5.04% |
| P/E | 42.65 | 14.75 |
| P/B | 5.55 | 1.98 |
| Current Ratio | 4.12 | 0.41 |
| Quick Ratio | 4.12 | 0.41 |
| D/E | 2.15 | 1.27 |
| Debt-to-Assets | 14.11% | 9.27% |
| Interest Coverage | 0.28 | 0.38 |
| Asset Turnover | 0.06 | 0.08 |
| Fixed Asset Turnover | 12.23 | 30.78 |
| Payout Ratio | 19.90% | 33.47% |
| Dividend Yield | 0.47% | 2.27% |
| Fiscal Year | 2024 | 2025 |
Efficiency & Valuation Duel: The Vital Signs
Financial ratios serve as a company’s DNA, unveiling hidden risks and operational strengths essential for informed investment decisions.
KKR & Co. Inc.
KKR shows solid net margins at 14.2% and a neutral ROE of 13%. However, its P/E of 42.7 signals an expensive valuation, stretching investor expectations. The company offers a low dividend yield of 0.47%, opting instead to reinvest earnings to fuel growth and operational efficiency.
Northern Trust Corporation
Northern Trust posts a favorable net margin of 12.2% with a neutral ROE of 13.4%, supported by a more reasonable P/E of 14.8. The stock yields 2.27% in dividends, reflecting a shareholder-friendly return policy amid moderate reinvestment. Its valuation appears less stretched than KKR’s, balancing profitability and income.
Premium Valuation vs. Operational Safety
KKR commands a premium valuation with higher risk from stretched multiples and modest returns. Northern Trust provides a steadier risk-reward profile, aided by attractive dividends and fair valuation. Investors seeking income and valuation discipline may prefer Northern Trust’s profile, while growth-focused investors might tolerate KKR’s premium for potential upside.
Which one offers the Superior Shareholder Reward?
I compare KKR & Co. Inc. and Northern Trust Corporation on shareholder reward. KKR yields a modest 0.47%, with a conservative 20% dividend payout and robust buybacks enhancing total return. Northern Trust pays a higher 3.1%–3.8% yield, but with a payout ratio near 60%, limiting reinvestment. KKR’s buyback intensity and lower payout ratio suggest a more sustainable, growth-oriented distribution. Northern Trust’s higher yield suits income investors but may sacrifice growth. I conclude KKR offers the superior total return profile in 2026 due to balanced distribution and capital allocation.
Comparative Score Analysis: The Strategic Profile
The radar chart reveals the fundamental DNA and trade-offs of KKR & Co. Inc. and Northern Trust Corporation’s financial profiles:
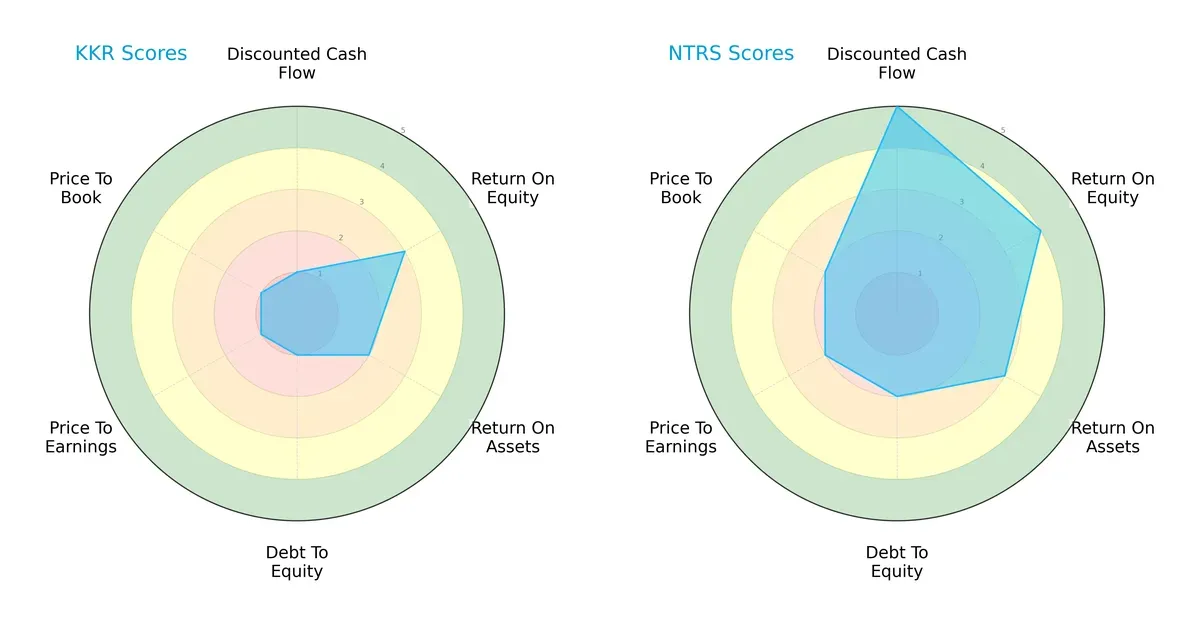
Northern Trust demonstrates a more balanced and favorable profile, excelling in discounted cash flow (5 vs. 1) and return on equity (4 vs. 3). KKR relies heavily on moderate ROE and ROA but scores very low on debt-to-equity and valuation metrics, signaling financial risk and potential overvaluation. Northern Trust’s moderate but consistent scores indicate a steadier investment proposition.
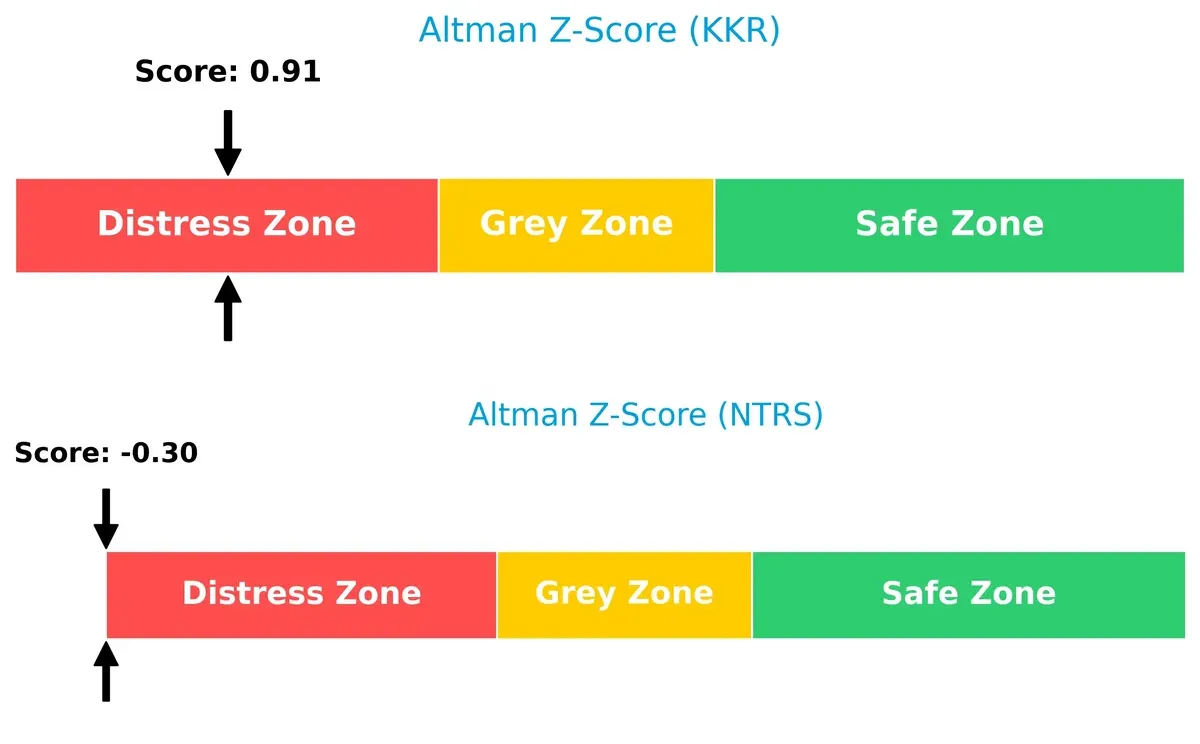
Bankruptcy Risk: Solvency Showdown
Northern Trust’s Altman Z-Score is slightly lower than KKR’s but both fall within the distress zone, implying significant bankruptcy risk amid current market pressures:
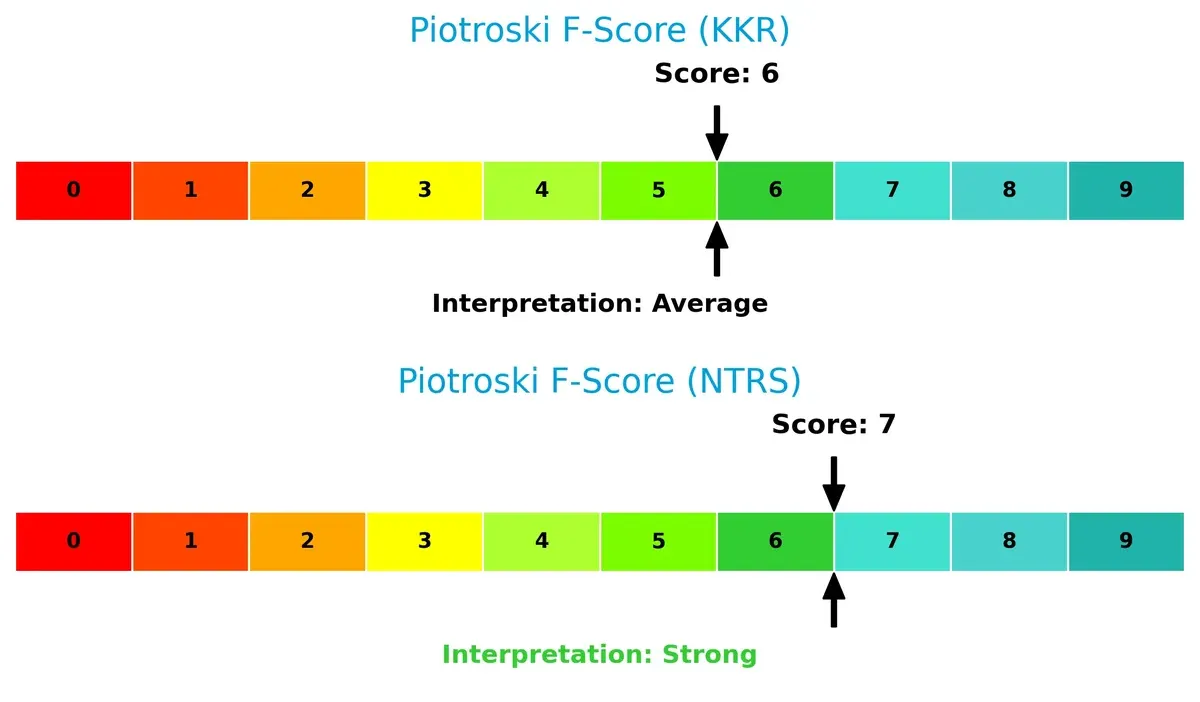
Financial Health: Quality of Operations
Northern Trust leads with a Piotroski F-Score of 7 (strong), while KKR scores 6 (average). This suggests Northern Trust maintains stronger internal financial controls and operational quality:
How are the two companies positioned?
This section dissects the operational DNA of KKR and Northern Trust by comparing their revenue distribution and internal dynamics. The goal is to confront their economic moats to identify which model offers the most resilient, sustainable competitive advantage today.
Revenue Segmentation: The Strategic Mix
This visual comparison dissects how KKR & Co. Inc. and Northern Trust Corporation diversify their income streams and where their primary sector bets lie:
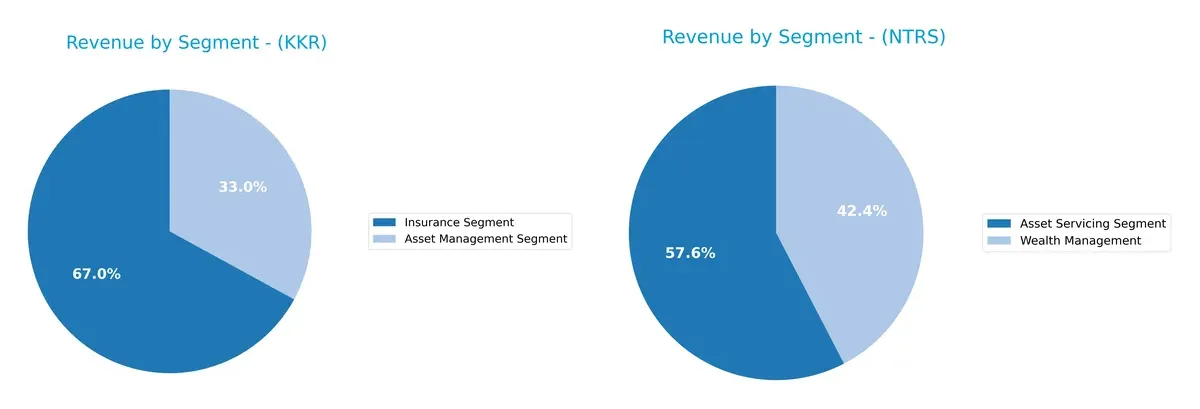
KKR pivots heavily on its Insurance Segment, generating $14.7B in 2024, dwarfing its $7.2B Asset Management revenue. This concentration signals reliance on insurance-driven cash flow. Northern Trust shows a more balanced mix, with $4.4B from Asset Servicing and $3.2B from Wealth Management, reflecting a diversified client-service ecosystem. KKR’s focus risks sector cyclicality, while Northern Trust’s spread anchors it against single-segment shocks.
Strengths and Weaknesses Comparison
This table compares the Strengths and Weaknesses of KKR & Co. Inc. and Northern Trust Corporation:
KKR & Co. Inc. Strengths
- Strong diversification between Asset Management and Insurance segments
- Favorable net margin at 14.22%
- High current and quick ratios indicating liquidity
- Low debt-to-assets ratio at 14.11%
- High fixed asset turnover ratio at 12.23
Northern Trust Corporation Strengths
- Diversified revenue from Asset Servicing and Wealth Management
- Favorable net margin at 12.15%
- Reasonable P/E ratio at 14.75
- Favorable dividend yield at 2.27%
- High fixed asset turnover ratio at 30.78
- Significant global presence with 2.24B foreign revenue
KKR & Co. Inc. Weaknesses
- Unfavorable ROIC at 0.25% below WACC of 10.13%
- High P/E and P/B ratios indicating overvaluation
- Elevated debt-to-equity ratio of 2.15
- Unfavorable asset turnover at 0.06
- Low dividend yield at 0.47%
- Neutral interest coverage ratio of 2.77
Northern Trust Corporation Weaknesses
- Current and quick ratios very low at 0.41, indicating liquidity risk
- Unfavorable interest coverage at 0.38
- Unfavorable debt-to-equity ratio of 1.27
- Unfavorable asset turnover at 0.08
- WACC high at 16.75%, exceeding ROIC of 5.04%
- Slightly unfavorable global ratios opinion
KKR shows strength in segment diversification and liquidity but struggles with capital efficiency and valuation metrics. Northern Trust benefits from global reach and dividend yield but faces liquidity and interest coverage challenges. Both companies reveal areas requiring prudent capital allocation and risk management.
The Moat Duel: Analyzing Competitive Defensibility
A structural moat alone protects long-term profits from relentless competition and market pressures. Let’s dissect the economic moats of KKR & Co. Inc. and Northern Trust Corporation:
KKR & Co. Inc.: Diversified Private Equity Moat
KKR’s moat stems from its diverse investment portfolio and deep industry expertise. This manifests in high ebit margins (42%) despite volatile net margins. However, declining ROIC signals weakening capital efficiency. New sectors like cyber security could deepen this moat but also face intense competition in 2026.
Northern Trust Corporation: Institutional Trust & Wealth Management Moat
Northern Trust leverages intangible assets such as client trust and specialized wealth services, contrasting KKR’s investment-driven moat. Its high gross margin (57%) underpins stable profitability. Yet, its declining ROIC and revenue shrinkage challenge future moat durability. Expansion in global wealth markets offers growth but risks disruption.
Value Creation vs. Capital Efficiency: Who Holds the Stronger Moat?
Both firms destroy value as ROIC trails WACC sharply, signaling weak moats. KKR’s operational leverage and growth in new sectors offer some upside, but Northern Trust’s client loyalty and global reach create a wider moat. Still, neither company currently defends market share with robust capital returns.
Which stock offers better returns?
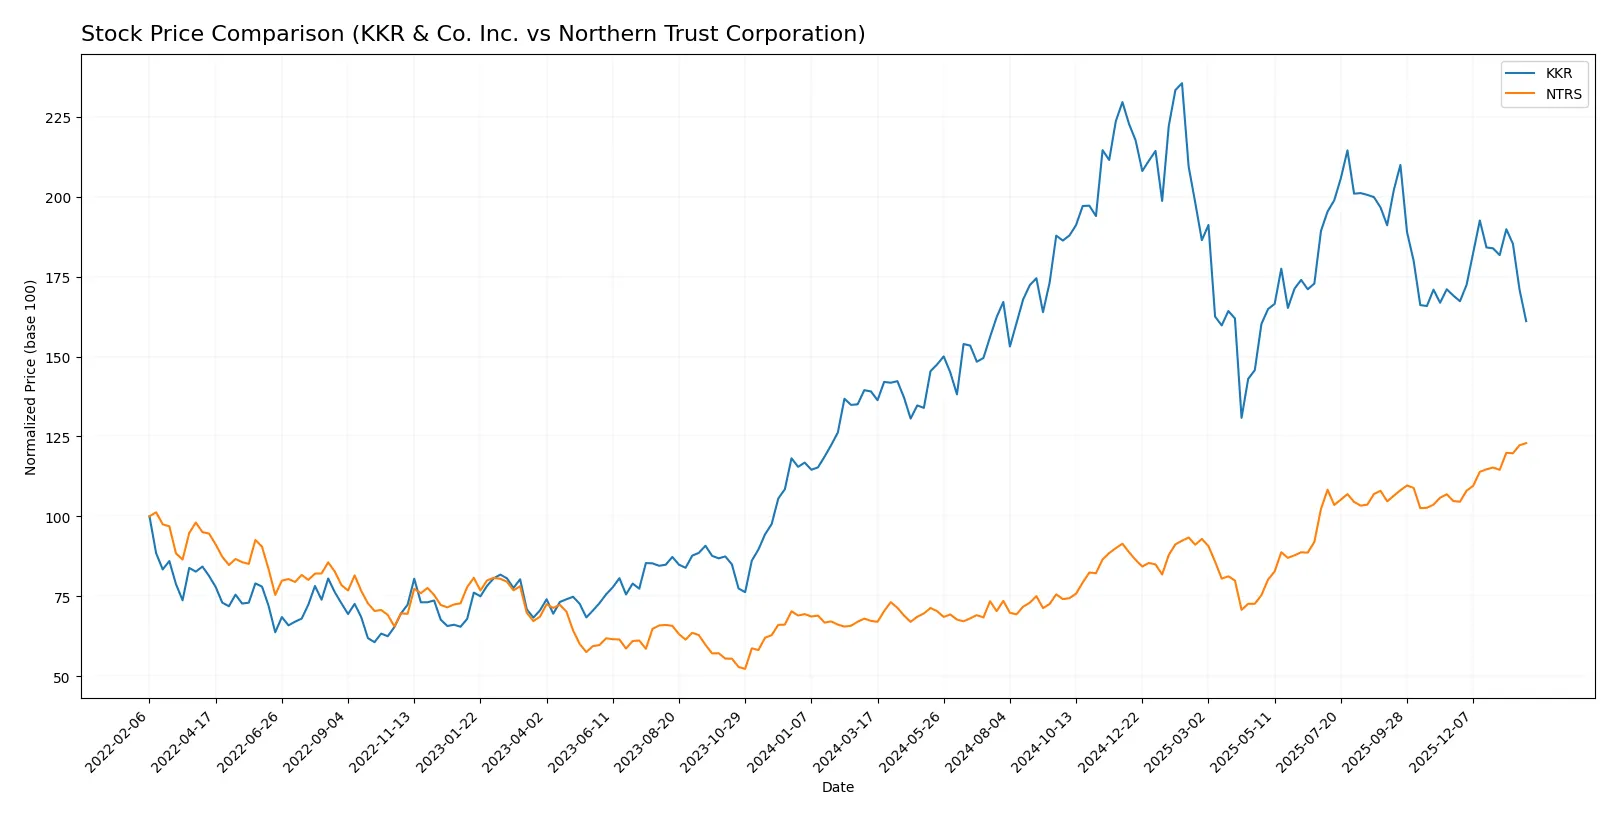
Both KKR & Co. Inc. and Northern Trust Corporation displayed notable price movements over the past year, with contrasting trends and trading dynamics shaping their performance.
Trend Comparison
KKR’s stock rose 15.82% over the past 12 months, indicating a bullish trend with decelerating momentum. The price ranged between 92.62 and 167.07, showing significant volatility (18.29% std deviation).
Northern Trust’s stock surged 82.65% over the same period, reflecting a strong bullish trend with accelerating gains. Price volatility was slightly higher at 19.71%, with a low of 81.45 and a high near 149.43.
Northern Trust outperformed KKR overall, delivering substantially higher returns and accelerating price gains, despite its lower trading volume relative to KKR.
Target Prices
Analysts show a moderately bullish consensus on KKR & Co. Inc. and Northern Trust Corporation.
| Company | Target Low | Target High | Consensus |
|---|---|---|---|
| KKR & Co. Inc. | 144 | 190 | 165.33 |
| Northern Trust Corporation | 131 | 160 | 146.17 |
KKR’s target consensus at 165.33 exceeds its current price of 114.26, indicating potential upside. Northern Trust’s consensus of 146.17 aligns closely with its current price of 149.43, suggesting a more neutral outlook.

Don’t Let Luck Decide Your Entry Point
Optimize your entry points with our advanced ProRealTime indicators. You’ll get efficient buy signals with precise price targets for maximum performance. Start outperforming now!
How do institutions grade them?
KKR & Co. Inc. Grades
The table below presents recent institutional grades for KKR & Co. Inc.:
| Grading Company | Action | New Grade | Date |
|---|---|---|---|
| TD Cowen | Downgrade | Hold | 2026-01-14 |
| UBS | Maintain | Buy | 2026-01-13 |
| Barclays | Maintain | Overweight | 2026-01-09 |
| Barclays | Maintain | Overweight | 2025-12-12 |
| Barclays | Maintain | Overweight | 2025-11-11 |
| TD Cowen | Maintain | Buy | 2025-11-10 |
| Oppenheimer | Maintain | Outperform | 2025-11-10 |
| Morgan Stanley | Maintain | Overweight | 2025-10-21 |
| Oppenheimer | Maintain | Outperform | 2025-10-14 |
| Citigroup | Maintain | Buy | 2025-10-13 |
Northern Trust Corporation Grades
The table below presents recent institutional grades for Northern Trust Corporation:
| Grading Company | Action | New Grade | Date |
|---|---|---|---|
| Goldman Sachs | Maintain | Sell | 2026-01-28 |
| Citigroup | Maintain | Neutral | 2026-01-28 |
| TD Cowen | Maintain | Buy | 2026-01-26 |
| Wells Fargo | Maintain | Equal Weight | 2026-01-23 |
| RBC Capital | Maintain | Outperform | 2026-01-23 |
| Morgan Stanley | Maintain | Underweight | 2026-01-23 |
| Evercore ISI Group | Maintain | In Line | 2026-01-23 |
| TD Cowen | Maintain | Buy | 2026-01-07 |
| Barclays | Maintain | Equal Weight | 2026-01-05 |
| Citigroup | Maintain | Neutral | 2025-12-30 |
Which company has the best grades?
KKR & Co. Inc. shows stronger consensus with multiple “Buy,” “Overweight,” and “Outperform” ratings. Northern Trust Corporation’s grades are more mixed, including several “Neutral,” “Sell,” and “Underweight” ratings. Investors may interpret KKR’s grades as reflecting greater confidence from analysts.
Risks specific to each company
The following categories identify critical pressure points and systemic threats facing KKR & Co. Inc. and Northern Trust Corporation in the 2026 market environment:
1. Market & Competition
KKR & Co. Inc.
- Faces intense competition in private equity and real estate sectors globally, with pressure on deal sourcing and valuations.
Northern Trust Corporation
- Competes in wealth management and asset servicing, facing rising competition from fintech and global banks.
2. Capital Structure & Debt
KKR & Co. Inc.
- High debt-to-equity ratio (2.15) increases financial risk despite moderate interest coverage (2.77).
Northern Trust Corporation
- Moderate leverage (D/E 1.27) but very weak interest coverage (0.38) signals potential liquidity stress.
3. Stock Volatility
KKR & Co. Inc.
- High beta (1.996) indicates elevated price volatility, increasing investor risk in market downturns.
Northern Trust Corporation
- Lower beta (1.276) suggests comparatively less volatility, providing more stable price behavior.
4. Regulatory & Legal
KKR & Co. Inc.
- Exposure to complex multi-jurisdictional regulations across sectors including energy, real estate, and financial services.
Northern Trust Corporation
- Subject to stringent banking and asset management regulations, with heightened scrutiny post-2025 reforms.
5. Supply Chain & Operations
KKR & Co. Inc.
- Operational risks stem from diverse portfolio companies and reliance on deal execution amid economic cycles.
Northern Trust Corporation
- Operational complexity in global custody and fund administration could face disruptions from tech failures or cyber threats.
6. ESG & Climate Transition
KKR & Co. Inc.
- Active in impact investing but faces transition risks in energy and natural resources sectors.
Northern Trust Corporation
- Increasing pressure to integrate ESG in wealth management products and reduce carbon footprint in operations.
7. Geopolitical Exposure
KKR & Co. Inc.
- Significant geographic diversification but exposed to emerging market volatility and regulatory shifts.
Northern Trust Corporation
- Primarily US and developed markets focus limits emerging market risk but increases sensitivity to US policy changes.
Which company shows a better risk-adjusted profile?
KKR’s biggest risk is its high leverage combined with unfavorable capital allocation metrics, raising bankruptcy concerns. Northern Trust’s main vulnerability lies in weak interest coverage and operational risks, though it shows stronger valuation and financial scores. Despite both in financial distress zones by Altman Z-Score, Northern Trust’s higher Piotroski score and lower stock volatility suggest a better risk-adjusted profile. Recent data highlight KKR’s disproportionately high debt-to-equity ratio versus Northern Trust’s more balanced, albeit challenged, financial footing.
Final Verdict: Which stock to choose?
KKR & Co. Inc. excels as a cash-generating powerhouse, fueled by aggressive revenue growth and robust operational cash flows. Its point of vigilance lies in declining capital efficiency and a stretched balance sheet. This stock fits an aggressive growth portfolio willing to tolerate volatility for outsized returns.
Northern Trust Corporation boasts a strategic moat in stable, recurring revenue streams and disciplined capital management. Though its financial leverage and liquidity ratios warrant caution, it offers better stability and a more attractive valuation profile. This makes it suitable for GARP investors seeking balanced growth with risk control.
If you prioritize high-growth potential and can stomach capital inefficiency, KKR is the compelling choice due to its revenue expansion and cash generation. However, if you seek capital preservation combined with consistent earnings and valuation discipline, Northern Trust offers better stability and a stronger risk-reward profile. Both demand careful risk management given their financial challenges.
Disclaimer: Investment carries a risk of loss of initial capital. The past performance is not a reliable indicator of future results. Be sure to understand risks before making an investment decision.
Go Further
I encourage you to read the complete analyses of KKR & Co. Inc. and Northern Trust Corporation to enhance your investment decisions: