Home > Comparison > Energy > WMB vs KMI
The strategic rivalry between The Williams Companies, Inc. and Kinder Morgan, Inc. shapes the midstream energy sector’s future. Williams focuses on natural gas gathering, processing, and NGL marketing, emphasizing regional specialization. Kinder Morgan operates a broader pipeline and terminal network, integrating CO2 and refined products. This head-to-head pits focused operational depth against diversified infrastructure scale. This analysis will identify which trajectory offers superior risk-adjusted returns for a balanced energy portfolio.

Table of contents
Companies Overview
The Williams Companies and Kinder Morgan dominate the U.S. midstream energy infrastructure sector with vast pipeline networks.
The Williams Companies, Inc.: Specialized U.S. Midstream Operator
The Williams Companies primarily operates in U.S. natural gas midstream infrastructure. Its core revenue comes from pipeline transmission, gathering, and processing, plus NGL marketing services. In 2026, it focuses strategically on expanding gas processing and fractionation in key shale basins, leveraging its 30,000 miles of pipelines and 23M barrels of NGL storage capacity.
Kinder Morgan, Inc.: North America’s Pipeline and Terminal Giant
Kinder Morgan operates a diverse energy infrastructure platform across North America. It generates revenue through natural gas and product pipelines, terminals, and CO2 operations. The company’s 2026 strategy emphasizes optimizing its 83,000 miles of pipelines and 143 terminals while advancing CO2 enhanced oil recovery and renewable gas facilities for long-term growth.
Strategic Collision: Similarities & Divergences
Both companies rely on expansive pipeline assets but differ in business scope. Williams focuses on natural gas and shale processing, while Kinder Morgan adopts a broader approach including products pipelines and terminals. Their key battleground is pipeline capacity and midstream service innovation. Investors face distinct profiles: Williams is a focused shale specialist; Kinder Morgan a diversified infrastructure conglomerate.
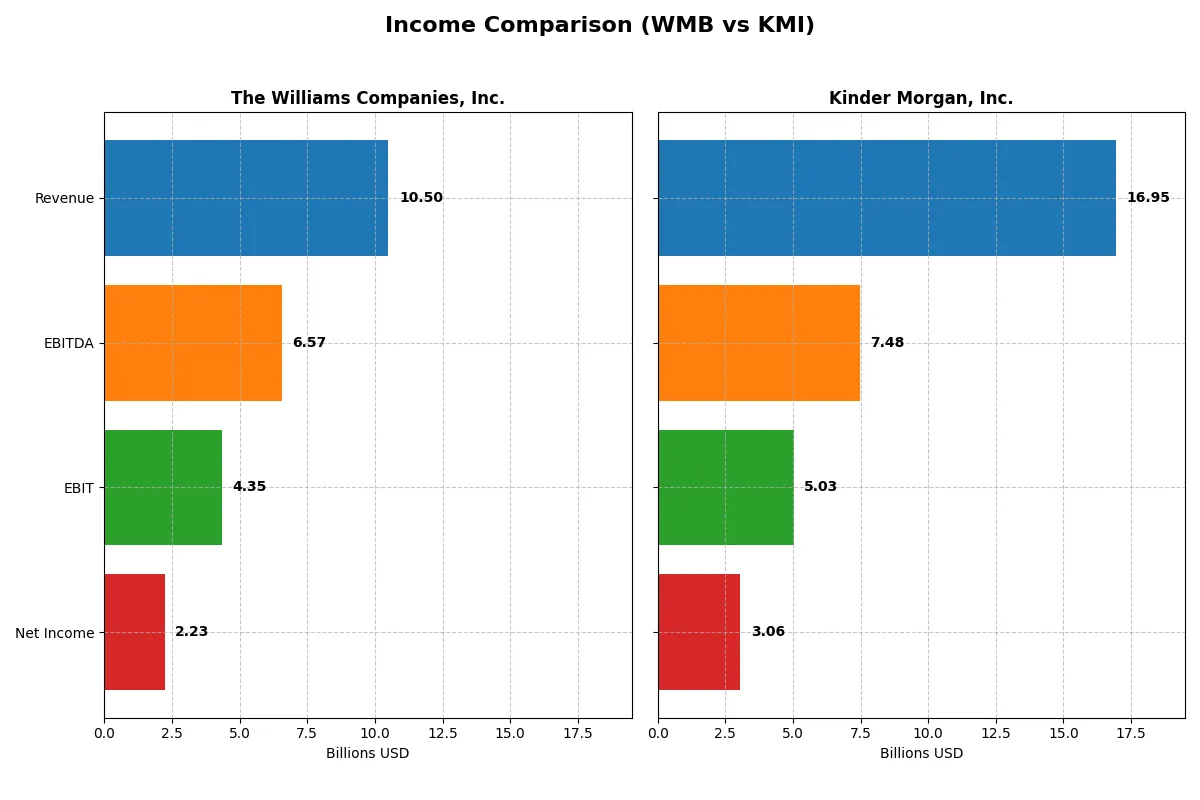
Income Statement Comparison
This data dissects the core profitability and scalability of both corporate engines to reveal who dominates the bottom line:
| Metric | The Williams Companies, Inc. (WMB) | Kinder Morgan, Inc. (KMI) |
|---|---|---|
| Revenue | 10.5B | 15.1B |
| Cost of Revenue | 4.3B | 9.5B |
| Operating Expenses | 2.8B | 1.1B |
| Gross Profit | 6.2B | 5.5B |
| EBITDA | 6.6B | 7.6B |
| EBIT | 4.4B | 5.3B |
| Interest Expense | 1.4B | 1.9B |
| Net Income | 2.2B | 2.6B |
| EPS | 1.82 | 1.17 |
| Fiscal Year | 2024 | 2024 |
Income Statement Analysis: The Bottom-Line Duel
This income statement comparison reveals which company leverages its revenue into profits more effectively, showcasing operational strength and margin resilience.
The Williams Companies, Inc. Analysis
WMB shows a revenue dip to 10.5B in 2024 from a peak of 10.9B in 2022, but net income surged over five years to 2.2B in 2024. Gross margin remains robust near 59%, supporting strong profitability despite a 3.7% revenue decline last year. However, a 13% interest expense weighs on net margins, which nevertheless hold a solid 21%.
Kinder Morgan, Inc. Analysis
KMI posted 16.9B revenue in 2025, up 12.5% year-over-year, with net income climbing to 3.1B. Gross margin at 44% trails WMB but improved sharply last year. EBIT margin holds at 30%, signaling operational efficiency. Interest expense at 11% is slightly lower than WMB’s, aiding a respectable 18% net margin, supported by steady EPS growth.
Margin Strength vs. Growth Momentum
WMB excels in margin health with higher gross and net margins, reflecting efficient cost control and strong profitability. KMI delivers superior revenue growth and expanding gross profit, showing momentum but with thinner margins. For investors prioritizing profitability over scale, WMB’s margin profile dominates; growth-focused investors may find KMI’s expanding top line and improving margins more compelling.
Financial Ratios Comparison
These vital ratios act as a diagnostic tool to expose the underlying fiscal health, valuation premiums, and capital efficiency of the companies analyzed:
| Ratios | The Williams Companies, Inc. (WMB) | Kinder Morgan, Inc. (KMI) |
|---|---|---|
| ROE | 17.9% (2024) | 9.8% (2025) |
| ROIC | 5.1% (2024) | 5.8% (2025) |
| P/E | 29.7 (2024) | 20.0 (2025) |
| P/B | 5.31 (2024) | 1.96 (2025) |
| Current Ratio | 0.50 (2024) | 0.03 (2025) |
| Quick Ratio | 0.45 (2024) | 0.03 (2025) |
| D/E (Debt-to-Equity) | 2.18 (2024) | 1.02 (2025) |
| Debt-to-Assets | 49.7% (2024) | 43.7% (2025) |
| Interest Coverage | 2.45 (2024) | 2.67 (2025) |
| Asset Turnover | 0.19 (2024) | 0.23 (2025) |
| Fixed Asset Turnover | 0.27 (2024) | 0.43 (2025) |
| Payout Ratio | 104.1% (2024) | 84.8% (2025) |
| Dividend Yield | 3.51% (2024) | 4.24% (2025) |
| Fiscal Year | 2024 | 2025 |
Efficiency & Valuation Duel: The Vital Signs
Financial ratios act as a company’s DNA, uncovering hidden risks and operational excellence crucial for sound investment decisions.
The Williams Companies, Inc. (WMB)
WMB shows strong profitability with a 17.9% ROE and robust 21.2% net margin, signaling operational efficiency. However, its valuation appears stretched, with a P/E of 29.65 and high P/B at 5.31. The 3.51% dividend yield reflects shareholder returns, balancing reinvestment with steady payouts.
Kinder Morgan, Inc. (KMI)
KMI posts a lower 9.8% ROE and 18.0% net margin, indicating moderate profitability. Its valuation metrics are more reasonable, with a P/E of 20.01 and P/B near 2, suggesting fair pricing. A higher 4.24% dividend yield highlights a strong commitment to shareholder income amid neutral capital efficiency.
Balanced Profitability vs. Valuation Discipline
WMB delivers superior profitability but trades at a premium with stretched valuation multiples, implying higher risk. KMI offers a more moderate profit profile with fairer valuation and a stronger dividend yield. Investors seeking growth may favor WMB’s efficiency, while income-focused investors might prefer KMI’s steady returns.
Which one offers the Superior Shareholder Reward?
I compare The Williams Companies, Inc. (WMB) and Kinder Morgan, Inc. (KMI) on distribution strategies. WMB offers a 3.5% dividend yield with a payout ratio slightly above 100%, signaling dividend sustainability risks. KMI pays a 4.2% yield with a sub-100% payout ratio, indicating healthier free cash flow coverage. WMB’s buybacks have weakened recently, while KMI maintains consistent buyback activity, enhancing total returns. Historically, WMB’s higher yield comes with leverage concerns and payout strain. I find KMI’s balanced dividend and buyback approach more sustainable. For 2026, KMI delivers a superior total shareholder reward through prudent capital allocation and stable distributions.
Comparative Score Analysis: The Strategic Profile
The radar chart reveals the fundamental DNA and trade-offs of The Williams Companies, Inc. and Kinder Morgan, Inc., highlighting their key financial strengths and vulnerabilities:
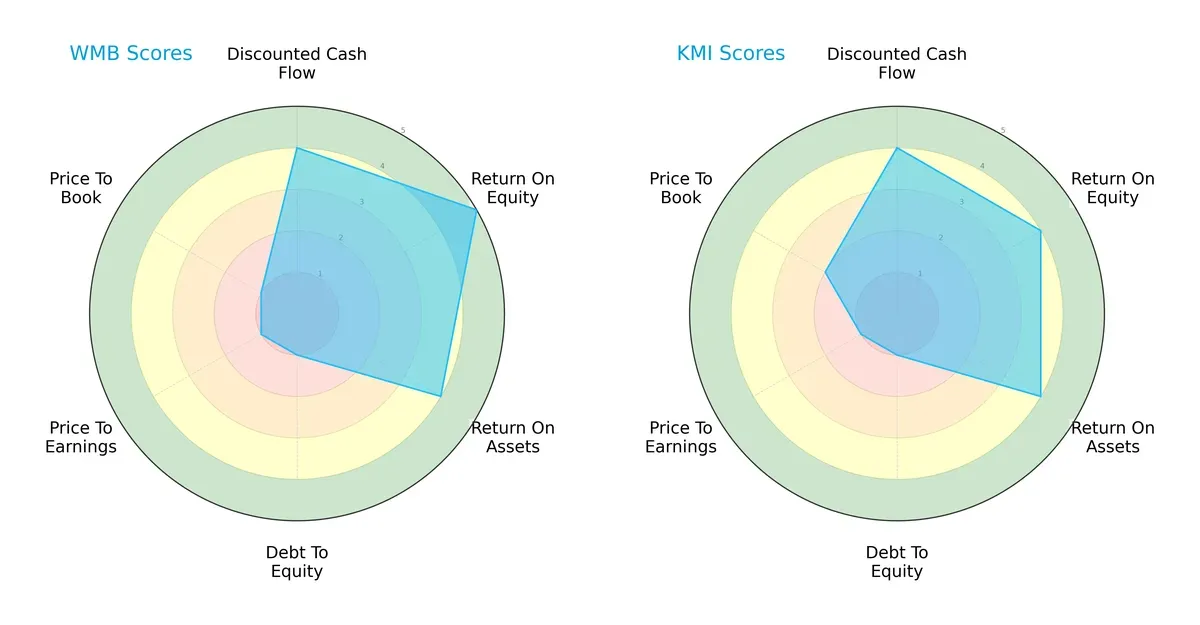
Both firms share a balanced overall score of 3, reflecting moderate financial standing. Williams leads slightly in return on equity (5 vs. 4), signaling superior shareholder profitability. Both match on discounted cash flow (4) and return on assets (4), showing similar operational efficiency. Both struggle with debt-to-equity (1), revealing high financial leverage risk. Williams lags further in valuation metrics (P/E and P/B at 1), suggesting potential overvaluation risk compared to Kinder Morgan’s moderate P/B score (2). Williams leans on profitability edges, while Kinder Morgan offers a marginally more stable valuation profile.
Bankruptcy Risk: Solvency Showdown
The Altman Z-Scores place both companies in the distress zone, underscoring elevated bankruptcy risk amid current market conditions:
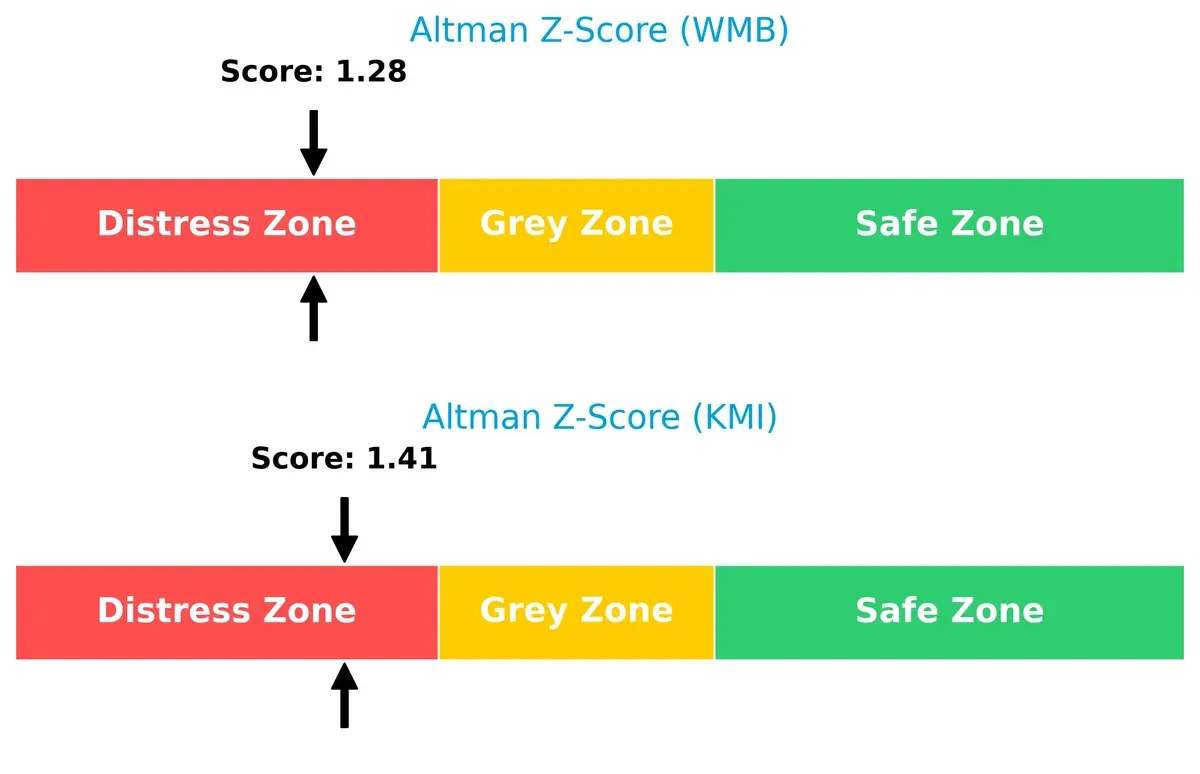
Williams posts a slightly lower score (1.28) than Kinder Morgan (1.41), indicating marginally higher financial distress. Both face significant solvency challenges, necessitating cautious risk management for long-term survival.
Financial Health: Quality of Operations
Piotroski F-Scores show equivalent financial health, with both companies scoring a moderate 6, signaling average operational quality without glaring red flags:
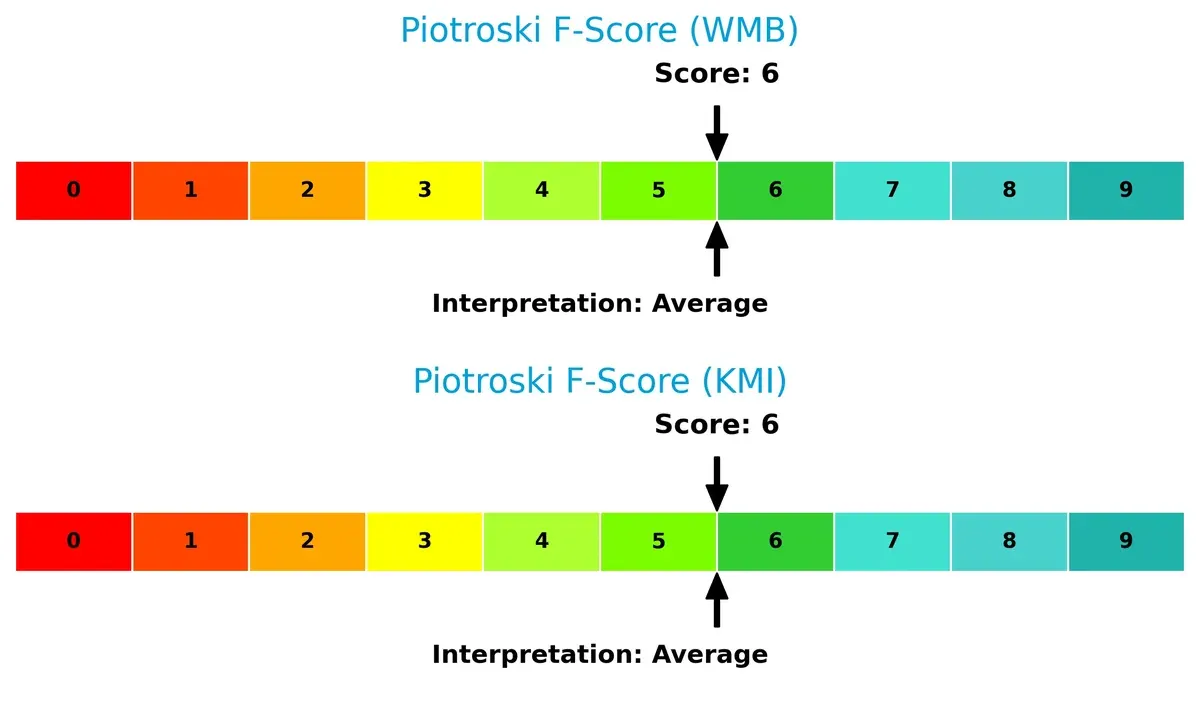
Neither firm excels in internal financial metrics, but both maintain sufficient health to avoid immediate concern. Investors should monitor closely for any deterioration in profitability or liquidity.
How are the two companies positioned?
This section dissects the operational DNA of WMB and KMI by comparing their revenue distribution across segments and analyzing internal strengths and weaknesses. The goal is to confront their economic moats and reveal which business model offers the most resilient, sustainable competitive advantage in today’s market.
Revenue Segmentation: The Strategic Mix
The following visual comparison dissects how The Williams Companies, Inc. and Kinder Morgan, Inc. diversify their income streams and where their primary sector bets lie:
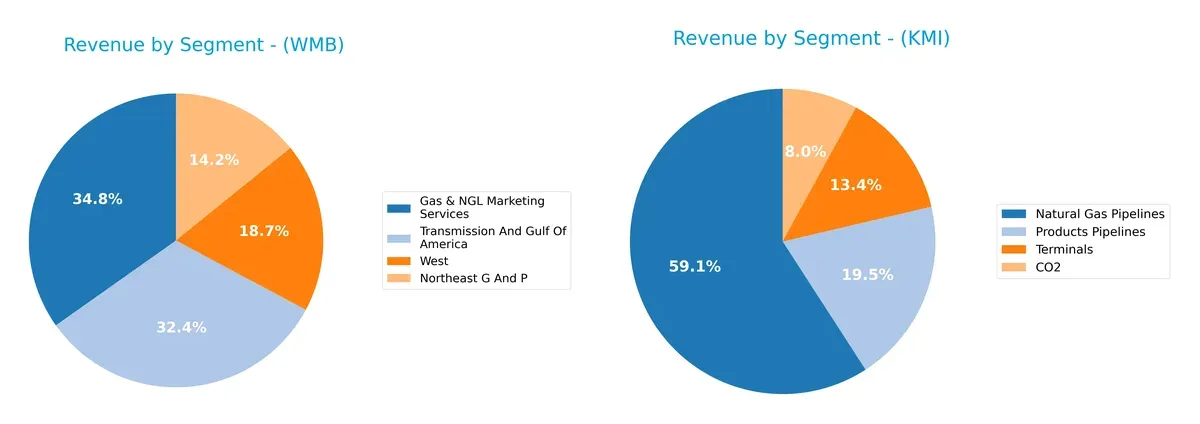
Williams leans on Gas & NGL Marketing Services ($4.98B) and Transmission & Gulf of America ($4.63B), showing moderate diversification across four segments. Kinder Morgan pivots heavily on Natural Gas Pipelines ($8.94B), dwarfing its CO2 ($1.2B) and Terminals ($2.02B) segments. Williams’ balanced mix mitigates concentration risk, while Kinder Morgan’s dominance in pipelines anchors its infrastructure moat but increases exposure to sector cyclicality.
Strengths and Weaknesses Comparison
This table compares the strengths and weaknesses of The Williams Companies, Inc. (WMB) and Kinder Morgan, Inc. (KMI):
WMB Strengths
- Favorable net margin at 21.18%
- Strong ROE of 17.89%
- Favorable dividend yield of 3.51%
- Diverse revenue streams across Gas & NGL Marketing, Northeast G And P, and Transmission
- Neutral debt-to-assets ratio at 49.66%
KMI Strengths
- Favorable net margin at 18.03%
- Favorable WACC at 6.16%
- Higher dividend yield of 4.24%
- Large revenue from Natural Gas Pipelines and diversified segments including CO2 and Terminals
- Geographic presence in United States, Mexico, and Canada
WMB Weaknesses
- Unfavorable PE and PB ratios indicating possible overvaluation
- Low current and quick ratios at 0.5 and 0.45 signaling liquidity concerns
- High debt-to-equity ratio at 2.18
- Unfavorable asset and fixed asset turnover ratios
- Slightly unfavorable overall financial ratios
KMI Weaknesses
- Unfavorable ROE at 9.81%
- Extremely low current and quick ratios at 0.03 each
- Unfavorable debt-to-equity ratio at 1.02
- Unfavorable asset and fixed asset turnover ratios
- Slightly unfavorable overall financial ratios
Overall, both companies face liquidity and asset utilization challenges despite solid profitability and dividend performance. Their strategic focus on diverse revenue streams and pipeline assets supports resilience, yet financial structure risks warrant cautious monitoring.
The Moat Duel: Analyzing Competitive Defensibility
Structural moats shield long-term profits from relentless competitive erosion. Without one, firms risk margin collapse and lost market share:
The Williams Companies, Inc.: Infrastructure Scale & Regional Specialization
Williams leverages its vast pipeline network and niche in shale gas regions to maintain switching costs. Despite a slightly unfavorable ROIC vs. WACC, its growing profitability suggests potential moat strengthening in 2026 through strategic asset optimization.
Kinder Morgan, Inc.: Network Breadth & Diversification
Kinder Morgan’s competitive advantage lies in its extensive pipeline and terminal network across North America, enabling operational scale unmatched by Williams. However, declining ROIC signals weakening efficiency, though recent revenue growth and geographic diversification could offer a turnaround opportunity.
Verdict: Scale and Specialization vs. Network Breadth and Efficiency
Williams holds a deeper moat with its focused regional expertise and improving ROIC trend. Kinder Morgan’s broader footprint is impressive but undermined by deteriorating capital returns. Williams appears better positioned to defend market share in 2026.
Which stock offers better returns?
Both stocks have demonstrated strong price appreciation over the past year, with notable acceleration and distinct trading volume dynamics.
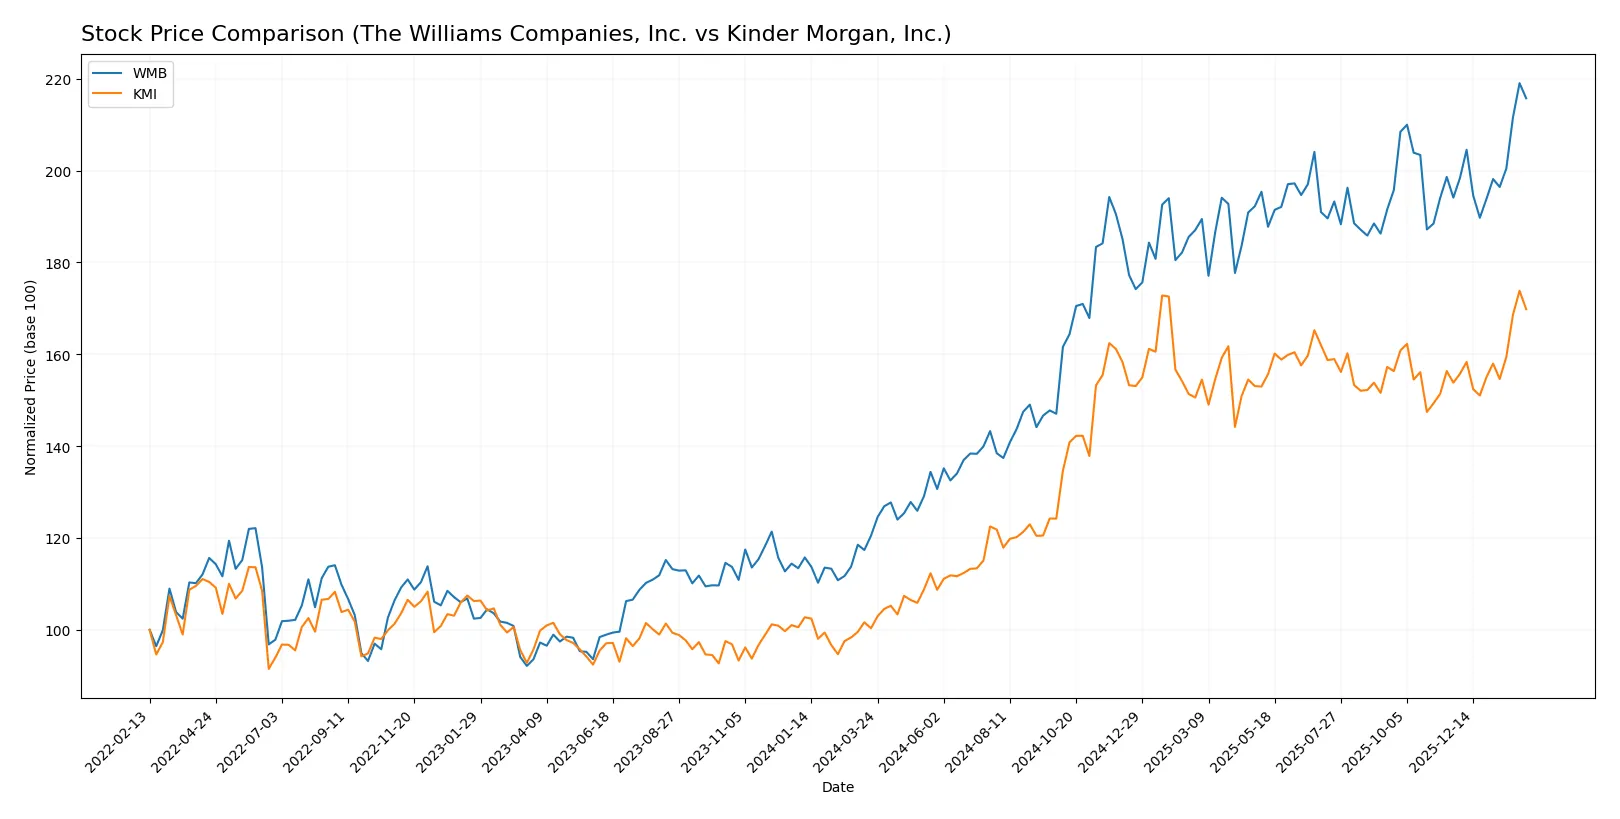
Trend Comparison
The Williams Companies, Inc. (WMB) shows a bullish trend with a 79.06% price increase over the past 12 months, accelerating from a low of 37.0 to a high of 67.26. Volatility is moderate at 8.23.
Kinder Morgan, Inc. (KMI) also exhibits a bullish trend, rising 69.23% over the past year with accelerating momentum. Its price ranged from 17.6 to 30.49, with lower volatility at 3.6.
WMB outperformed KMI with a higher percentage gain and greater recent acceleration, delivering the superior market performance in the analyzed period.
Target Prices
Analysts present a clear consensus on target prices for The Williams Companies, Inc. and Kinder Morgan, Inc.
| Company | Target Low | Target High | Consensus |
|---|---|---|---|
| The Williams Companies, Inc. | 66 | 83 | 72 |
| Kinder Morgan, Inc. | 30 | 38 | 34.33 |
The Williams Companies’ consensus target of $72 exceeds its current $66.66 price, signaling moderate upside. Kinder Morgan’s $34.33 target also surpasses its $29.85 market price, suggesting potential value for investors.

Don’t Let Luck Decide Your Entry Point
Optimize your entry points with our advanced ProRealTime indicators. You’ll get efficient buy signals with precise price targets for maximum performance. Start outperforming now!
How do institutions grade them?
Here is a comparison of recent institutional grades assigned to The Williams Companies, Inc. and Kinder Morgan, Inc.:
The Williams Companies, Inc. Grades
The following table summarizes recent grades from notable financial institutions for The Williams Companies, Inc.:
| Grading Company | Action | New Grade | Date |
|---|---|---|---|
| Jefferies | Maintain | Buy | 2026-01-09 |
| Citigroup | Maintain | Buy | 2025-11-13 |
| TD Cowen | Maintain | Buy | 2025-11-06 |
| Jefferies | Maintain | Buy | 2025-11-05 |
| BMO Capital | Maintain | Outperform | 2025-11-05 |
| Barclays | Maintain | Equal Weight | 2025-10-14 |
| Goldman Sachs | Maintain | Neutral | 2025-10-02 |
| Morgan Stanley | Maintain | Overweight | 2025-10-02 |
| UBS | Maintain | Buy | 2025-09-30 |
| Barclays | Maintain | Equal Weight | 2025-09-30 |
Kinder Morgan, Inc. Grades
Below are recent grades from recognized institutions for Kinder Morgan, Inc.:
| Grading Company | Action | New Grade | Date |
|---|---|---|---|
| Scotiabank | Maintain | Sector Perform | 2026-01-23 |
| Jefferies | Maintain | Hold | 2026-01-22 |
| TD Cowen | Maintain | Buy | 2026-01-22 |
| Jefferies | Maintain | Hold | 2025-12-23 |
| Mizuho | Maintain | Outperform | 2025-11-14 |
| RBC Capital | Maintain | Sector Perform | 2025-11-13 |
| Stifel | Maintain | Hold | 2025-11-11 |
| Morgan Stanley | Maintain | Equal Weight | 2025-10-01 |
| Scotiabank | Maintain | Sector Perform | 2025-09-19 |
| Stifel | Maintain | Hold | 2025-08-14 |
Which company has the best grades?
The Williams Companies, Inc. consistently receives Buy and Outperform ratings, signaling stronger analyst confidence. Kinder Morgan, Inc. has a broader range, from Buy to Hold and Sector Perform, indicating more cautious sentiment. This disparity may influence investors seeking higher conviction in analyst support.
Risks specific to each company
The following categories identify the critical pressure points and systemic threats facing both firms in the 2026 market environment:
1. Market & Competition
The Williams Companies, Inc.
- Faces intense competition in U.S. midstream natural gas markets, with exposure to regional shale plays and infrastructure constraints.
Kinder Morgan, Inc.
- Competes broadly across North American pipelines and terminals, with a diversified portfolio but pressure from renewable energy trends.
2. Capital Structure & Debt
The Williams Companies, Inc.
- High debt-to-equity ratio of 2.18 signals leveraged balance sheet; interest coverage is moderate at 3.19x.
Kinder Morgan, Inc.
- Debt-to-equity at 1.02 shows better leverage control; interest coverage slightly lower at 2.79x, indicating tighter debt servicing capacity.
3. Stock Volatility
The Williams Companies, Inc.
- Beta of 0.658 indicates lower volatility versus market; price range is stable with recent slight pullback.
Kinder Morgan, Inc.
- Beta slightly higher at 0.686; exhibits more significant price swings and higher trading volumes, implying greater sensitivity to market moves.
4. Regulatory & Legal
The Williams Companies, Inc.
- Regulatory risks from pipeline safety and environmental compliance remain elevated, especially in Gulf Coast and Northeast operations.
Kinder Morgan, Inc.
- Faces complex regulatory environment across multiple pipeline and terminal types, including CO2 and LNG segments.
5. Supply Chain & Operations
The Williams Companies, Inc.
- Operational complexity in multiple shale regions and Gulf Coast logistics; asset turnover ratios suggest underutilization.
Kinder Morgan, Inc.
- Larger asset base with more terminals and pipeline miles; fixed asset turnover better but still below industry ideal.
6. ESG & Climate Transition
The Williams Companies, Inc.
- Moderate ESG risk with ongoing transition challenges; exposure to fossil fuel infrastructure amid tightening climate policies.
Kinder Morgan, Inc.
- Faces high ESG pressure due to diverse fossil fuel assets and CO2 operations; climate transition strategies are critical for future stability.
7. Geopolitical Exposure
The Williams Companies, Inc.
- Primarily U.S.-focused, limiting direct geopolitical risks, but vulnerable to domestic policy shifts and energy export dynamics.
Kinder Morgan, Inc.
- Also U.S.-centric but with broader North American footprint, exposing it to cross-border regulatory and trade issues.
Which company shows a better risk-adjusted profile?
The Williams Companies’ highest risk is its heavy leverage combined with low liquidity ratios, placing it in financial distress territory. Kinder Morgan, while also leveraged, maintains a more balanced debt load and shows somewhat better operational efficiency. Both companies face regulatory and ESG headwinds, but Kinder Morgan’s diversified assets and slightly better capital structure offer a marginally superior risk-adjusted profile. A recent trend of declining liquidity ratios for both signals caution, but Kinder Morgan’s lower debt-to-equity ratio and stronger asset turnover justify a more resilient stance.
Final Verdict: Which stock to choose?
The Williams Companies, Inc. (WMB) shines with a rising profitability trend despite its current value destruction. Its superpower lies in steadily improving returns amid operational challenges, making it a fit for investors willing to embrace medium-term recovery risks. Its liquidity constraints remain a point of vigilance.
Kinder Morgan, Inc. (KMI) boasts a strategic moat rooted in its scale and infrastructure network, offering more stable cash flow dynamics. While it faces declining profitability, it presents a comparatively safer profile than WMB. KMI suits portfolios seeking steady income with moderate growth prospects.
If you prioritize turnaround potential and accelerating profitability, WMB presents a compelling scenario due to its improving ROIC trends and bullish price momentum. However, if you seek relative stability and dependable cash flow, KMI offers better stability despite its deteriorating profitability. Both carry liquidity and leverage risks, demanding careful risk management.
Disclaimer: Investment carries a risk of loss of initial capital. The past performance is not a reliable indicator of future results. Be sure to understand risks before making an investment decision.
Go Further
I encourage you to read the complete analyses of The Williams Companies, Inc. and Kinder Morgan, Inc. to enhance your investment decisions: