Home > Comparison > Energy > KMI vs TRGP
The strategic rivalry between Kinder Morgan, Inc. and Targa Resources Corp. shapes the energy midstream sector’s future. Kinder Morgan operates as a capital-intensive infrastructure giant with extensive pipelines and terminals. In contrast, Targa Resources focuses on integrated midstream services emphasizing gathering, processing, and logistics. This analysis pits scale against operational specialization to identify which corporate trajectory delivers superior risk-adjusted returns for a diversified portfolio in a complex energy landscape.
Table of contents
Companies Overview
Kinder Morgan and Targa Resources stand as major players in North America’s oil and gas midstream sector.
Kinder Morgan, Inc.: Energy Infrastructure Giant
Kinder Morgan dominates with 83,000 miles of pipelines and 143 terminals across natural gas, products pipelines, terminals, and CO2 segments. Its revenue engine centers on transporting and storing natural gas, refined products, and CO2 for enhanced oil recovery. In 2026, the company focuses on optimizing its vast pipeline network and expanding renewable natural gas and LNG facilities to diversify energy infrastructure.
Targa Resources Corp.: Midstream Specialist
Targa Resources operates a portfolio of midstream assets focusing on gathering, processing, logistics, and transportation of natural gas, NGLs, and crude oil. It owns 28,400 miles of pipelines and 42 processing plants, emphasizing NGL fractionation and export services. In 2026, Targa prioritizes expanding its NGL logistics and storage capacity to strengthen its foothold in the Gulf Coast energy corridor.
Strategic Collision: Similarities & Divergences
Kinder Morgan adopts a broad infrastructure scale strategy, spanning multiple energy segments with integrated terminals and CO2 services. Targa targets a more focused midstream niche with processing and logistics specialization. Their primary battleground lies in natural gas liquids and pipeline capacity expansion. Investors face contrasting profiles: Kinder Morgan offers scale and diversification, while Targa delivers growth through operational focus and asset specialization.
Income Statement Comparison
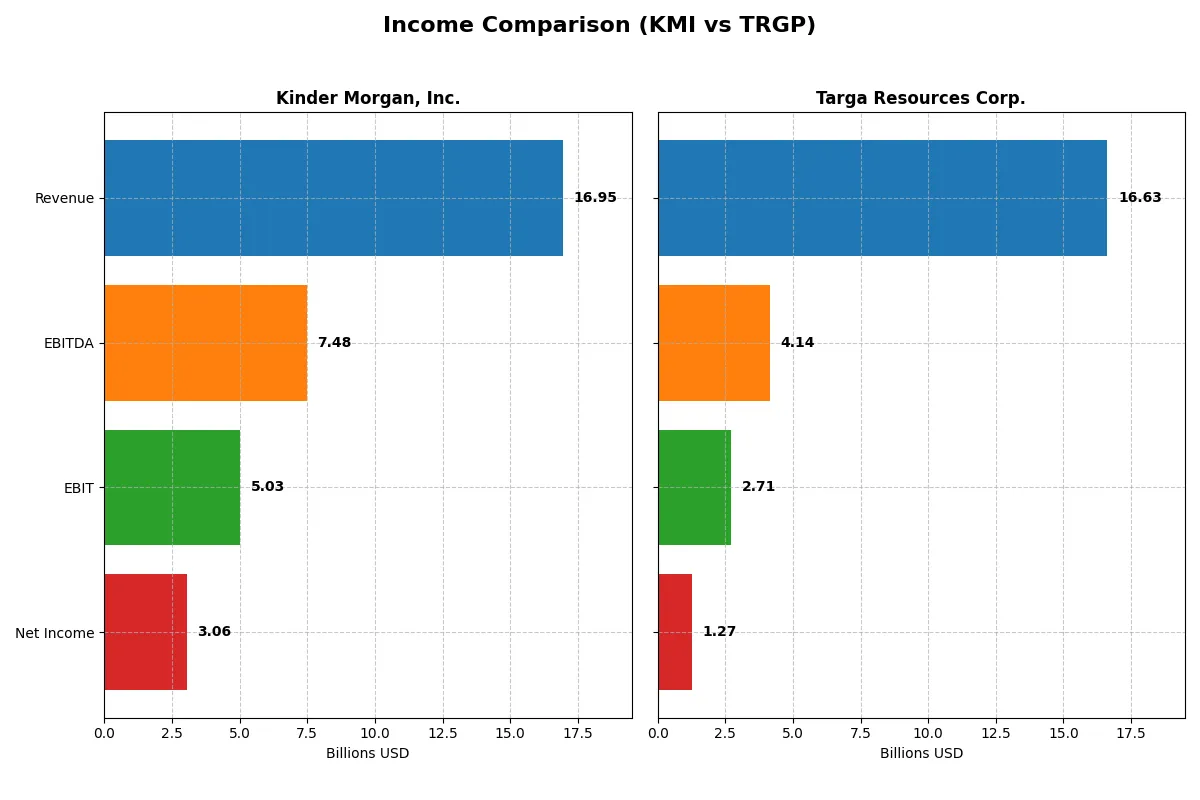
This data dissects the core profitability and scalability of both corporate engines to reveal who dominates the bottom line:
| Metric | Kinder Morgan, Inc. (KMI) | Targa Resources Corp. (TRGP) |
|---|---|---|
| Revenue | 16.95B | 16.63B |
| Cost of Revenue | 9.55B | 13.30B |
| Operating Expenses | 2.59B | 0.38B |
| Gross Profit | 7.40B | 3.33B |
| EBITDA | 7.48B | 4.14B |
| EBIT | 5.03B | 2.71B |
| Interest Expense | 1.80B | 0.77B |
| Net Income | 3.06B | 1.27B |
| EPS | 1.37 | 5.77 |
| Fiscal Year | 2025 | 2024 |
Income Statement Analysis: The Bottom-Line Duel
The income statement comparison reveals which company transforms revenue into profits most efficiently, exposing their operational strength and margin discipline.
Kinder Morgan, Inc. Analysis
Kinder Morgan’s revenue fluctuated slightly but recovered to $16.95B in 2025, growing 12.5% year-over-year. Gross margin stands strong at 43.7%, signaling robust cost control. Net income surged 17% to $3.05B in 2025, with a healthy net margin near 18%, reflecting solid bottom-line momentum despite a modest EBIT dip.
Targa Resources Corp. Analysis
Targa Resources’ revenue rose steadily to $16.63B in 2024, a 6.5% increase over 2023. Gross margin remains moderate at 20%, but EBIT margin at 16.3% shows improving operational leverage. Net income more than doubled over five years to $1.27B, with an impressive 44% net margin growth last year, highlighting accelerating profitability.
Margin Dominance vs. Growth Trajectory
Kinder Morgan commands superior margins and higher absolute net income, showcasing efficiency and scale advantages. Targa impresses with sharper revenue and earnings growth, transforming a smaller base into a rapidly expanding profit machine. Investors seeking margin stability may favor Kinder Morgan; growth-oriented profiles might lean toward Targa’s momentum.
Financial Ratios Comparison
These vital ratios act as a diagnostic tool to expose the underlying fiscal health, valuation premiums, and capital efficiency of the companies compared here:
| Ratios | Kinder Morgan, Inc. (KMI) | Targa Resources Corp. (TRGP) |
|---|---|---|
| ROE | 9.81% | 48.97% |
| ROIC | 5.76% | 11.83% |
| P/E | 20.01 | 30.96 |
| P/B | 1.96 | 15.16 |
| Current Ratio | 0.031 | 0.724 |
| Quick Ratio | 0.031 | 0.618 |
| D/E | 1.02 | 5.50 |
| Debt-to-Assets | 43.74% | 62.75% |
| Interest Coverage | 2.67 | 3.84 |
| Asset Turnover | 0.23 | 0.73 |
| Fixed Asset Turnover | 0.43 | 0.92 |
| Payout ratio | 84.8% | 48.5% |
| Dividend yield | 4.24% | 1.57% |
| Fiscal Year | 2025 | 2024 |
Efficiency & Valuation Duel: The Vital Signs
Financial ratios act as a company’s DNA, exposing hidden risks and revealing operational excellence essential for sound investment choices.
Kinder Morgan, Inc.
Kinder Morgan shows moderate profitability with a 9.8% ROE and an 18% net margin, signaling operational efficiency. Its P/E at 20 and P/B near 2 suggest a fairly valued stock, neither expensive nor cheap. The 4.24% dividend yield rewards shareholders consistently, reflecting a stable income approach rather than aggressive reinvestment.
Targa Resources Corp.
Targa Resources delivers a striking 48.97% ROE but a modest 7.64% net margin, indicating high leverage in profitability. Valuation appears stretched with a P/E near 31 and P/B over 15, hinting at market optimism. The 1.57% dividend yield is low, implying a focus on growth or debt reduction over immediate shareholder returns.
Balanced Stability vs. High Leverage Growth
Kinder Morgan offers a more balanced risk-reward profile with solid dividends and reasonable valuation. Targa Resources excels in return on equity but carries stretched multiples and higher leverage. Conservative investors may prefer Kinder Morgan’s stability, while growth-seekers might lean toward Targa’s aggressive profitability.
Which one offers the Superior Shareholder Reward?
I see Kinder Morgan (KMI) delivers a 4.2% yield with a high 98% payout ratio, signaling a mature, income-focused model. Its buybacks are modest but steady, supporting total returns. Targa Resources (TRGP) yields 1.6% with a 48% payout ratio, favoring reinvestment in growth and acquisitions, though with weaker free cash flow coverage. TRGP’s buybacks are lighter, reflecting its leveraged balance sheet. Historically, KMI’s consistent dividends and disciplined payouts offer a more sustainable reward for income-seeking investors in 2026. I conclude Kinder Morgan provides the superior total shareholder return profile today.
Comparative Score Analysis: The Strategic Profile
The radar chart reveals the fundamental DNA and trade-offs of Kinder Morgan, Inc. and Targa Resources Corp.:
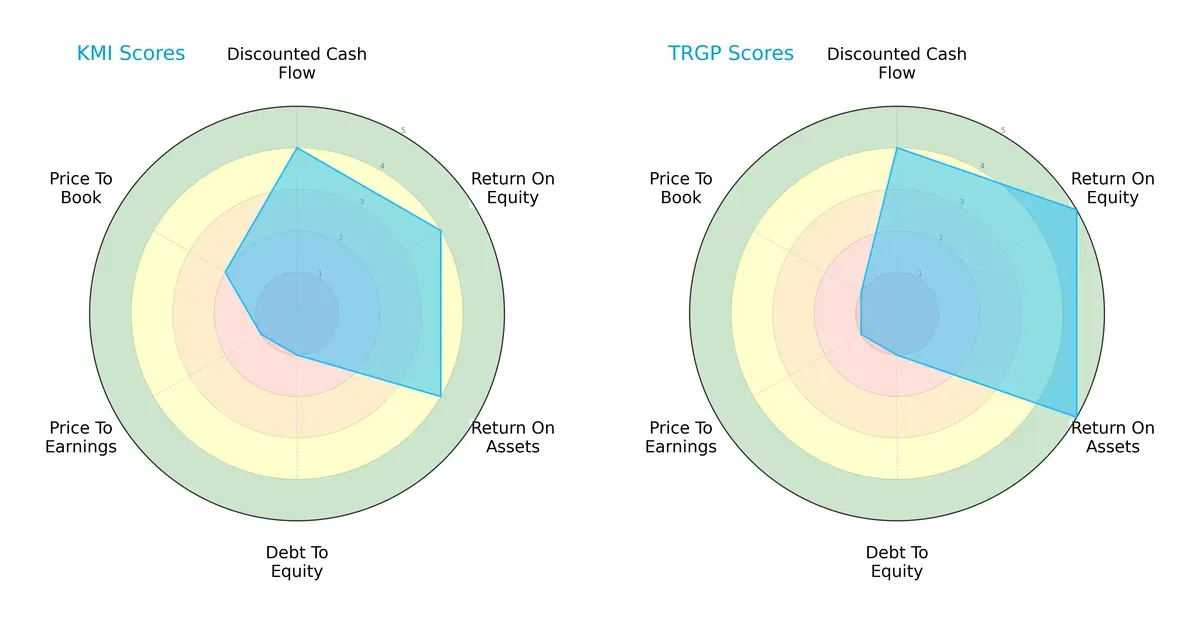
Both firms share a solid DCF score of 4, reflecting favorable cash flow projections. Targa edges Kinder Morgan with superior ROE (5 vs. 4) and ROA (5 vs. 4), signaling more efficient capital and asset utilization. Both struggle equally with debt-to-equity (score 1), indicating high leverage risk. Valuation scores hint at undervaluation concerns; Kinder Morgan fares slightly better on price-to-book (2 vs. 1), but both have poor P/E scores (1). Targa’s profile leans on operational efficiency, while Kinder Morgan shows a more balanced but leveraged stance.
Bankruptcy Risk: Solvency Showdown
The Altman Z-Score difference highlights contrasting bankruptcy risks:
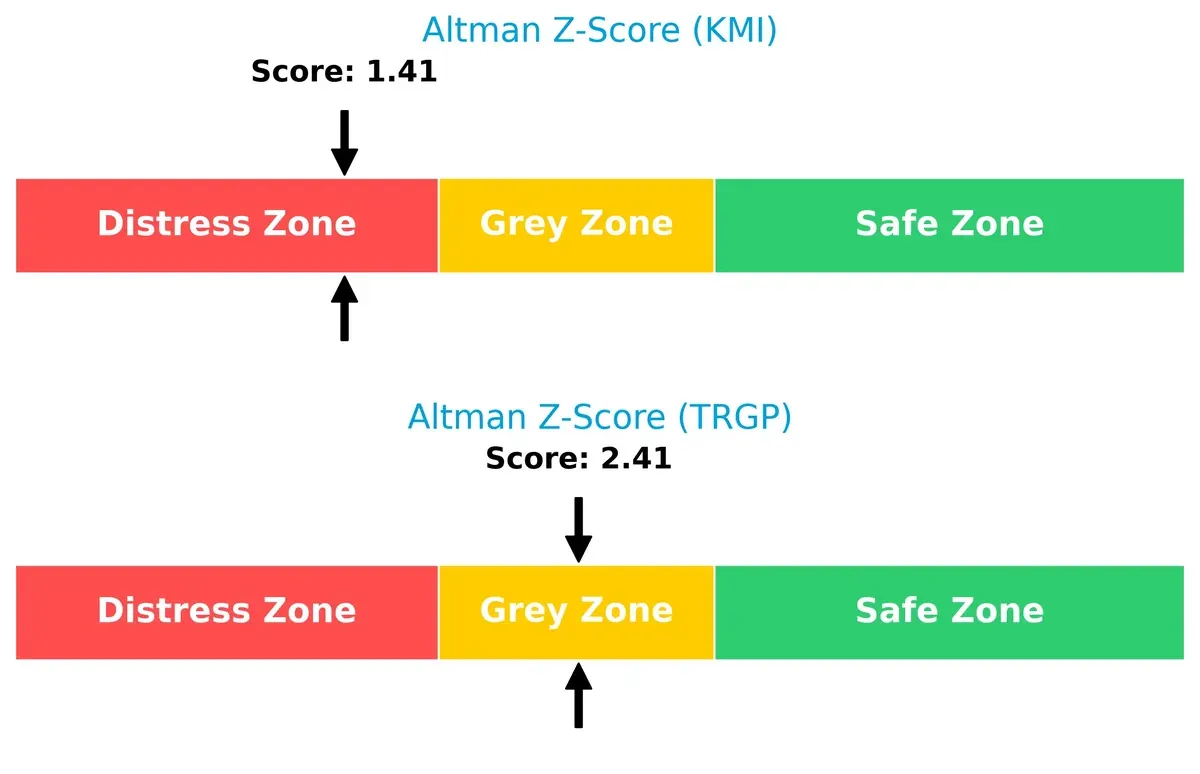
Kinder Morgan’s score (1.41) places it deep in the distress zone, signaling elevated bankruptcy risk. Targa’s 2.41 lies in the grey zone, suggesting moderate survival chances but caution remains vital in this volatile cycle.
Financial Health: Quality of Operations
Piotroski F-Scores reflect internal financial robustness and operational quality:
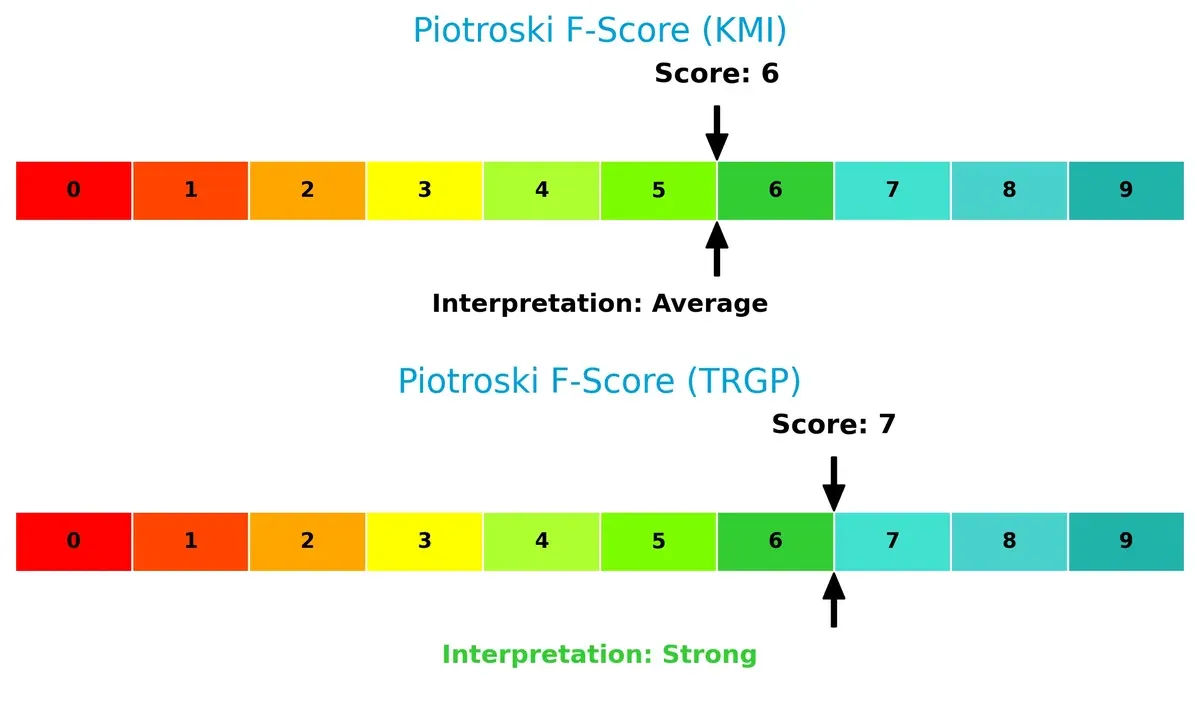
Targa’s score of 7 indicates strong financial health with efficient asset use and profitability. Kinder Morgan’s 6 is average, showing some operational weaknesses. Neither firm hits peak strength, but Kinder Morgan’s lower score flags potential red flags in internal metrics relative to Targa.
How are the two companies positioned?
This section dissects the operational DNA of KMI and TRGP by comparing their revenue distribution by segment and internal dynamics. The goal is to confront their economic moats and identify which model delivers the most resilient, sustainable advantage today.
Revenue Segmentation: The Strategic Mix
This visual comparison dissects how Kinder Morgan, Inc. and Targa Resources Corp. diversify their income streams and where their primary sector bets lie:
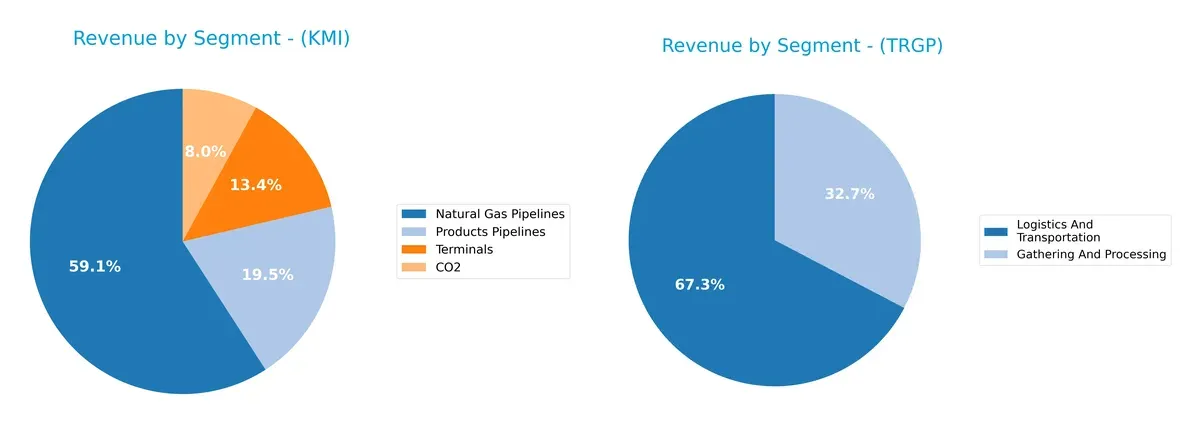
Kinder Morgan anchors its revenue in Natural Gas Pipelines with $8.94B, followed by Products Pipelines at $3B, showing moderate diversification. Targa Resources pivots between Logistics and Transportation at $14B and Gathering and Processing at $6.8B, revealing a more balanced split. Kinder Morgan’s focus suggests infrastructure dominance but concentration risk, while Targa’s mix offers ecosystem lock-in with broader operational exposure.
Strengths and Weaknesses Comparison
This table compares the Strengths and Weaknesses of Kinder Morgan, Inc. (KMI) and Targa Resources Corp. (TRGP):
KMI Strengths
- Diverse revenue streams across Natural Gas Pipelines, Products Pipelines, Terminals, and CO2 segments
- Favorable net margin at 18.03%
- Dividend yield at 4.24% supports income investors
- WACC lower than ROIC, indicating value creation
TRGP Strengths
- Strong return on equity at 48.97% and ROIC at 11.83%
- Favorable WACC at 6.74% supports capital efficiency
- Significant revenue in Logistics & Transportation and Gathering & Processing
- Neutral net margin reflects stable profitability
KMI Weaknesses
- Low current and quick ratios at 0.03 signal liquidity risks
- Debt to equity ratio above 1.0 indicates higher leverage
- Unfavorable asset and fixed asset turnover ratios show efficiency concerns
- ROE underperforms against sector benchmarks
TRGP Weaknesses
- Elevated debt to equity at 5.5 and debt to assets at 62.75% raise solvency concerns
- Unfavorable PE and PB ratios suggest valuation risk
- Current and quick ratios below 1 imply liquidity constraints
- Fixed asset turnover is unfavorable, reflecting asset use inefficiency
Both companies show strengths in capital returns and segment diversity or scale. However, high leverage and liquidity challenges remain notable risks. These factors should be central to each company’s strategic financial management.
The Moat Duel: Analyzing Competitive Defensibility
A structural moat is the only true shield protecting long-term profits from relentless competition erosion. Let’s dissect the moats of two midstream giants:
Kinder Morgan, Inc.: Scale and Network Infrastructure Moat
Kinder Morgan’s moat stems from its vast pipeline network and entrenched infrastructure, enabling stable margins and high gross profits. Yet, declining ROIC signals weakening capital efficiency in 2026, threatening this advantage.
Targa Resources Corp.: Operational Efficiency and Growth Moat
Targa leverages operational scale with growing ROIC and expanding processing assets. Its improving profitability contrasts with Kinder Morgan’s decline, while new market expansions could deepen its competitive edge.
Infrastructure Scale vs. Operational Dynamism
Targa Resources holds a deeper, more durable moat, demonstrated by rising ROIC and robust earnings growth. Kinder Morgan’s scale is impressive but weakened by value destruction, making Targa better positioned to defend market share in 2026.
Which stock offers better returns?
Over the past 12 months, both Kinder Morgan, Inc. and Targa Resources Corp. demonstrated strong upward price movements with accelerating bullish trends, reflecting robust trading dynamics despite declining volume levels.
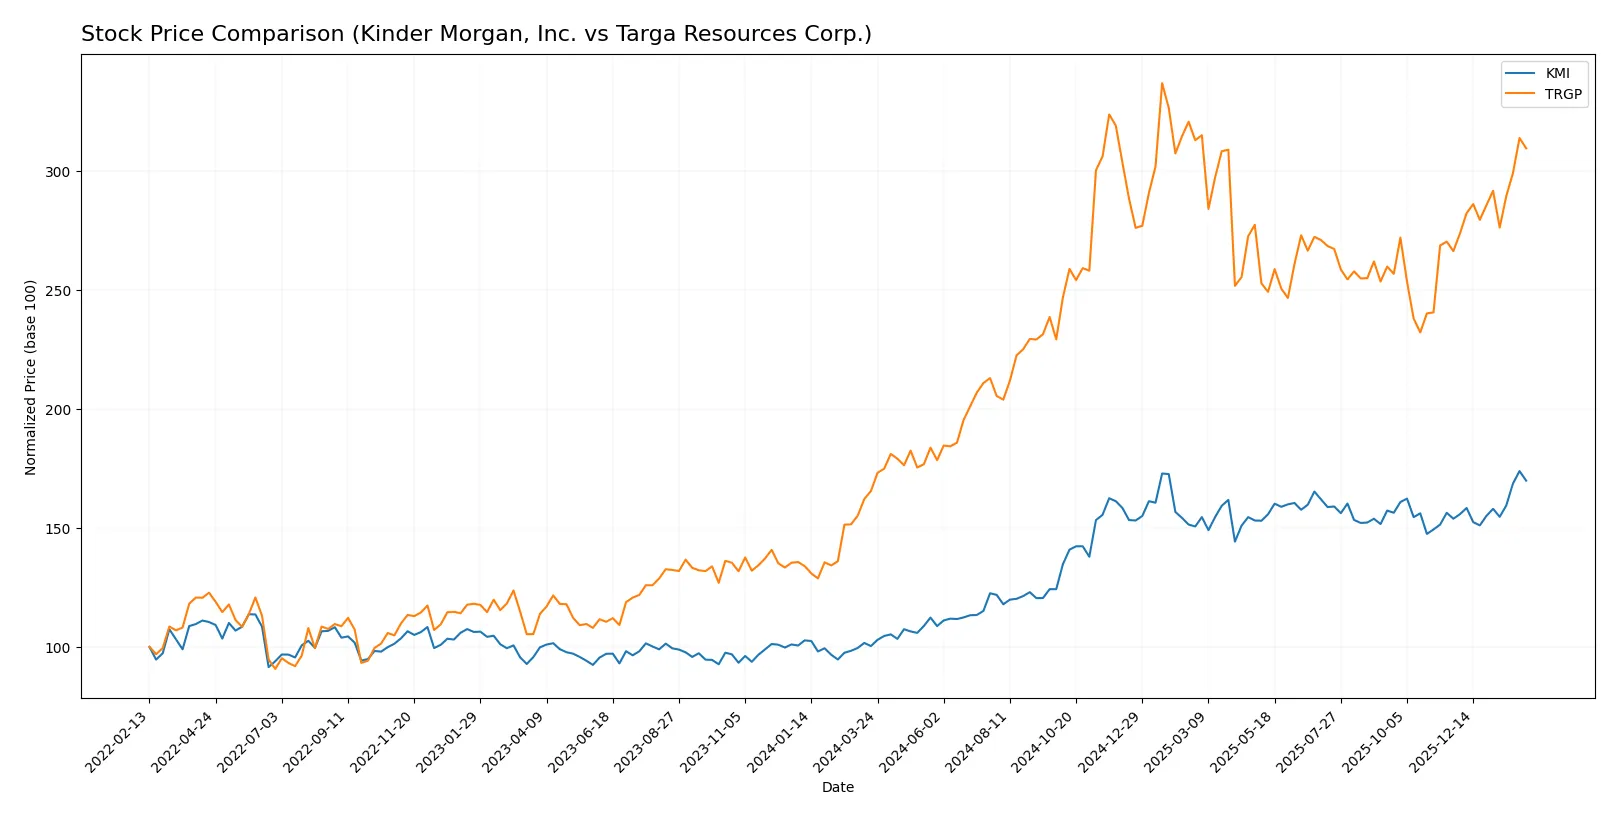
Trend Comparison
Kinder Morgan, Inc. recorded a 69.23% price increase over the last year, exhibiting a bullish trend with accelerating momentum and moderate volatility (3.6 std deviation). The stock ranged from $17.6 to $30.49.
Targa Resources Corp. posted an 87.03% price gain in the same period, also bullish with acceleration. It showed significantly higher volatility (27.52 std deviation) and ranged from $105.97 to $215.72.
Targa Resources Corp. outperformed Kinder Morgan, Inc., delivering the highest market performance and stronger recent upward momentum.
Target Prices
Analysts present a bullish consensus for Kinder Morgan, Inc. and Targa Resources Corp., signaling potential upside from current prices.
| Company | Target Low | Target High | Consensus |
|---|---|---|---|
| Kinder Morgan, Inc. | 30 | 38 | 34.33 |
| Targa Resources Corp. | 196 | 266 | 219.88 |
Kinder Morgan’s consensus target of 34.33 implies a 15% upside from its 29.78 price, while Targa Resources’ 219.88 target suggests a 10.8% gain from 198.41. Both reflect positive analyst expectations in the midstream energy sector.

Don’t Let Luck Decide Your Entry Point
Optimize your entry points with our advanced ProRealTime indicators. You’ll get efficient buy signals with precise price targets for maximum performance. Start outperforming now!
How do institutions grade them?
The grades assigned by major financial institutions to Kinder Morgan, Inc. and Targa Resources Corp. are as follows:
Kinder Morgan, Inc. Grades
The following table summarizes recent analyst grades for Kinder Morgan, Inc.:
| Grading Company | Action | New Grade | Date |
|---|---|---|---|
| Scotiabank | maintain | Sector Perform | 2026-01-23 |
| Jefferies | maintain | Hold | 2026-01-22 |
| TD Cowen | maintain | Buy | 2026-01-22 |
| Jefferies | maintain | Hold | 2025-12-23 |
| Mizuho | maintain | Outperform | 2025-11-14 |
| RBC Capital | maintain | Sector Perform | 2025-11-13 |
| Stifel | maintain | Hold | 2025-11-11 |
| Morgan Stanley | maintain | Equal Weight | 2025-10-01 |
| Scotiabank | maintain | Sector Perform | 2025-09-19 |
| Stifel | maintain | Hold | 2025-08-14 |
Targa Resources Corp. Grades
The following table summarizes recent analyst grades for Targa Resources Corp.:
| Grading Company | Action | New Grade | Date |
|---|---|---|---|
| Wells Fargo | maintain | Overweight | 2025-12-18 |
| Scotiabank | maintain | Sector Outperform | 2025-12-17 |
| RBC Capital | maintain | Outperform | 2025-12-03 |
| RBC Capital | maintain | Outperform | 2025-11-18 |
| Goldman Sachs | maintain | Buy | 2025-11-13 |
| Scotiabank | maintain | Sector Outperform | 2025-11-13 |
| Morgan Stanley | maintain | Overweight | 2025-11-12 |
| BMO Capital | maintain | Outperform | 2025-11-06 |
| JP Morgan | maintain | Overweight | 2025-10-07 |
| Mizuho | maintain | Outperform | 2025-08-29 |
Which company has the best grades?
Targa Resources Corp. consistently receives higher grades, including multiple Outperform and Overweight ratings. Kinder Morgan holds more conservative ratings, such as Hold and Sector Perform. Higher grades for Targa suggest stronger analyst confidence, potentially influencing investor sentiment positively.
Risks specific to each company
The following categories identify critical pressure points and systemic threats facing Kinder Morgan, Inc. and Targa Resources Corp. in the 2026 market environment:
1. Market & Competition
Kinder Morgan, Inc.
- Operates a vast pipeline network with strong market presence but faces intense competition in midstream energy.
Targa Resources Corp.
- Smaller scale than KMI, with concentrated operations and competitive pressures in Gulf Coast logistics and processing.
2. Capital Structure & Debt
Kinder Morgan, Inc.
- Debt-to-equity at 1.02 signals high leverage; interest coverage moderate at 2.79, raising financial risk concerns.
Targa Resources Corp.
- Heavily leveraged with debt-to-equity of 5.5, interest coverage slightly better at 3.53 but elevated debt burden is a red flag.
3. Stock Volatility
Kinder Morgan, Inc.
- Beta of 0.686 indicates lower volatility and relative defensive positioning in energy midstream.
Targa Resources Corp.
- Beta of 0.874 shows higher volatility, reflecting greater sensitivity to market swings and operational risk.
4. Regulatory & Legal
Kinder Morgan, Inc.
- Subject to stringent environmental and pipeline safety regulations; regulatory changes pose operational risks.
Targa Resources Corp.
- Exposure to complex regulatory environment in energy logistics and processing, with potential compliance costs.
5. Supply Chain & Operations
Kinder Morgan, Inc.
- Extensive pipeline and terminal assets provide operational scale but require costly maintenance and risk disruptions.
Targa Resources Corp.
- Operational footprint smaller but diversified in gathering, processing, and transportation, with supply chain complexities.
6. ESG & Climate Transition
Kinder Morgan, Inc.
- Faces pressure to reduce carbon footprint; CO2 segment offers some diversification but transition risks remain substantial.
Targa Resources Corp.
- ESG initiatives ongoing but fossil fuel reliance and regulatory risks challenge long-term sustainability transition.
7. Geopolitical Exposure
Kinder Morgan, Inc.
- Primarily North America focused, limiting geopolitical risks but vulnerable to US energy policy shifts.
Targa Resources Corp.
- Also North America centric; geopolitical exposure mostly tied to domestic energy regulation and trade policies.
Which company shows a better risk-adjusted profile?
Kinder Morgan’s primary risk lies in its leveraged capital structure and weak liquidity ratios, placing it in the distress zone for bankruptcy risk. Targa Resources, while also heavily leveraged, demonstrates stronger operational returns and a better Altman Z-score in the grey zone. Both firms display slightly unfavorable financial ratios, but Targa’s superior returns on equity and assets, coupled with a stronger Piotroski score, indicate a marginally better risk-adjusted profile despite higher market volatility. The critical concern for KMI is its dangerously low current and quick ratios at 0.03, signaling liquidity stress. Meanwhile, TRGP’s high debt-to-equity ratio of 5.5 emphasizes financial risk but is somewhat offset by robust profitability and cash flow metrics.
Final Verdict: Which stock to choose?
Kinder Morgan’s superpower lies in its steady income generation and attractive dividend yield, appealing to investors seeking reliable cash flow. However, its declining return on invested capital and weak liquidity ratios remain points of vigilance. It fits portfolios targeting income and moderate risk tolerance.
Targa Resources stands out with a robust strategic moat driven by its growing ROIC and exceptional return on equity. Despite higher leverage and valuation multiples, it offers better earnings growth and durability. It suits investors focused on growth with a tolerance for volatility.
If you prioritize stable income and dividend reliability, Kinder Morgan appears compelling due to its consistent cash flow and market presence. However, if you seek growth backed by a durable competitive advantage and rising profitability, Targa Resources outshines with its expanding returns and strategic execution. Each represents a distinct analytical scenario tailored to different investor profiles.
Disclaimer: Investment carries a risk of loss of initial capital. The past performance is not a reliable indicator of future results. Be sure to understand risks before making an investment decision.
Go Further
I encourage you to read the complete analyses of Kinder Morgan, Inc. and Targa Resources Corp. to enhance your investment decisions: