Home > Comparison > Energy > KMI vs OKE
The strategic rivalry between Kinder Morgan, Inc. and ONEOK, Inc. shapes the midstream energy sector’s evolution. Kinder Morgan operates a vast, diversified pipeline and terminal network, while ONEOK focuses on natural gas gathering and liquids processing with regional specialization. This analysis contrasts their capital allocation and operational focus to determine which offers superior risk-adjusted returns for diversified portfolios amid shifting energy market dynamics.
Table of contents
Companies Overview
Kinder Morgan and ONEOK dominate the North American midstream oil and gas infrastructure sector.
Kinder Morgan, Inc.: Energy Infrastructure Powerhouse
Kinder Morgan stands as a leading energy infrastructure company in North America. It generates revenue primarily through ownership and operation of extensive natural gas and products pipelines, terminals, and CO2 transport systems. In 2026, the company focuses strategically on expanding its pipeline network and enhancing terminal operations to support energy transition and reliability.
ONEOK, Inc.: Natural Gas Midstream Specialist
ONEOK specializes in natural gas gathering, processing, and liquids transportation across key US regions. Its revenue base derives from natural gas pipelines, NGL fractionation, storage, and distribution. The 2026 strategy emphasizes optimizing its NGL assets and expanding interstate pipeline capacity to improve operational efficiency and market reach.
Strategic Collision: Similarities & Divergences
Both companies operate in the oil and gas midstream sector but differ in scale and asset breadth. Kinder Morgan pursues a diversified pipeline and terminal portfolio, while ONEOK targets focused natural gas liquids infrastructure. Their primary battleground lies in pipeline network expansion and terminal capacity. Investors face distinct profiles: Kinder Morgan offers broad infrastructure exposure, ONEOK leans toward specialized natural gas midstream growth.
Income Statement Comparison
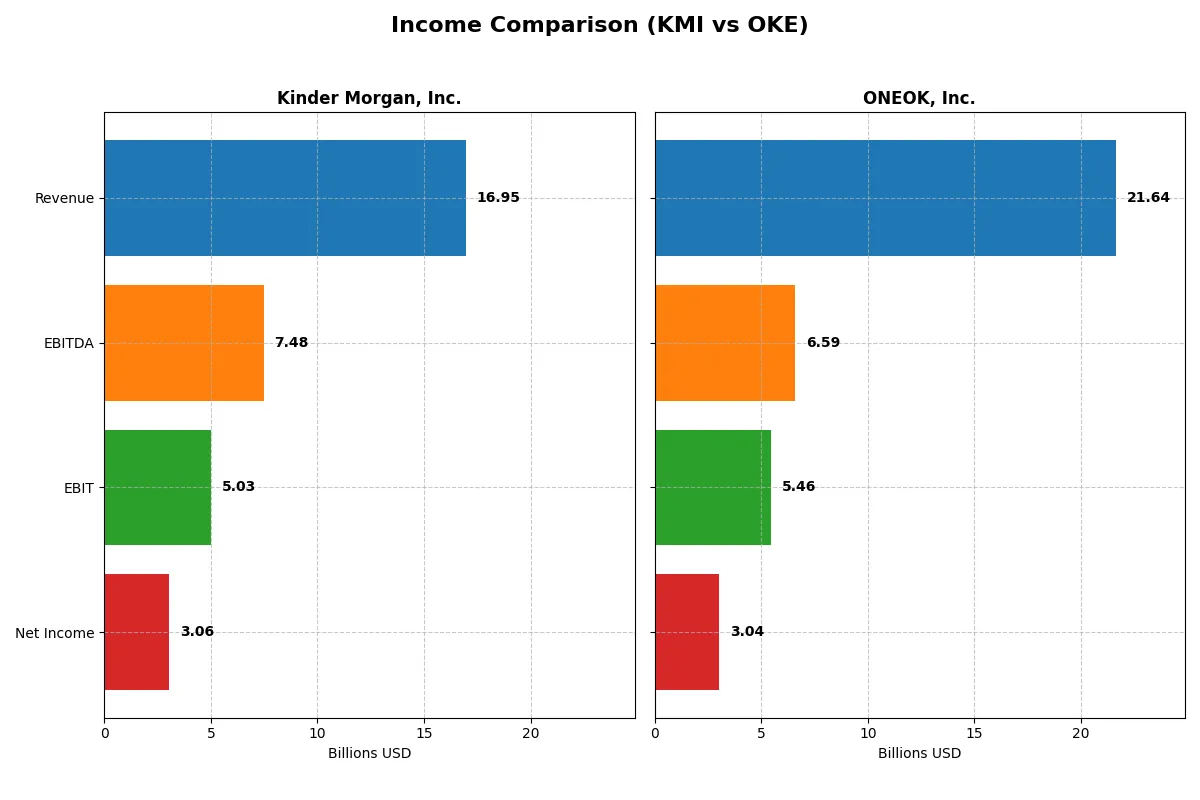
This data dissects the core profitability and scalability of both corporate engines to reveal who dominates the bottom line:
| Metric | Kinder Morgan, Inc. (KMI) | ONEOK, Inc. (OKE) |
|---|---|---|
| Revenue | 16.95B | 21.64B |
| Cost of Revenue | 9.55B | 16.59B |
| Operating Expenses | 2.59B | 29M |
| Gross Profit | 7.40B | 5.05B |
| EBITDA | 7.48B | 6.60B |
| EBIT | 5.03B | 5.46B |
| Interest Expense | 1.80B | 1.35B |
| Net Income | 3.06B | 3.04B |
| EPS | 1.37 | 5.19 |
| Fiscal Year | 2025 | 2024 |
Income Statement Analysis: The Bottom-Line Duel
This income statement comparison uncovers which company operates its business with greater efficiency and profitability.
Kinder Morgan, Inc. Analysis
Kinder Morgan’s revenue grew steadily to 16.95B in 2025, with net income rising to 3.05B, reflecting strong bottom-line momentum. Its gross margin expanded favorably to 43.7%, and net margin held at a healthy 18%, signaling robust profitability. Despite a slight EBIT dip, Kinder Morgan sustains solid operating efficiency amid rising interest expenses.
ONEOK, Inc. Analysis
ONEOK posted a revenue surge of 21.64B in 2024, up 22%, with net income at 3.03B, driven by strong operational leverage. Gross margin sits lower at 23.3%, but EBIT margin remains respectable at 25.2%. ONEOK’s growth momentum is evident in a 26% EBIT increase, though net margin contracted slightly, indicating margin pressure despite top-line gains.
Margin Strength vs. Revenue Growth Momentum
Kinder Morgan delivers superior margins and consistent net income growth, underpinning its efficient capital deployment. ONEOK boasts higher revenue growth and EBIT expansion but faces margin compression risks. For investors prioritizing margin quality and stable profitability, Kinder Morgan’s profile appears more attractive, while ONEOK suits those focused on growth acceleration.
Financial Ratios Comparison
These vital ratios act as a diagnostic tool to expose the underlying fiscal health, valuation premiums, and capital efficiency of these companies:
| Ratios | Kinder Morgan, Inc. (KMI) | ONEOK, Inc. (OKE) |
|---|---|---|
| ROE | 9.81% | 17.82% |
| ROIC | 5.76% | 6.29% |
| P/E | 20.0 | 19.4 |
| P/B | 1.96 | 3.46 |
| Current Ratio | 0.03 | 0.90 |
| Quick Ratio | 0.03 | 0.74 |
| D/E | 1.02 | 1.90 |
| Debt-to-Assets | 43.7% | 50.4% |
| Interest Coverage | 2.67 | 3.72 |
| Asset Turnover | 0.23 | 0.34 |
| Fixed Asset Turnover | 0.43 | 0.47 |
| Payout Ratio | 84.8% | 76.2% |
| Dividend Yield | 4.24% | 3.93% |
| Fiscal Year | 2025 | 2024 |
Efficiency & Valuation Duel: The Vital Signs
Financial ratios serve as a company’s DNA, exposing hidden risks and operational strengths that numbers alone cannot reveal.
Kinder Morgan, Inc.
Kinder Morgan shows a modest ROE of 9.8% with favorable net margins at 18%, signaling reasonable profitability. The P/E ratio stands neutral at 20x, suggesting a fairly valued stock. Dividend yield at 4.24% supports steady shareholder returns, reflecting a commitment to income over aggressive reinvestment.
ONEOK, Inc.
ONEOK delivers a robust 17.8% ROE, indicating strong profitability, despite a lower net margin of 14%. Its P/E ratio is neutral at 19.4x but is stretched with a high PB of 3.46. The 3.93% dividend yield provides solid income, balancing moderate reinvestment with shareholder distributions.
Balanced Yield Meets Profitability Tension
Both companies face slightly unfavorable overall ratios, but Kinder Morgan offers more conservative valuation and higher dividend yield. ONEOK boasts superior profitability but carries higher leverage and valuation risks. Income-focused investors may prefer Kinder Morgan, while growth-oriented profiles might lean toward ONEOK’s returns.
Which one offers the Superior Shareholder Reward?
Kinder Morgan (KMI) and ONEOK (OKE) both prioritize shareholder distributions but differ in approach. KMI yields roughly 4.2% with an 85% payout ratio and moderate buybacks. OKE offers around 3.9% yield, a lower 76% payout, but stronger buyback programs. KMI’s high payout ratio strains free cash flow, risking sustainability. OKE reinvests more in buybacks, enhancing long-term value. Historically, companies blending dividends with buybacks outperform peers. I find OKE’s balanced distribution and buyback intensity deliver a more attractive total return profile in 2026.
Comparative Score Analysis: The Strategic Profile
The radar chart reveals the fundamental DNA and trade-offs of both Kinder Morgan, Inc. and ONEOK, Inc., highlighting their financial strengths and vulnerabilities:
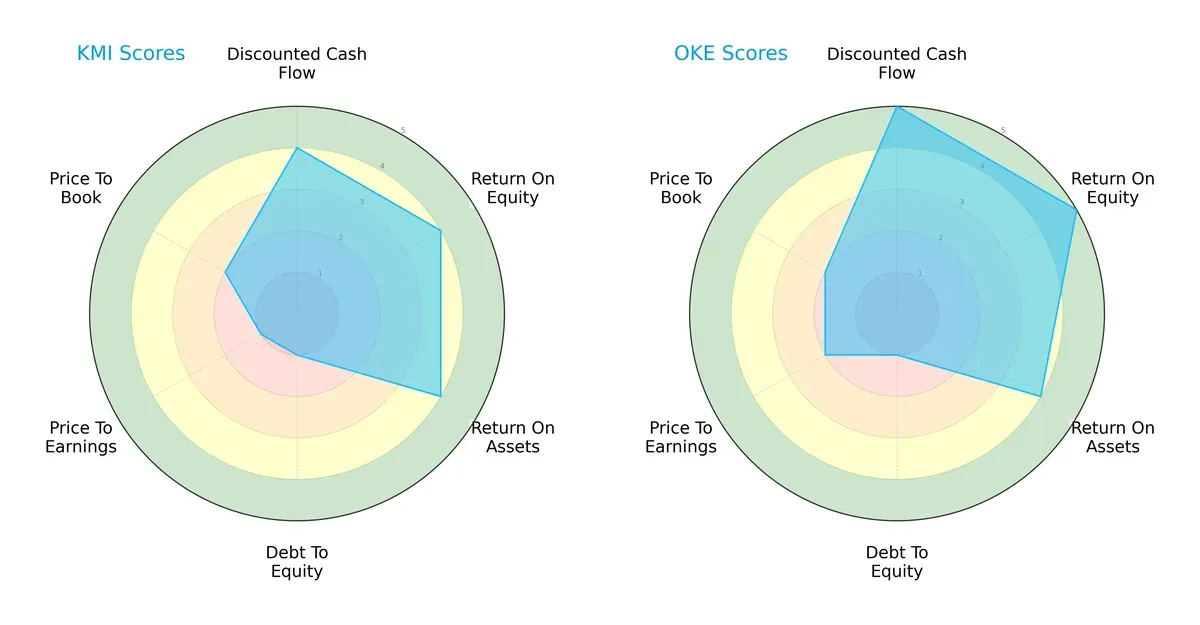
ONEOK edges Kinder Morgan with a superior DCF score (5 vs. 4) and higher returns on equity (5 vs. 4), indicating more efficient capital use. Both firms share strong asset returns (4) but suffer from a very unfavorable debt-to-equity score (1), signaling elevated leverage risk. Valuation metrics favor ONEOK slightly (P/E 2 vs. 1; P/B 2 vs. 2), suggesting Kinder Morgan’s stock may be undervalued but also riskier. Overall, ONEOK presents a more balanced profile, while Kinder Morgan leans on discounted cash flow and efficiency gains despite financial leverage concerns.
Bankruptcy Risk: Solvency Showdown
The Altman Z-Scores for Kinder Morgan (1.41) and ONEOK (1.48) place both firms in the distress zone, signaling elevated bankruptcy risk during this cycle:
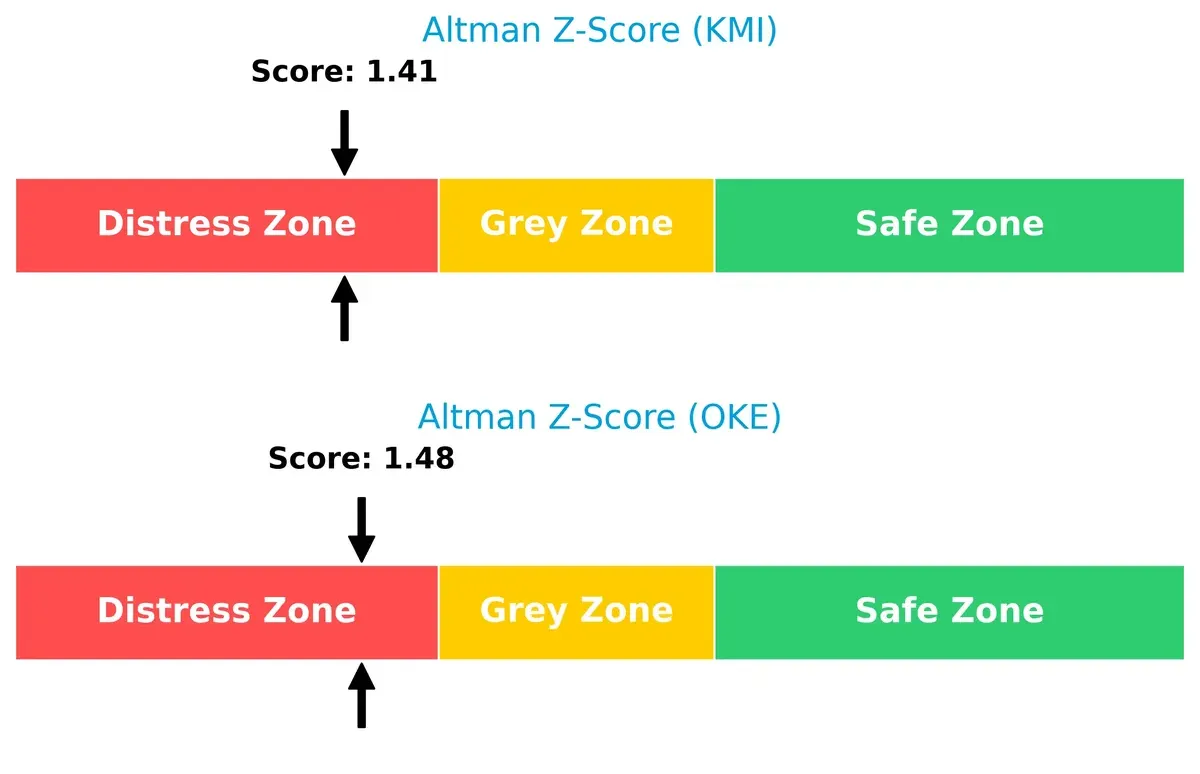
Both companies face high financial distress risk, reflecting sector-wide pressure from leverage and market volatility. Investors should monitor balance sheet improvements closely.
Financial Health: Quality of Operations
Kinder Morgan and ONEOK both score 6 on the Piotroski F-Score, indicating average financial health without glaring red flags in operations:
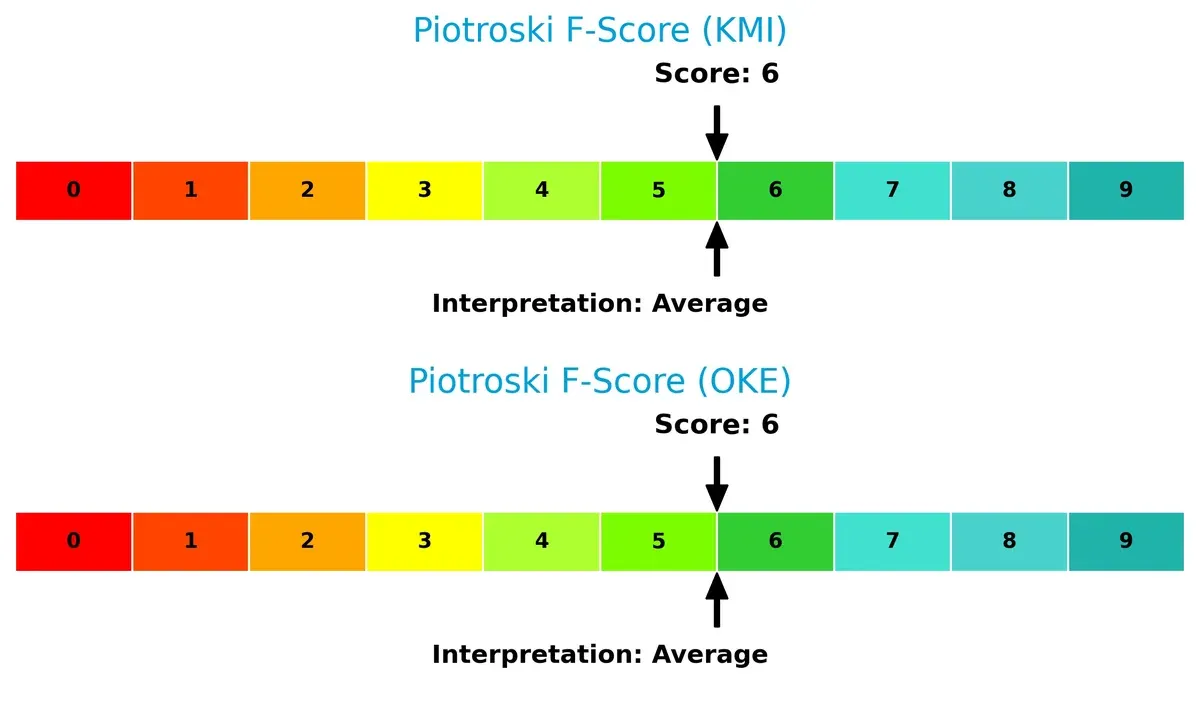
These scores reflect decent profitability and liquidity, but neither company demonstrates peak financial strength. Investors must weigh these neutral operational metrics against their leverage risks.
How are the two companies positioned?
This section dissects the operational DNA of KMI and OKE by comparing their revenue distribution by segment and internal dynamics, including strengths and weaknesses. The final objective confronts their economic moats to identify which business model offers the most resilient and sustainable competitive advantage in today’s market.
Revenue Segmentation: The Strategic Mix
This comparison dissects how Kinder Morgan and ONEOK diversify their income streams and where their primary sector bets lie:
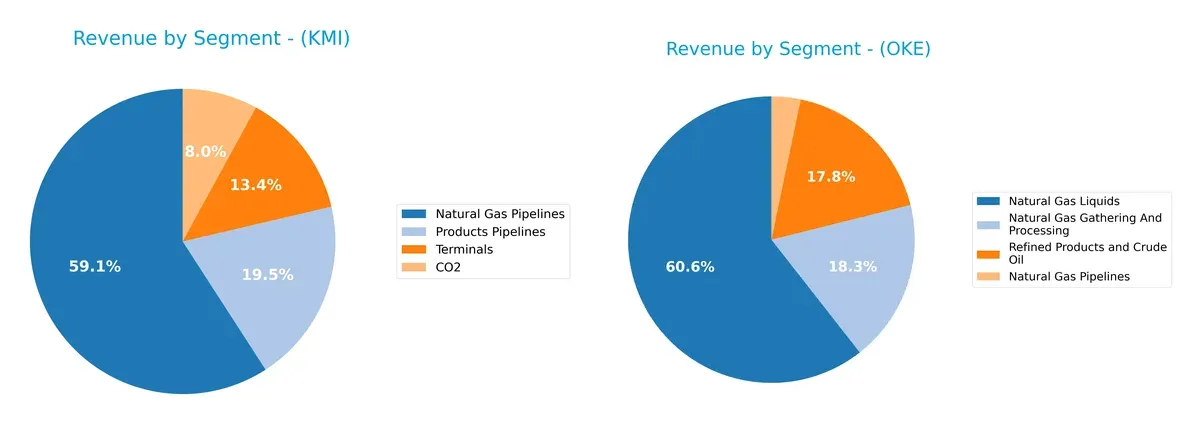
Kinder Morgan anchors its revenue with $8.9B from Natural Gas Pipelines, supported by $3B in Products Pipelines and $2B in Terminals, showing a balanced infrastructure portfolio. ONEOK pivots heavily on Natural Gas Liquids at $15.2B, dwarfing its $4.6B in Refined Products and $4.6B in Gathering and Processing. Kinder Morgan’s diversified pipeline ecosystem reduces concentration risk, while ONEOK’s reliance on a dominant segment signals higher exposure but strong niche dominance.
Strengths and Weaknesses Comparison
This table compares the Strengths and Weaknesses of Kinder Morgan, Inc. (KMI) and ONEOK, Inc. (OKE):
KMI Strengths
- Higher net margin at 18.03%
- Favorable WACC at 6.16%
- Strong dividend yield of 4.24%
- Diverse revenue streams from natural gas pipelines, products pipelines, terminals, and CO2 segments
- Significant U.S. market presence
OKE Strengths
- Higher ROE at 17.82%
- Favorable net margin at 14.03%
- Favorable WACC at 6.05%
- Largest revenue from natural gas liquids with substantial natural gas gathering and processing
- Growing total segment revenues over time
KMI Weaknesses
- Low current and quick ratios at 0.03 indicate liquidity concerns
- Unfavorable debt-to-equity at 1.02
- Asset turnover ratios below industry norms
- ROE below WACC at 9.81%
- Higher percentage of unfavorable financial ratios (42.86%)
OKE Weaknesses
- Unfavorable debt-to-equity ratio at 1.9
- Higher debt-to-assets at 50.4%
- Unfavorable price-to-book at 3.46
- Low liquidity ratios below 1.0
- Asset turnover ratios also weak
- Half of financial ratios unfavorable (50.0%)
Both companies display diversified operations and strong market presence in natural gas sectors but face liquidity and efficiency challenges. KMI’s stronger dividend yield contrasts with OKE’s superior return on equity. Each company’s financial structure suggests differing risk profiles that impact strategic options.
The Moat Duel: Analyzing Competitive Defensibility
A structural moat shields long-term profits from relentless competitive pressures and market shifts. Here’s how Kinder Morgan and ONEOK defend their turf:
Kinder Morgan, Inc. (KMI): Scale and Infrastructure Moat
Kinder Morgan leverages an extensive pipeline network and terminal assets creating high barriers to entry. Its stable margins and 18% net margin reflect this advantage. However, declining ROIC warns of eroding efficiency as market dynamics shift in 2026.
ONEOK, Inc. (OKE): Focused Operational Efficiency Moat
ONEOK’s moat centers on operational efficiency and regional natural gas infrastructure, contrasting KMI’s scale. It delivers solid revenue growth and improving net income, yet diminishing ROIC suggests challenges sustaining excess returns in coming years.
Verdict: Infrastructure Scale vs. Operational Efficiency
Kinder Morgan’s broader asset base creates a wider moat, but its worsening ROIC signals strategic strain. ONEOK’s leaner model yields higher growth but a narrower moat. Overall, Kinder Morgan remains better positioned to defend market share despite emerging risks.
Which stock offers better returns?
The past year shows Kinder Morgan rising sharply with accelerating gains, while ONEOK’s price hovered flat overall despite recent upward momentum.
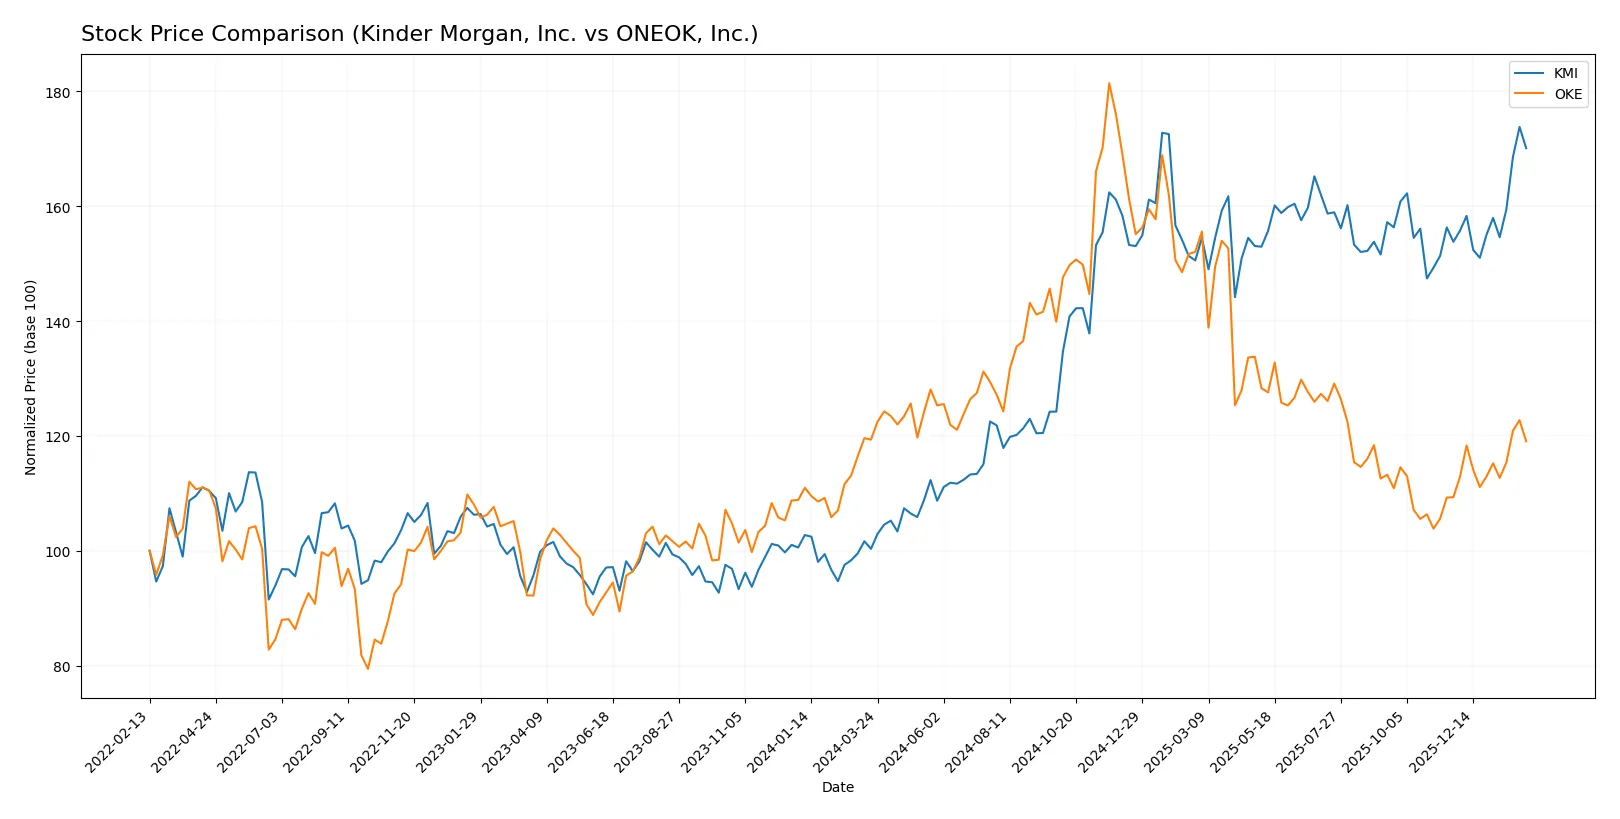
Trend Comparison
Kinder Morgan, Inc. (KMI) posted a strong 69.55% gain over the last 12 months, signaling a bullish trend with accelerating price growth and moderate volatility (3.6 std deviation).
ONEOK, Inc. (OKE) recorded a slight 0.23% decline over the same period, indicating a bearish trend despite recent positive momentum and higher volatility (11.43 std deviation).
KMI outperformed OKE clearly, delivering the highest market returns with sustained acceleration, while OKE’s performance remained nearly flat over the year.
Target Prices
Analysts set clear upside potential for Kinder Morgan and ONEOK based on current consensus targets.
| Company | Target Low | Target High | Consensus |
|---|---|---|---|
| Kinder Morgan, Inc. | 30 | 38 | 34.33 |
| ONEOK, Inc. | 72 | 104 | 86.6 |
The consensus target for Kinder Morgan exceeds its $29.77 stock price, signaling moderate upside. ONEOK’s consensus target of $86.6 is notably above its $76.24 price, suggesting stronger expected gains.

Don’t Let Luck Decide Your Entry Point
Optimize your entry points with our advanced ProRealTime indicators. You’ll get efficient buy signals with precise price targets for maximum performance. Start outperforming now!
How do institutions grade them?
The following summarizes the latest institutional grades for Kinder Morgan, Inc. and ONEOK, Inc.:
Kinder Morgan, Inc. Grades
This table lists recent institutional grades for Kinder Morgan, Inc.:
| Grading Company | Action | New Grade | Date |
|---|---|---|---|
| Scotiabank | maintain | Sector Perform | 2026-01-23 |
| Jefferies | maintain | Hold | 2026-01-22 |
| TD Cowen | maintain | Buy | 2026-01-22 |
| Jefferies | maintain | Hold | 2025-12-23 |
| Mizuho | maintain | Outperform | 2025-11-14 |
| RBC Capital | maintain | Sector Perform | 2025-11-13 |
| Stifel | maintain | Hold | 2025-11-11 |
| Morgan Stanley | maintain | Equal Weight | 2025-10-01 |
| Scotiabank | maintain | Sector Perform | 2025-09-19 |
| Stifel | maintain | Hold | 2025-08-14 |
ONEOK, Inc. Grades
This table includes recent institutional grades for ONEOK, Inc.:
| Grading Company | Action | New Grade | Date |
|---|---|---|---|
| JP Morgan | downgrade | Neutral | 2026-01-27 |
| UBS | maintain | Buy | 2026-01-22 |
| Barclays | maintain | Equal Weight | 2026-01-15 |
| Scotiabank | maintain | Sector Outperform | 2025-11-04 |
| Citigroup | maintain | Buy | 2025-10-31 |
| TD Cowen | maintain | Hold | 2025-10-30 |
| Wells Fargo | maintain | Equal Weight | 2025-10-30 |
| Raymond James | maintain | Outperform | 2025-10-24 |
| Barclays | maintain | Equal Weight | 2025-10-09 |
| Mizuho | maintain | Neutral | 2025-08-29 |
Which company has the best grades?
ONEOK, Inc. holds a slight edge with multiple Buy and Outperform ratings, despite a recent downgrade. Kinder Morgan, Inc. mainly receives Sector Perform and Hold grades, with fewer Buy ratings. This may influence investor sentiment and portfolio positioning.
Risks specific to each company
The following categories identify the critical pressure points and systemic threats facing both firms in the 2026 market environment:
1. Market & Competition
Kinder Morgan, Inc. (KMI)
- Operates a massive pipeline network but faces pressure from energy transition and competition in natural gas infrastructure.
ONEOK, Inc. (OKE)
- Focuses on natural gas liquids and gathering, exposed to regional competition and evolving energy demand.
2. Capital Structure & Debt
Kinder Morgan, Inc. (KMI)
- Debt-to-equity ratio of 1.02 is unfavorable, indicating high leverage and increased financial risk.
ONEOK, Inc. (OKE)
- Even higher debt-to-equity at 1.9, signaling elevated financial risk and weaker balance sheet stability.
3. Stock Volatility
Kinder Morgan, Inc. (KMI)
- Beta of 0.686 indicates lower volatility than the market, offering relative price stability.
ONEOK, Inc. (OKE)
- Beta of 0.918 reflects moderate volatility, closer to market swings and higher risk.
4. Regulatory & Legal
Kinder Morgan, Inc. (KMI)
- Subject to stringent pipeline safety and environmental regulations; regulatory shifts could increase compliance costs.
ONEOK, Inc. (OKE)
- Faces similar regulatory risks with natural gas and NGL pipeline operations, sensitive to policy changes.
5. Supply Chain & Operations
Kinder Morgan, Inc. (KMI)
- Large, diversified asset base (83,000 miles pipelines) improves operational resilience but complexity adds risk.
ONEOK, Inc. (OKE)
- Smaller footprint with 17,500 miles of gathering pipelines, potentially more vulnerable to regional disruptions.
6. ESG & Climate Transition
Kinder Morgan, Inc. (KMI)
- Exposure to fossil fuels and CO2 operations creates transition risk amid tightening climate policy.
ONEOK, Inc. (OKE)
- Similar fossil fuel exposure, but higher reliance on NGLs may face additional scrutiny from ESG investors.
7. Geopolitical Exposure
Kinder Morgan, Inc. (KMI)
- Operations concentrated in the US, limiting geopolitical risk but sensitive to domestic energy policy shifts.
ONEOK, Inc. (OKE)
- Also US-focused, reducing international geopolitical risk but exposed to regional energy market fluctuations.
Which company shows a better risk-adjusted profile?
Kinder Morgan’s critical risk lies in its high leverage and low liquidity ratios, raising financial distress concerns. ONEOK’s most impactful risk is even higher leverage combined with weaker debt metrics. Both are in the distress zone per Altman Z-Scores. However, Kinder Morgan’s lower beta and broader asset diversification provide slightly more stability. Recent data shows Kinder Morgan’s current ratio at a precarious 0.03, a red flag for liquidity risk. Overall, Kinder Morgan presents a marginally better risk-adjusted profile but both require caution due to leverage and liquidity vulnerabilities.
Final Verdict: Which stock to choose?
Kinder Morgan, Inc. (KMI) shines as a cash-generating powerhouse with strong income statement resilience and a compelling dividend yield. However, its declining ROIC and stretched liquidity ratios signal a point of vigilance. KMI might suit investors seeking aggressive income-driven growth with tolerance for operational risks.
ONEOK, Inc. (OKE) boasts a strategic moat rooted in superior return on equity and steady capital efficiency. While its balance sheet carries higher leverage, it offers comparatively better stability than KMI. OKE could appeal to GARP investors aiming for a blend of growth potential and relative financial safety.
If you prioritize consistent income generation and are comfortable with some operational leverage, KMI presents a compelling scenario due to its robust cash flow profile. However, if you seek a more balanced growth approach with better capital efficiency and manageable leverage, OKE offers better stability despite a modest valuation premium. Both require careful monitoring given their liquidity constraints and declining ROIC trends.
Disclaimer: Investment carries a risk of loss of initial capital. The past performance is not a reliable indicator of future results. Be sure to understand risks before making an investment decision.
Go Further
I encourage you to read the complete analyses of Kinder Morgan, Inc. and ONEOK, Inc. to enhance your investment decisions: