Home > Comparison > Real Estate > SPG vs KIM
The strategic rivalry between Simon Property Group and Kimco Realty defines the current trajectory of the retail real estate sector. Simon operates as a capital-intensive owner of premier shopping and mixed-use destinations, while Kimco focuses on grocery-anchored, open-air shopping centers. This analysis pits Simon’s scale and diversification against Kimco’s niche specialization to determine which offers superior risk-adjusted returns for a diversified portfolio.
Table of contents
Companies Overview
Simon Property Group and Kimco Realty Corporation anchor North America’s retail real estate landscape with distinct market focuses.
Simon Property Group, Inc.: Premier Global Retail Property Owner
Simon Property Group dominates as a leading REIT specializing in premier shopping, dining, and entertainment destinations. It generates revenue by leasing space in high-traffic properties across North America, Europe, and Asia. In 2026, its strategic focus remains on enhancing mixed-use developments and expanding its global footprint to capture evolving consumer trends.
Kimco Realty Corporation: Grocery-Anchored Open-Air Specialist
Kimco Realty Corporation stands out as one of North America’s largest owners and operators of grocery-anchored, open-air shopping centers. Its revenue engine centers on leasing retail space in approximately 400 U.S. properties concentrated in major metropolitan markets. The company’s 2026 strategy emphasizes acquisitions and development in top markets to strengthen its portfolio and tenant mix.
Strategic Collision: Similarities & Divergences
Simon Property Group pursues a closed ecosystem with high-end, mixed-use retail hubs, while Kimco focuses on an open-air, grocery-centric model. They primarily compete in retail real estate but target different consumer experiences and property types. Simon offers premium, large-scale destinations; Kimco delivers convenience and accessibility. Their investment profiles diverge on scale and tenant composition, reflecting unique risk and growth dynamics.
Income Statement Comparison
The following data dissects the core profitability and scalability of both corporate engines to reveal who dominates the bottom line:
| Metric | Simon Property Group, Inc. (SPG) | Kimco Realty Corporation (KIM) |
|---|---|---|
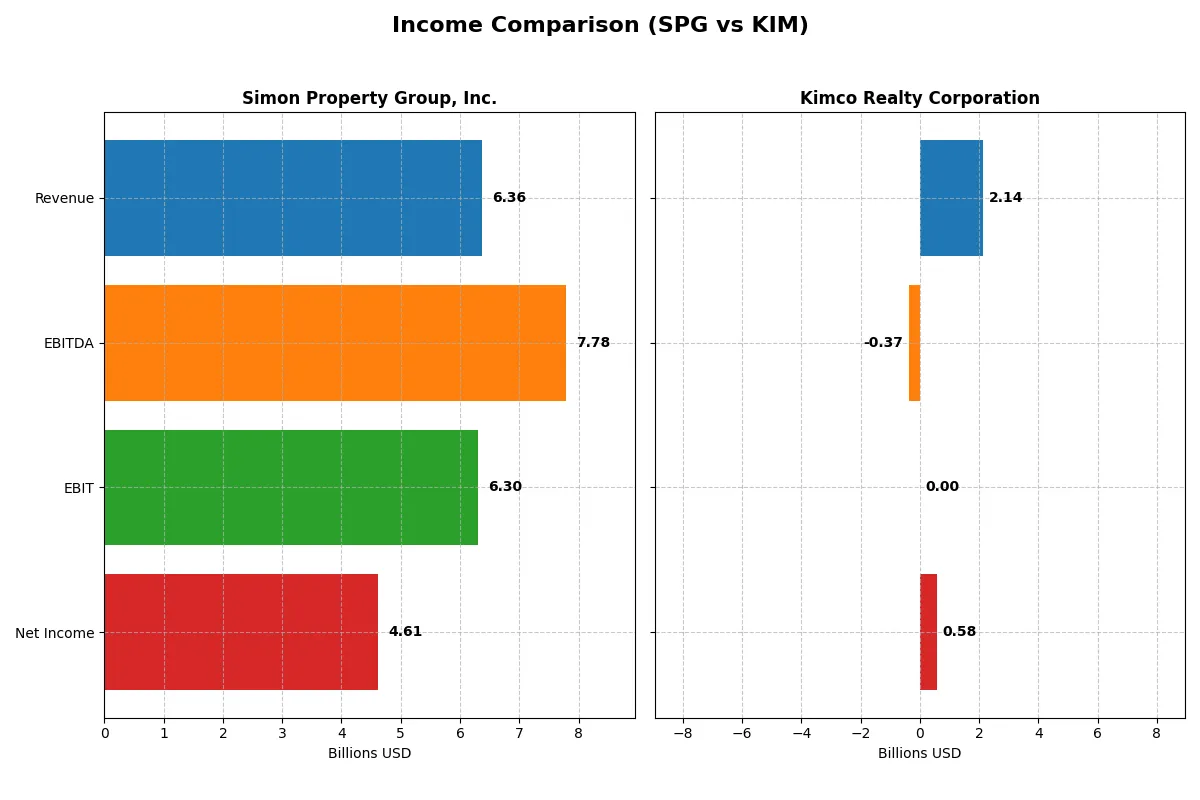
| Revenue | 6.36B | 2.14B |
| Cost of Revenue | 909M | 662M |
| Operating Expenses | 2.28B | 133M |
| Gross Profit | 5.46B | 1.48B |
| EBITDA | 7.78B | -374M |
| EBIT | 6.30B | 0 |
| Interest Expense | 975M | 330M |
| Net Income | 4.61B | 585M |
| EPS | 14.14 | 0.87 |
| Fiscal Year | 2025 | 2025 |
Income Statement Analysis: The Bottom-Line Duel
The upcoming income statement comparison reveals how each company converts revenue into profit, exposing their operational efficiency and financial health.
Simon Property Group, Inc. Analysis
Simon Property Group’s revenue grew steadily from 5.1B in 2021 to over 6.3B in 2025. Net income more than doubled, reaching 4.6B in 2025, showcasing strong profitability momentum. Gross margin remains robust at 85.7%, while net margin surged to 72.5%, reflecting excellent cost control despite a relatively high interest expense of 15.3%.
Kimco Realty Corporation Analysis
Kimco’s revenue climbed from 1.36B in 2021 to 2.14B in 2025, marking impressive top-line growth. However, net income declined overall, hitting 584M in 2025 with a far lower net margin of 27.3%. Gross margin stands at a solid 69%, but EBIT margin collapsed to zero, signaling operational challenges and less efficiency in converting sales to earnings.
Margin Mastery vs. Revenue Expansion
Simon Property Group dominates with superior margins and nearly doubling net income, despite moderate revenue growth. Kimco’s stronger revenue growth contrasts with a declining bottom line and operational inefficiencies. For investors prioritizing profitability and margin resilience, Simon’s profile commands greater fundamental strength and financial discipline.
Financial Ratios Comparison
These vital ratios act as a diagnostic tool to expose the underlying fiscal health, valuation premiums, and capital efficiency of the companies analyzed:
| Ratios | Simon Property Group, Inc. (SPG) | Kimco Realty Corporation (KIM) |
|---|---|---|
| ROE | 88.6% (2025) | N/A (2025) |
| ROIC | -1158.4% (2025) | 0% (2025) |
| P/E | 13.1 (2025) | 23.4 (2025) |
| P/B | 11.6 (2025) | N/A (2025) |
| Current Ratio | 0.0 (2025) | 0.0 (2025) |
| Quick Ratio | 0.0 (2025) | 0.0 (2025) |
| D/E (Debt-to-Equity) | 5.75 (2025) | 0.0 (2025) |
| Debt-to-Assets | 73.7% (2025) | 0.0 (2025) |
| Interest Coverage | 3.26 (2025) | -2.33 (2025) |
| Asset Turnover | 0.157 (2025) | 0.0 (2025) |
| Fixed Asset Turnover | 8.42 (2025) | 0.0 (2025) |
| Payout Ratio | 60.4% (2025) | 116.6% (2025) |
| Dividend Yield | 4.62% (2025) | 4.98% (2025) |
| Fiscal Year | 2025 | 2025 |
Efficiency & Valuation Duel: The Vital Signs
Financial ratios serve as a company’s DNA, unveiling hidden risks and demonstrating operational excellence in clear, quantitative terms.
Simon Property Group, Inc.
Simon Property Group exhibits a robust ROE of 88.61% and a strong net margin of 72.51%, signaling exceptional profitability. The stock trades at a reasonable P/E of 13.08, suggesting it is attractively valued. A 4.62% dividend yield reflects solid shareholder returns, balancing growth with income despite some leverage concerns.
Kimco Realty Corporation
Kimco Realty posts a modest net margin of 27.32% but registers a zero ROE and ROIC, indicating weak profitability. Its P/E of 23.4 is neutral, implying a stretched valuation relative to earnings. A slightly higher dividend yield of 4.98% provides consistent income, though operational efficiency metrics remain unfavorable.
Premium Valuation vs. Operational Safety
Simon Property offers superior profitability and a more attractive P/E, balanced by a reliable dividend yield, despite leverage risks. Kimco’s valuation appears stretched with weaker profitability but offers steady dividends. Investors seeking high operational efficiency may prefer Simon, while income-focused profiles might consider Kimco’s dividend stability.
Which one offers the Superior Shareholder Reward?
I compare Simon Property Group (SPG) and Kimco Realty Corporation (KIM) on dividends, payout ratios, and buybacks to judge total shareholder return. SPG yields 4.6% with a 60% payout ratio, supported by strong free cash flow. KIM offers a 5.0% yield but with a payout above 100%, signaling risk. SPG’s aggressive buybacks amplify returns sustainably, while KIM’s weaker buyback activity and stretched payouts undermine long-term value. I conclude SPG delivers a superior, more sustainable shareholder reward in 2026.
Comparative Score Analysis: The Strategic Profile
The radar chart reveals the fundamental DNA and trade-offs of Simon Property Group and Kimco Realty Corporation, highlighting their core strengths and vulnerabilities:
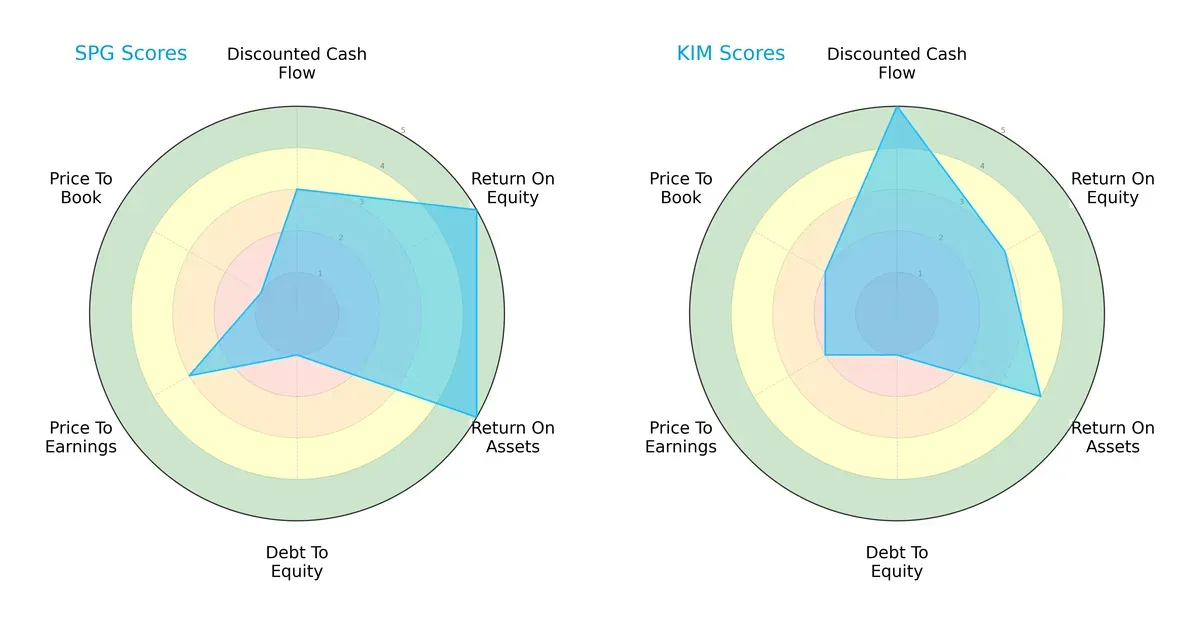
Simon Property Group excels in profitability with top ROE and ROA scores (5 each), indicating superior asset and equity efficiency. Kimco leads in discounted cash flow (DCF) with a score of 5, signaling better valuation based on future cash flows. Both firms share a critical weakness in debt-to-equity (score 1), exposing financial leverage risks. Simon’s valuation metrics (PE and PB scores) lag behind Kimco’s, reflecting more stretched market prices. Overall, Simon shows a more concentrated profitability edge, while Kimco offers a more balanced valuation and cash flow profile.
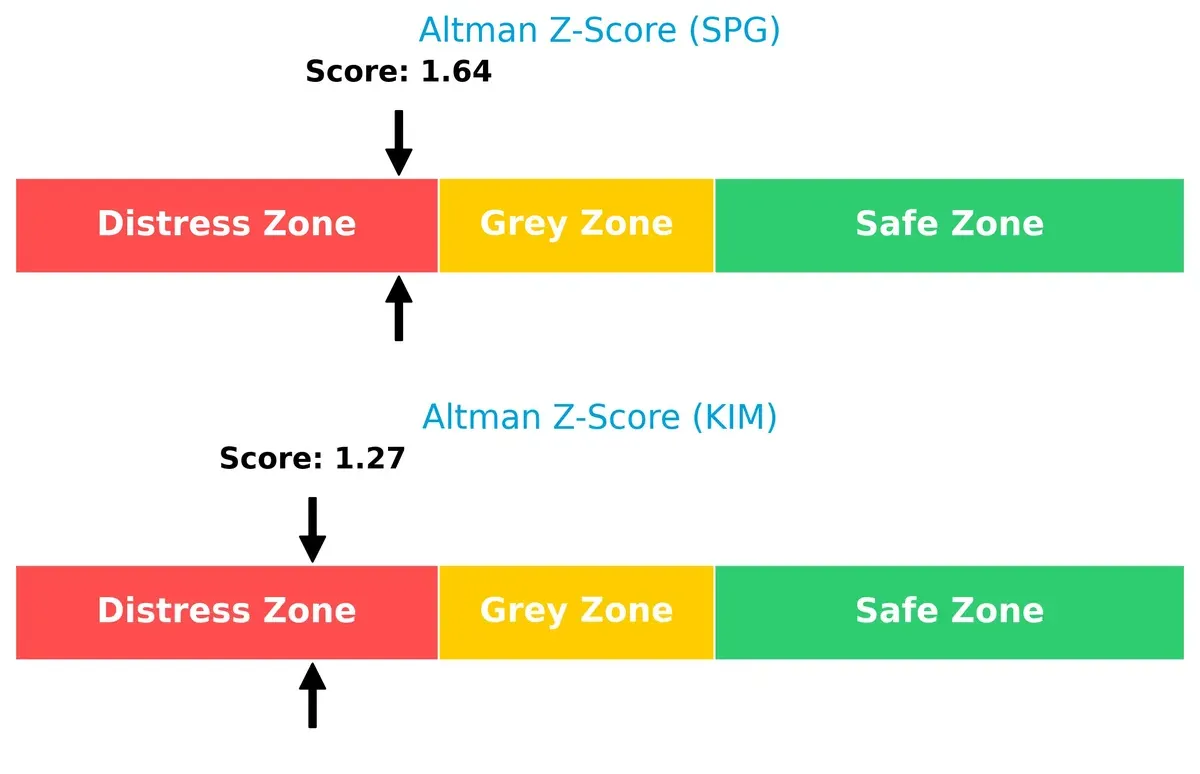
Bankruptcy Risk: Solvency Showdown
Simon Property Group’s Altman Z-Score of 1.64 slightly outperforms Kimco’s 1.27, but both remain in the distress zone, implying elevated bankruptcy risk in this economic cycle:
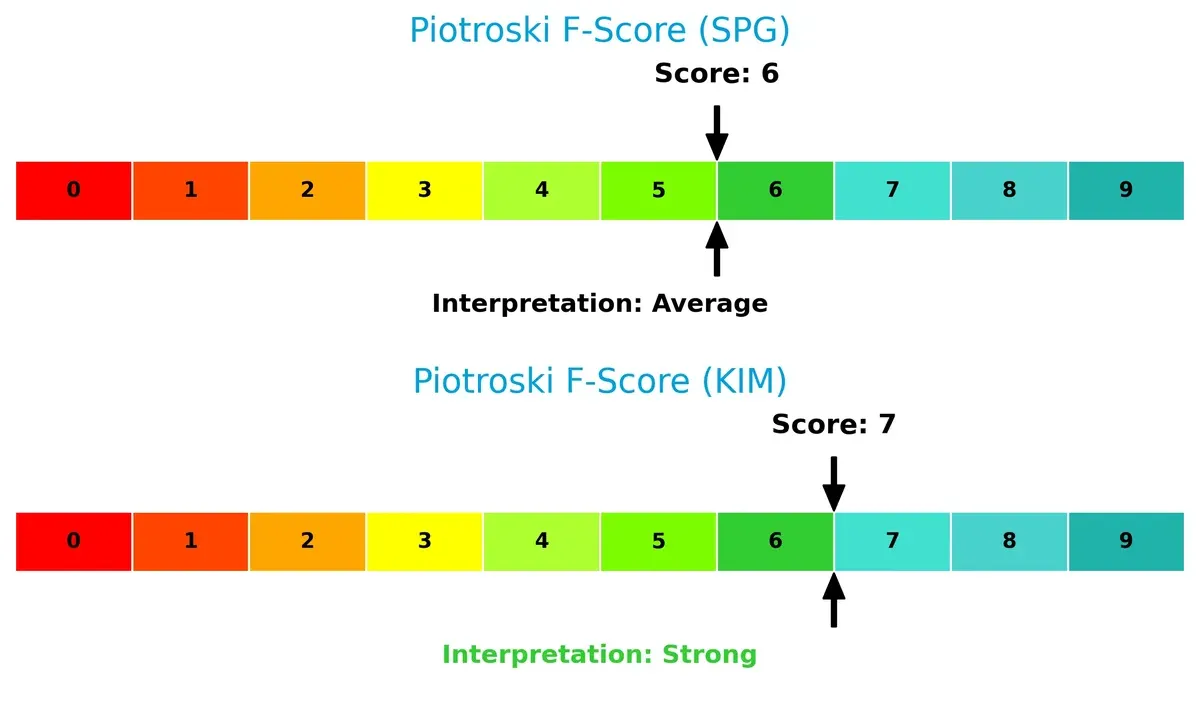
Financial Health: Quality of Operations
Kimco Realty’s Piotroski F-Score of 7 indicates stronger operational health compared to Simon’s 6, suggesting Kimco manages profitability, leverage, and liquidity metrics more robustly:
How are the two companies positioned?
This section dissects SPG and KIM’s operational DNA by comparing revenue distribution and internal dynamics. The goal is to confront their economic moats and identify which model offers the most resilient competitive advantage today.
Revenue Segmentation: The Strategic Mix
The following visual comparison dissects how Simon Property Group and Kimco Realty diversify their income streams and where their primary sector bets lie:
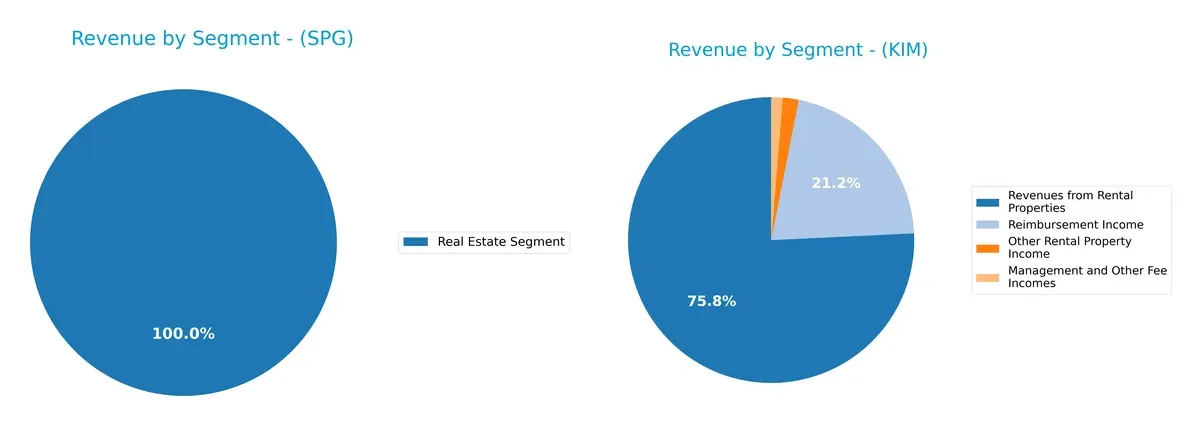
Simon Property Group’s revenue anchors on a single dominant segment, Real Estate, generating $5.54B in 2024. Kimco Realty displays a more diversified mix, with $882M from Rental Properties plus $246M in Reimbursements and smaller fees totaling $47M. Simon’s concentration signals infrastructure dominance but risks overexposure. Kimco’s spread suggests a balanced ecosystem reducing volatility yet potentially limiting scale advantages.
Strengths and Weaknesses Comparison
This table compares the strengths and weaknesses of Simon Property Group and Kimco Realty Corporation:
Simon Property Group Strengths
- High net margin at 72.51%
- Strong ROE of 88.61%
- Favorable WACC at 7.93%
- Attractive dividend yield of 4.62%
- Significant European revenue of 1.2B to 1.6B USD annually
Kimco Realty Corporation Strengths
- Positive net margin at 27.32%
- Favorable debt-to-equity and debt-to-assets ratios
- Dividend yield slightly higher at 4.98%
- Favorable price-to-book ratio
- Diverse revenue streams including management fees and rental income
Simon Property Group Weaknesses
- Negative ROIC at -115841% signals poor capital efficiency
- High debt-to-assets ratio at 73.74%
- Unfavorable current and quick ratios at 0
- Elevated debt-to-equity at 5.75
- Low asset turnover at 0.16
Kimco Realty Corporation Weaknesses
- Zero ROE and ROIC indicate lack of profitability
- Unavailable WACC data limits cost of capital assessment
- Negative interest coverage ratio
- Unfavorable asset and fixed asset turnover
- Unfavorable current and quick ratios at 0
Simon Property Group excels in profitability and international presence but struggles with capital efficiency and leverage. Kimco Realty shows conservative leverage but faces challenges in profitability and operational efficiency, highlighting contrasting strategic priorities.
The Moat Duel: Analyzing Competitive Defensibility
A structural moat is the only reliable barrier protecting long-term profits from relentless competitive erosion. Let’s dissect two retail REIT giants’ moats:
Simon Property Group, Inc.: Intangible Asset Moat Anchored in Premier Destinations
Simon’s moat stems from its portfolio of premier shopping and mixed-use properties, creating high switching costs for tenants. Financials show robust margin stability with a 72.5% net margin. However, declining ROIC signals potential erosion, though expansion into international markets like Europe could deepen its moat in 2026.
Kimco Realty Corporation: Cost Advantage in Grocery-Anchored Centers
Kimco’s moat relies on cost advantages in managing grocery-anchored shopping centers, contrasting Simon’s intangible asset focus. It maintains favorable gross margins (69%) but suffers from declining ROIC and weak EBIT growth. Opportunities lie in optimizing operational efficiency and selective development to sustain competitiveness.
Intangible Assets vs. Cost Efficiency: Who Holds the Moat Edge?
Simon’s intangible asset moat offers deeper competitive defensibility despite profitability challenges. Kimco’s cost advantage provides a narrower moat with more operational risk. Simon stands better poised to defend market share amid rising competition.
Which stock offers better returns?
The past year shows Simon Property Group surging 29.6%, marked by accelerating momentum and notable price swings. Kimco Realty climbs 19%, also accelerating but with lower volatility.
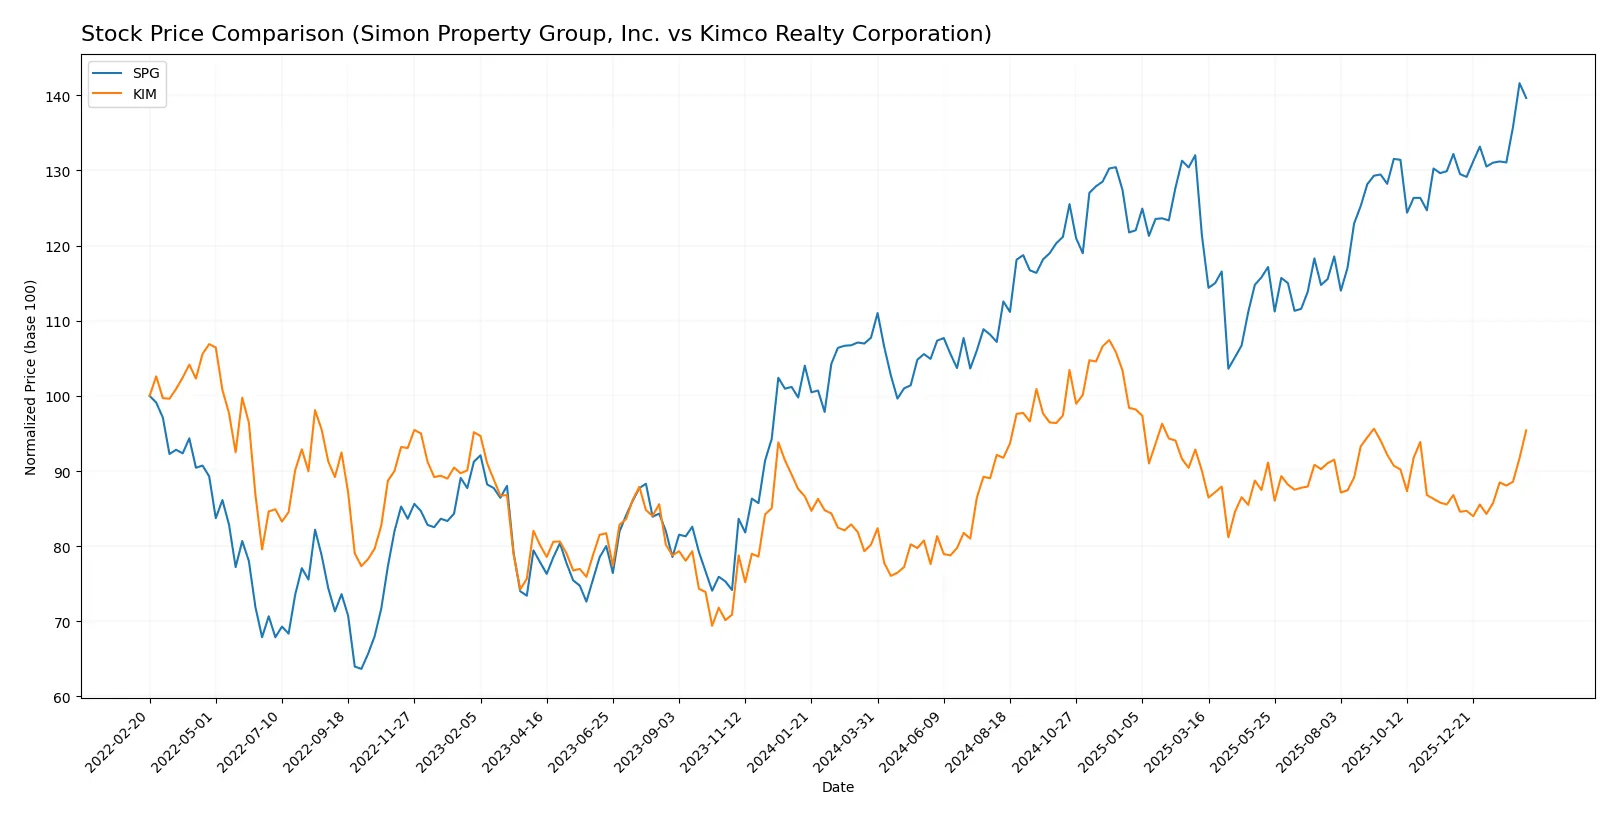
Trend Comparison
Simon Property Group’s stock rose 29.6% over 12 months, reflecting a strong bullish trend with accelerating gains and high volatility (14.06 std deviation). The price peaked at 199.6 and hit a low of 140.44.
Kimco Realty increased 19% over the same period, also bullish with acceleration but far lower volatility (1.7 std deviation). Its price ranged between 18.1 and 25.57, showing steadier movement.
Simon Property Group outperformed Kimco Realty by 9.6 percentage points, delivering the strongest market performance among the two over the last year.
Target Prices
Analysts present a moderate upside potential for Simon Property Group and Kimco Realty Corporation based on current consensus targets.
| Company | Target Low | Target High | Consensus |
|---|---|---|---|
| Simon Property Group, Inc. | 173 | 230 | 194.6 |
| Kimco Realty Corporation | 21 | 26 | 24.14 |
Simon Property Group’s consensus target of 194.6 is slightly below its current price of 196.83, suggesting limited near-term upside. Kimco Realty’s consensus target of 24.14 implies modest appreciation from its current price of 22.71.

Don’t Let Luck Decide Your Entry Point
Optimize your entry points with our advanced ProRealTime indicators. You’ll get efficient buy signals with precise price targets for maximum performance. Start outperforming now!
How do institutions grade them?
The following presents institutional grades for Simon Property Group, Inc. and Kimco Realty Corporation:
Simon Property Group, Inc. Grades
This table displays recent grades issued by recognized financial institutions for Simon Property Group, Inc.
| Grading Company | Action | New Grade | Date |
|---|---|---|---|
| JP Morgan | Maintain | Neutral | 2026-02-06 |
| Citigroup | Maintain | Neutral | 2026-02-05 |
| Piper Sandler | Maintain | Overweight | 2026-02-03 |
| Evercore ISI Group | Maintain | In Line | 2026-02-03 |
| Stifel | Maintain | Hold | 2026-02-03 |
| Scotiabank | Maintain | Sector Perform | 2026-01-14 |
| UBS | Maintain | Neutral | 2026-01-08 |
| Truist Securities | Maintain | Hold | 2025-12-17 |
| Citigroup | Maintain | Neutral | 2025-11-26 |
| Barclays | Maintain | Equal Weight | 2025-11-18 |
Kimco Realty Corporation Grades
Below are the latest grades from reputable firms for Kimco Realty Corporation.
| Grading Company | Action | New Grade | Date |
|---|---|---|---|
| Evercore ISI Group | Maintain | In Line | 2026-02-13 |
| Truist Securities | Maintain | Hold | 2026-01-20 |
| UBS | Maintain | Buy | 2026-01-08 |
| Wells Fargo | Maintain | Equal Weight | 2025-12-15 |
| Citigroup | Maintain | Neutral | 2025-12-03 |
| Argus Research | Maintain | Buy | 2025-12-01 |
| Scotiabank | Maintain | Sector Perform | 2025-11-13 |
| Barclays | Maintain | Overweight | 2025-10-06 |
| Evercore ISI Group | Maintain | In Line | 2025-09-08 |
| Barclays | Maintain | Overweight | 2025-08-27 |
Which company has the best grades?
Kimco Realty Corporation consistently receives higher ratings, including multiple Buy and Overweight grades. Simon Property Group, Inc. is predominantly rated Neutral or Hold. This suggests stronger institutional conviction in Kimco’s near-term prospects.
Risks specific to each company
The following categories identify the critical pressure points and systemic threats facing both firms in the 2026 market environment:
1. Market & Competition
Simon Property Group, Inc. (SPG)
- Operates premier mixed-use destinations across multiple continents, facing intense retail REIT competition.
Kimco Realty Corporation (KIM)
- Focuses on open-air, grocery-anchored centers, competing in niche retail segments with strong regional players.
2. Capital Structure & Debt
Simon Property Group, Inc. (SPG)
- High debt-to-assets at 74%, with D/E ratio 5.75 signals heavy leverage and financial risk.
Kimco Realty Corporation (KIM)
- Shows negligible debt levels, indicating lower financial risk but potential under-leveraging.
3. Stock Volatility
Simon Property Group, Inc. (SPG)
- Beta of 1.396 suggests higher volatility than market, increasing risk during downturns.
Kimco Realty Corporation (KIM)
- Beta of 1.076 indicates moderate volatility, closer to market average and less sensitivity.
4. Regulatory & Legal
Simon Property Group, Inc. (SPG)
- Global footprint exposes SPG to varied international compliance and zoning laws.
Kimco Realty Corporation (KIM)
- Primarily US-focused, facing standard domestic regulatory challenges in retail property sector.
5. Supply Chain & Operations
Simon Property Group, Inc. (SPG)
- Relies on diverse tenant mix and international operations, vulnerable to retail sector shifts and disruptions.
Kimco Realty Corporation (KIM)
- Concentrated on US open-air centers, potentially more resilient but limited diversification.
6. ESG & Climate Transition
Simon Property Group, Inc. (SPG)
- Large-scale properties face significant ESG pressures to reduce carbon footprint and enhance sustainability.
Kimco Realty Corporation (KIM)
- ESG efforts focused on community impact and energy efficiency in open-air assets, with growing investor scrutiny.
7. Geopolitical Exposure
Simon Property Group, Inc. (SPG)
- Operations in North America, Europe, and Asia expose SPG to geopolitical risks and currency fluctuations.
Kimco Realty Corporation (KIM)
- Concentrated in US markets, reducing geopolitical risk but increasing dependence on domestic economic conditions.
Which company shows a better risk-adjusted profile?
Simon Property Group’s biggest risk is its heavy leverage, reflected in a high debt-to-assets ratio of 74%, which could strain liquidity in an economic downturn. Kimco’s main vulnerability lies in weaker profitability and financial efficiency metrics. Despite higher volatility, SPG’s diversified operations provide some buffer. Kimco’s lower debt levels offer stability but its zero return on equity and assets raises concerns about operational effectiveness. Recent Altman Z-Scores place both in distress zones, but Kimco’s stronger Piotroski score suggests marginally better financial health. Overall, Kimco shows a slightly better risk-adjusted profile due to lower leverage and stronger financial strength signals.
Final Verdict: Which stock to choose?
Simon Property Group’s superpower lies in its robust income generation and impressive earnings growth, showcasing a cash machine that sustains shareholder value. Its leverage and liquidity constraints, however, remain points of vigilance. This stock suits investors with an appetite for aggressive growth and income.
Kimco Realty’s strategic moat is its defensive real estate portfolio backed by steady dividend yield, offering relative safety compared to Simon Property Group’s higher leverage risks. It fits well within a GARP (Growth at a Reasonable Price) portfolio seeking income stability over rapid expansion.
If you prioritize aggressive growth and high income, Simon Property Group is the compelling choice due to its strong earnings momentum, despite elevated financial risks. However, if you seek safer dividend income with more conservative financial structure, Kimco Realty offers better stability, albeit with more modest growth prospects.
Disclaimer: Investment carries a risk of loss of initial capital. The past performance is not a reliable indicator of future results. Be sure to understand risks before making an investment decision.
Go Further
I encourage you to read the complete analyses of Simon Property Group, Inc. and Kimco Realty Corporation to enhance your investment decisions: