Home > Comparison > Real Estate > KIM vs REG
The strategic rivalry between Kimco Realty Corporation and Regency Centers Corporation shapes the retail real estate sector’s future. Kimco, a large-scale owner of grocery-anchored shopping centers, contrasts with Regency’s focus on affluent, densely populated trade areas and fully integrated management. This analysis pits Kimco’s broad asset base against Regency’s premium niche strategy to identify which offers superior risk-adjusted returns for a diversified portfolio amid evolving market dynamics.
Table of contents
Companies Overview
Kimco Realty Corporation and Regency Centers Corporation lead North America’s retail REIT sector with distinctive market approaches.
Kimco Realty Corporation: Open-Air Shopping Center Specialist
Kimco dominates as a publicly traded REIT specializing in open-air, grocery-anchored shopping centers. Its core revenue comes from leasing 70M sq ft across 400 U.S. properties. In 2020, it focused on acquisitions, development, and management in major metropolitan markets, leveraging its long-standing expertise and scale to sustain competitive advantage.
Regency Centers Corporation: Affluent Trade Area Leader
Regency Centers commands a national portfolio concentrated in affluent, densely populated areas. It generates revenue from leasing high-performing grocers, restaurants, and retail tenants. The company operates as a fully integrated, self-managed REIT emphasizing community connectivity and premium tenant mix, prioritizing quality over quantity in its strategic growth for 2020.
Strategic Collision: Similarities & Divergences
Both firms compete in retail real estate but diverge in portfolio strategies—Kimco targets broad metropolitan markets with scale, while Regency focuses on affluent, niche trade areas. Their battleground lies in tenant quality and location premium. Investors face contrasting profiles: Kimco’s scale-driven model versus Regency’s curated, high-end positioning within the S&P 500 landscape.
Income Statement Comparison
The following data dissects the core profitability and scalability of both corporate engines to reveal who dominates the bottom line:
| Metric | Kimco Realty Corporation (KIM) | Regency Centers Corporation (REG) |
|---|---|---|
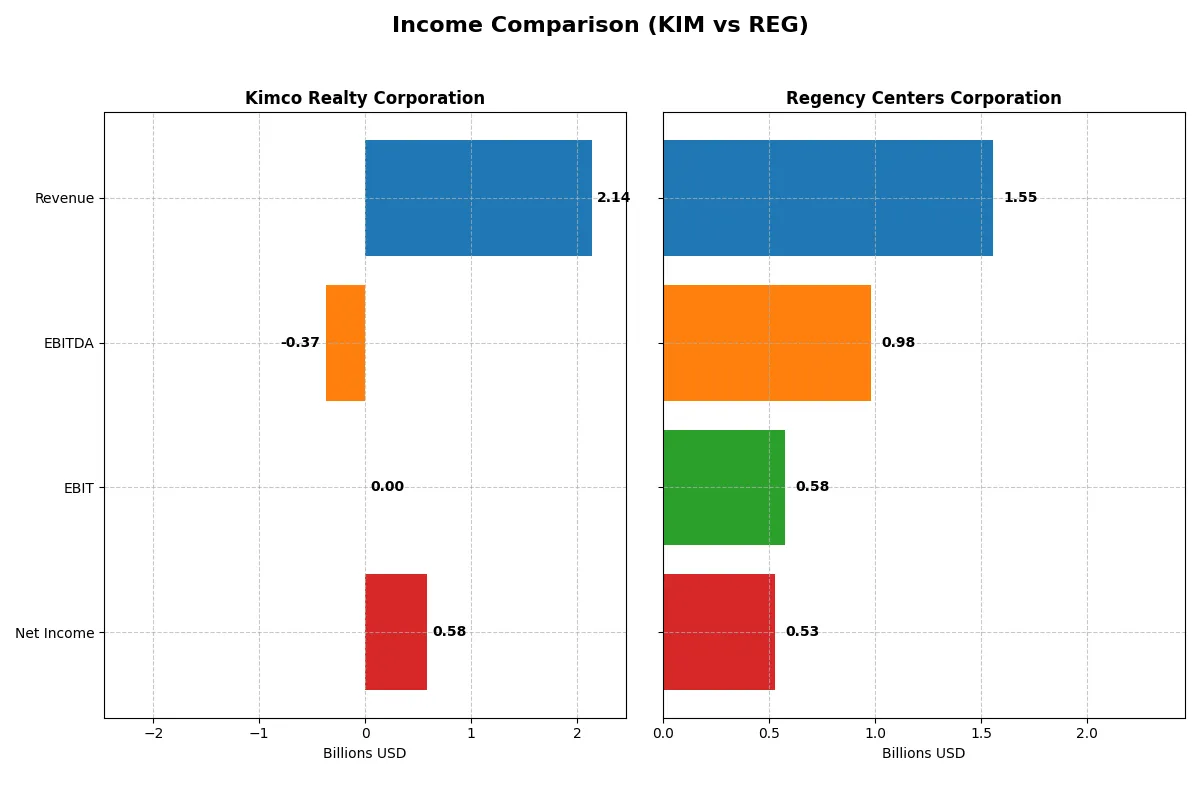
| Revenue | 2.14B | 1.55B |
| Cost of Revenue | 662M | 860M |
| Operating Expenses | 133M | 119M |
| Gross Profit | 1.48B | 694M |
| EBITDA | -374M | 981M |
| EBIT | 0 | 576M |
| Interest Expense | -330M | 59M |
| Net Income | 585M | 527M |
| EPS | 0.87 | 2.79 |
| Fiscal Year | 2025 | 2025 |
Income Statement Analysis: The Bottom-Line Duel
The following income statement comparison reveals which company runs the more efficient and profitable business engine over recent years.
Kimco Realty Corporation Analysis
Kimco’s revenue grew steadily from 1.36B in 2021 to 2.14B in 2025, showing solid top-line momentum. Gross margins remain robust near 69%, signaling strong cost control. However, EBIT margin collapsed in 2025, dragging net income growth overall negative despite a 27% net margin in 2025. Efficiency weakened, with EBIT falling sharply last year.
Regency Centers Corporation Analysis
Regency’s revenue rose more modestly from 1.2B in 2021 to 1.55B in 2025. Gross margin declined to 44.7%, indicating rising costs, yet EBIT margin remains healthy at 37%. Net income and EPS grew steadily, with a 34% net margin in 2025. The company sustains operational efficiency and margin expansion despite slower revenue growth.
Margin Power vs. Revenue Scale
Kimco delivers stronger revenue growth and gross margins but struggles with EBIT efficiency and net income declines. Regency posts steadier net income gains and superior EBIT margins, reflecting tighter expense management. For investors prioritizing margin resilience and bottom-line growth, Regency’s profile currently appears more attractive and sustainable.
Financial Ratios Comparison
These vital ratios act as a diagnostic tool to expose the underlying fiscal health, valuation premiums, and capital efficiency of the companies compared below:
| Ratios | Kimco Realty Corporation (KIM) | Regency Centers Corporation (REG) |
|---|---|---|
| ROE | 3.86% (2024) | 7.64% (2025) |
| ROIC | 2.96% (2024) | 178.49% (2025) |
| P/E | 38.3 (2024) | 24.8 (2025) |
| P/B | 1.48 (2024) | 1.89 (2025) |
| Current Ratio | 3.58 (2024) | 0.33 (2025) |
| Quick Ratio | 3.58 (2024) | 0.33 (2025) |
| D/E (Debt-to-Equity) | 0.81 (2024) | 0.86 (2025) |
| Debt-to-Assets | 42.2% (2024) | 45.7% (2025) |
| Interest Coverage | 2.04 (2024) | 9.82 (2025) |
| Asset Turnover | 0.10 (2024) | 0.12 (2025) |
| Fixed Asset Turnover | 16.11 (2024) | 4.92 (2025) |
| Payout Ratio | 167% (2024) | 0.26% (2025) |
| Dividend Yield | 4.36% (2024) | 0.01% (2025) |
| Fiscal Year | 2024 | 2025 |
Efficiency & Valuation Duel: The Vital Signs
Financial ratios act as the company’s DNA, unveiling operational strengths and hidden risks that shape investor confidence and valuation.
Kimco Realty Corporation
Kimco shows a solid net margin of 27.3%, indicating efficient profitability despite an ROE of 0%, signaling weak equity returns. Its P/E of 23.4 is neutral, suggesting fair valuation levels. Kimco offers a generous 5% dividend yield, rewarding shareholders while reinvestment in growth or R&D appears limited.
Regency Centers Corporation
Regency boasts a stronger net margin at 33.9% and a robust ROIC of 178%, reflecting excellent capital efficiency. The P/E ratio stands neutral at 24.8, slightly above Kimco’s. However, its dividend yield is negligible at 0.01%, implying a focus on internal growth and operational strengthening rather than direct shareholder payouts.
Premium Valuation vs. Operational Safety
Regency’s superior profitability and capital returns contrast with Kimco’s reliable dividend and fair valuation. Regency balances risk with operational excellence, while Kimco offers income stability. Investors seeking growth may prefer Regency’s profile; income-focused investors might lean toward Kimco’s dividend reliability.
Which one offers the Superior Shareholder Reward?
I find Kimco Realty Corporation (KIM) emphasizes dividends with a 4.98% yield and a payout ratio exceeding 100%, signaling aggressive payouts but potential sustainability concerns. Regency Centers Corporation (REG) pays a near-negligible 0.01% dividend yet invests heavily in growth, reflected in its strong free cash flow and low payout ratio. Both companies engage in buybacks, but KIM’s modest buyback activity complements its dividend focus, while REG’s reinvestment strategy drives future growth. Historically, dividend reliability matters in retail REITs, yet REG’s capital allocation towards expansion offers a superior total return profile in 2026. I conclude REG provides more sustainable shareholder reward through growth and prudent capital deployment.
Comparative Score Analysis: The Strategic Profile
The radar chart reveals the fundamental DNA and trade-offs of Kimco Realty Corporation and Regency Centers Corporation:
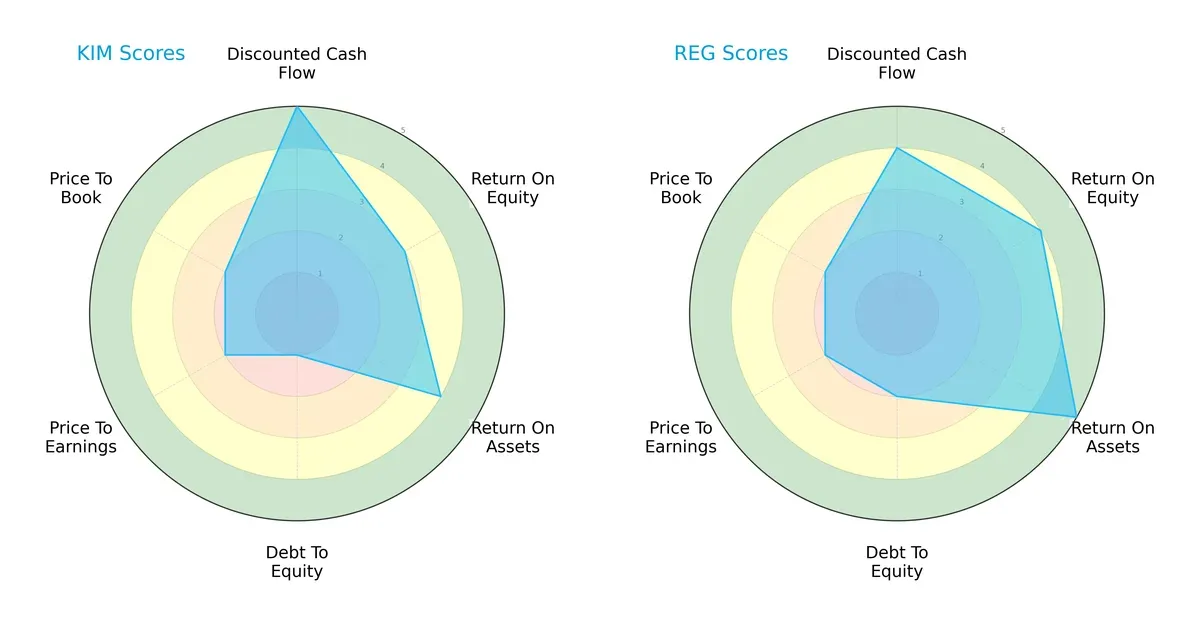
Regency centers show balanced strength with favorable ROE (4) and very favorable ROA (5) scores, while Kimco excels in discounted cash flow (5) but suffers from a very unfavorable debt-to-equity score (1). Kimco relies heavily on cash flow valuation, whereas Regency delivers more consistent operational efficiency. Overall, Regency presents a more balanced financial profile, mitigating risk better than Kimco.
Bankruptcy Risk: Solvency Showdown
The Altman Z-Scores place both firms in the distress zone, signaling elevated bankruptcy risk this cycle:
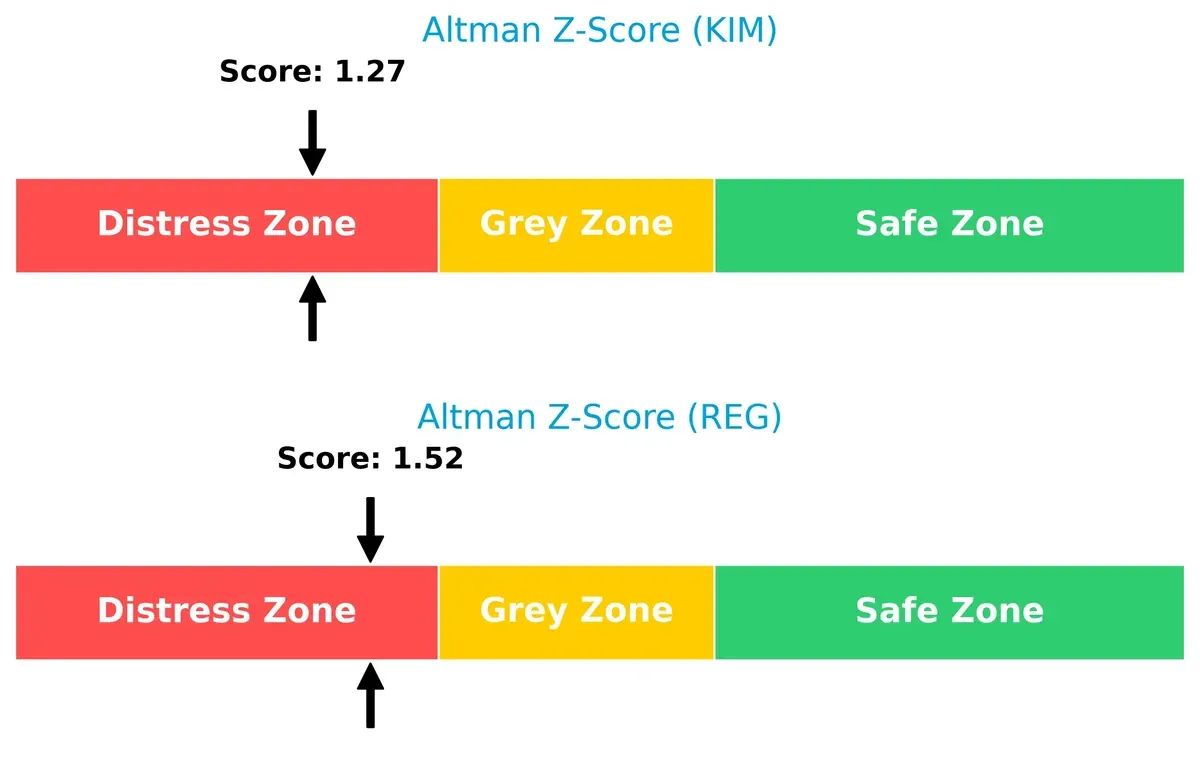
Kimco’s Z-Score of 1.27 is slightly weaker than Regency’s 1.52, indicating marginally higher financial distress. Both firms face solvency challenges, underscoring the need for cautious portfolio allocation.
Financial Health: Quality of Operations
Piotroski F-Scores indicate Kimco operates with stronger internal financial health than Regency:
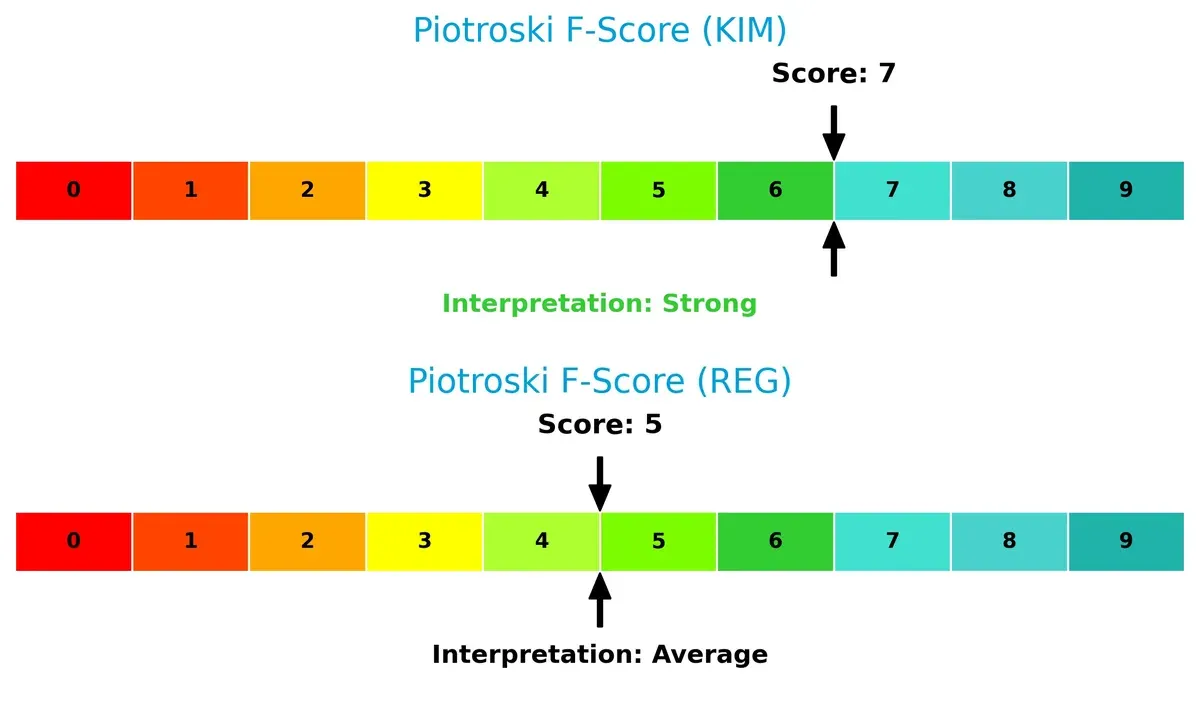
Kimco’s score of 7 signals robust profitability and efficiency metrics, while Regency’s 5 suggests average financial quality with some internal weaknesses. Investors should note Regency’s red flags in operational quality versus Kimco’s healthier fundamentals.
How are the two companies positioned?
This section dissects the operational DNA of Kimco and Regency by comparing their revenue distribution and internal strengths and weaknesses. The goal is to confront their economic moats to reveal which model offers the most resilient, sustainable advantage today.
Revenue Segmentation: The Strategic Mix
This visual comparison dissects how Kimco Realty Corporation and Regency Centers Corporation diversify their income streams and where their primary sector bets lie:
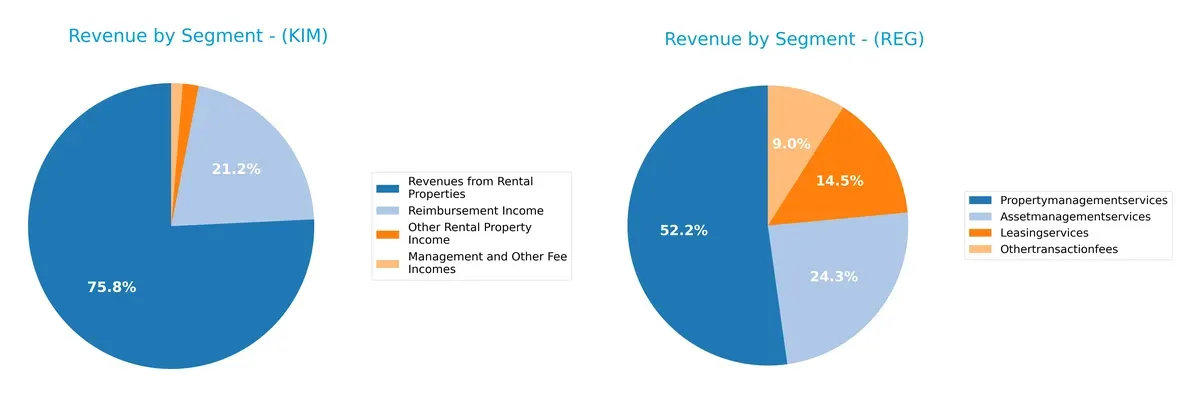
Kimco Realty anchors its revenue with $882M from rental properties, dwarfing its other streams like $246M in reimbursements. Regency Centers shows a more balanced mix, with $14M in property management and $6.5M from asset management services. Kimco’s heavy rental reliance signals concentration risk but strong infrastructure dominance. Regency’s diversified model pivots on multiple service revenues, reducing dependency on any single segment.
Strengths and Weaknesses Comparison
This table compares the strengths and weaknesses of Kimco Realty Corporation and Regency Centers Corporation:
Kimco Strengths
- Favorable net margin at 27.32%
- Favorable dividend yield near 5%
- Favorable debt-to-assets ratio
- Neutral P/E ratio at 23.4
Regency Strengths
- Higher net margin of 33.94%
- Strong ROIC at 178.49% above WACC
- Favorable interest coverage at 9.82
- Favorable fixed asset turnover of 4.92
Kimco Weaknesses
- Zero ROE and ROIC indicate weak capital efficiency
- Unfavorable current and quick ratios
- Negative interest coverage
- Unfavorable asset turnover metrics
Regency Weaknesses
- Low current and quick ratios at 0.33
- Unfavorable dividend yield at 0.01%
- Moderate debt-to-assets at 45.66%
- Unfavorable asset turnover at 0.12
Both companies show strengths in profitability but face liquidity challenges. Kimco’s zero returns on equity and capital invested signal operational inefficiencies, while Regency’s moderate leverage and weak dividend yield suggest cautious capital allocation. These factors will shape each firm’s strategic focus on financial health and growth.
The Moat Duel: Analyzing Competitive Defensibility
A structural moat shields long-term profits from competitive erosion. Only a durable advantage ensures lasting value creation:
Kimco Realty Corporation: Cost Advantage in Grocery-Anchored Retail
Kimco leverages scale and grocery-anchored centers to maintain stable margins and a 27% net margin. However, declining ROIC signals rising pressure on capital efficiency in 2026.
Regency Centers Corporation: Premium Location & Operational Excellence
Regency’s moat stems from prime, affluent locations and integrated management. It delivers a strong 34% net margin and rapidly growing ROIC, underscoring robust value creation and expansion potential.
Location Quality vs. Scale Efficiency: The Moat Showdown
Regency’s growing ROIC and superior margins reveal a deeper moat than Kimco’s cost advantage. Regency is better positioned to defend market share amid intensifying competition.
Which stock offers better returns?
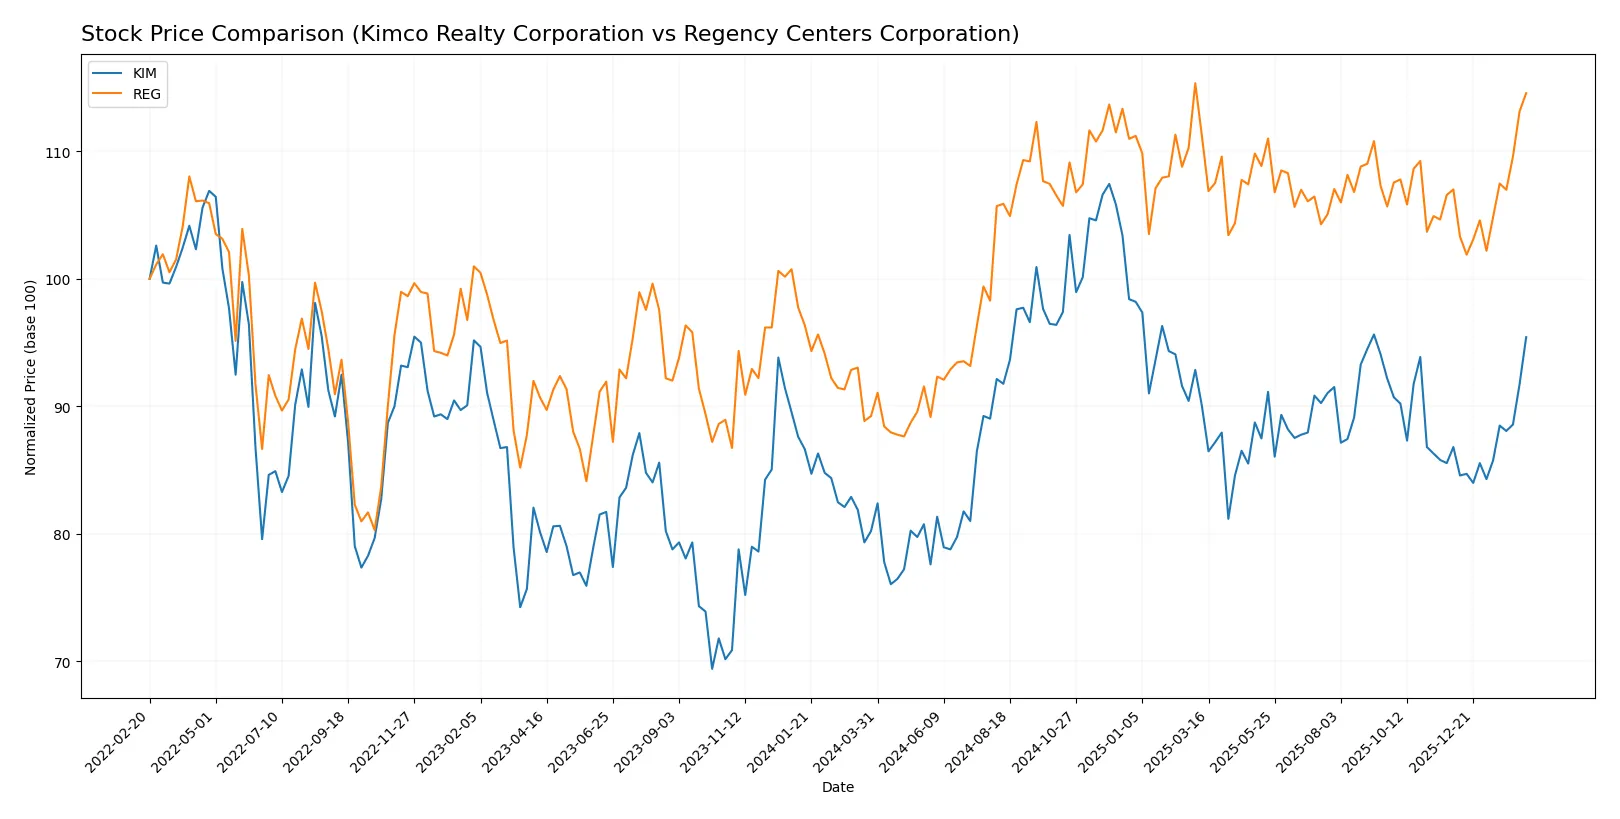
The past year shows strong upward momentum for both Kimco Realty Corporation and Regency Centers Corporation, with accelerating bullish trends and distinct trading volume shifts.
Trend Comparison
Kimco Realty Corporation’s stock rose 18.96% over the past 12 months, showing an accelerating bullish trend with low volatility (1.7 std deviation) and a recent 9.92% gain.
Regency Centers Corporation’s stock gained 28.38% in the same period, exhibiting more volatility (4.64 std deviation) but stronger acceleration and a recent 7.05% increase.
Regency Centers outperformed Kimco Realty with a higher 12-month return and stronger trend acceleration despite greater volatility.
Target Prices
Analysts present a clear target consensus for Kimco Realty Corporation and Regency Centers Corporation.
| Company | Target Low | Target High | Consensus |
|---|---|---|---|
| Kimco Realty Corporation | 21 | 26 | 24.14 |
| Regency Centers Corporation | 74 | 85 | 80.3 |
The consensus target prices suggest moderate upside potential for both REITs. Kimco trades near the lower end of its range, while Regency offers a roughly 5.5% premium to current price, reflecting analyst confidence.

Don’t Let Luck Decide Your Entry Point
Optimize your entry points with our advanced ProRealTime indicators. You’ll get efficient buy signals with precise price targets for maximum performance. Start outperforming now!
How do institutions grade them?
Here are the latest institutional grades for Kimco Realty Corporation and Regency Centers Corporation:
Kimco Realty Corporation Grades
This table details recent grades and actions from top grading firms for Kimco Realty Corporation.
| Grading Company | Action | New Grade | Date |
|---|---|---|---|
| Evercore ISI Group | maintain | In Line | 2026-02-13 |
| Truist Securities | maintain | Hold | 2026-01-20 |
| UBS | maintain | Buy | 2026-01-08 |
| Wells Fargo | maintain | Equal Weight | 2025-12-15 |
| Citigroup | maintain | Neutral | 2025-12-03 |
| Argus Research | maintain | Buy | 2025-12-01 |
| Scotiabank | maintain | Sector Perform | 2025-11-13 |
| Barclays | maintain | Overweight | 2025-10-06 |
| Evercore ISI Group | maintain | In Line | 2025-09-08 |
| Barclays | maintain | Overweight | 2025-08-27 |
Regency Centers Corporation Grades
This table summarizes recent institutional grades and rating changes for Regency Centers Corporation.
| Grading Company | Action | New Grade | Date |
|---|---|---|---|
| Citigroup | maintain | Neutral | 2026-02-10 |
| Scotiabank | maintain | Sector Perform | 2026-01-14 |
| Mizuho | downgrade | Neutral | 2026-01-09 |
| UBS | maintain | Neutral | 2026-01-08 |
| JP Morgan | downgrade | Neutral | 2025-12-18 |
| Keybanc | downgrade | Sector Weight | 2025-12-04 |
| Truist Securities | maintain | Buy | 2025-11-18 |
| Barclays | upgrade | Overweight | 2025-11-18 |
| Scotiabank | maintain | Sector Perform | 2025-11-13 |
| Wells Fargo | maintain | Overweight | 2025-10-21 |
Which company has the best grades?
Kimco Realty Corporation consistently holds moderate to positive ratings, including multiple Buy and Overweight grades. Regency Centers Corporation shows more mixed results with several downgrades and a neutral consensus. Investors may interpret Kimco’s steadier positive grades as a sign of stronger institutional confidence.
Risks specific to each company
The following categories identify the critical pressure points and systemic threats facing both firms in the 2026 market environment:
1. Market & Competition
Kimco Realty Corporation
- Faces intensified competition in grocery-anchored retail, with potential margin pressure.
Regency Centers Corporation
- Operates in affluent markets, benefiting from strong tenant demand but vulnerable to luxury retail shifts.
2. Capital Structure & Debt
Kimco Realty Corporation
- Exhibits a very favorable debt-to-equity profile with low leverage reducing financial risk.
Regency Centers Corporation
- Maintains moderate leverage with a 45.66% debt-to-assets ratio; interest coverage of 9.82 supports debt service.
3. Stock Volatility
Kimco Realty Corporation
- Beta at 1.076 suggests slightly higher market sensitivity and volatility.
Regency Centers Corporation
- Beta at 0.942 indicates lower volatility and more defensive stock behavior.
4. Regulatory & Legal
Kimco Realty Corporation
- Subject to zoning and environmental regulations impacting development opportunities.
Regency Centers Corporation
- Faces similar regulatory scrutiny, with additional exposure given its self-managed structure.
5. Supply Chain & Operations
Kimco Realty Corporation
- Dependent on tenant stability and consumer foot traffic recovery post-pandemic.
Regency Centers Corporation
- Benefits from diversified tenant base; operational efficiency enhanced by integrated management.
6. ESG & Climate Transition
Kimco Realty Corporation
- Increasing pressure to improve ESG scores amid rising investor focus on sustainability.
Regency Centers Corporation
- Actively embraces ESG initiatives, but climate transition costs may impact near-term earnings.
7. Geopolitical Exposure
Kimco Realty Corporation
- Primarily US-focused, reducing international geopolitical risk exposure.
Regency Centers Corporation
- Also US-centric, but operates in diverse economic hubs, slightly increasing regional geopolitical sensitivity.
Which company shows a better risk-adjusted profile?
Regency Centers confronts moderate leverage and operational risks but exhibits stronger financial returns and lower stock volatility. Kimco Realty boasts a conservative capital structure but suffers from weak liquidity and profitability metrics. Regency’s recent favorable ROIC of 178% and interest coverage above 9.8 justify its superior risk-adjusted stance despite leverage. Conversely, Kimco’s Altman Z-score in distress zone signals heightened bankruptcy risk, marking its financial fragility as the most critical concern. Overall, Regency’s balance of growth, stability, and risk management outperforms Kimco in 2026.
Final Verdict: Which stock to choose?
Kimco Realty Corporation (KIM) stands out for its strong cash flow generation and a robust dividend yield, making it a dependable cash machine in the real estate sector. Its point of vigilance lies in the declining ROIC trend, which could signal challenges in capital efficiency ahead. KIM suits investors seeking aggressive growth with an income twist.
Regency Centers Corporation (REG) boasts a very favorable moat, underpinned by a growing ROIC that significantly exceeds its cost of capital. This reflects a sustainable competitive advantage and disciplined capital allocation. While its dividend yield is minimal, REG offers better stability and operational efficiency, fitting well in Growth at a Reasonable Price (GARP) portfolios.
If you prioritize reliable income and aggressive growth potential, Kimco Realty Corporation might be the compelling choice due to its strong cash flow and dividend appeal. However, if you seek durable competitive advantage and superior capital efficiency, Regency Centers Corporation outshines with its sustainable moat and more stable profitability. Both carry risks, but their profiles cater to distinct investor strategies.
Disclaimer: Investment carries a risk of loss of initial capital. The past performance is not a reliable indicator of future results. Be sure to understand risks before making an investment decision.
Go Further
I encourage you to read the complete analyses of Kimco Realty Corporation and Regency Centers Corporation to enhance your investment decisions: