Investors seeking stable income often turn to real estate investment trusts (REITs), and Realty Income Corporation (O) and Kimco Realty Corporation (KIM) stand out as prominent players in this space. Both specialize in retail properties, with overlapping markets and strong portfolios that emphasize long-term leases and tenant diversity. This article will analyze their performance and strategies to help you decide which company is the better choice for your investment wallet.
Table of contents
Companies Overview
I will begin the comparison between Realty Income Corporation and Kimco Realty Corporation by providing an overview of these two companies and their main differences.
Realty Income Corporation Overview
Realty Income Corporation, known as The Monthly Dividend Company, is an S&P 500 REIT focused on retail properties. It aims to provide investors with reliable monthly income through cash flows from over 6,500 properties under long-term leases. The company has a 52-year track record and is recognized for its consistent dividend payments and membership in the S&P 500 Dividend Aristocrats index.
Kimco Realty Corporation Overview
Kimco Realty Corporation is a large REIT specializing in open-air, grocery-anchored shopping centers and mixed-use assets. Headquartered in Jericho, NY, it owns interests in 400 U.S. shopping centers totaling 70M square feet of leasable space, mainly in major metropolitan markets. Kimco has over 60 years of experience in acquisition, development, and management of retail real estate and is publicly traded on the NYSE.
Key similarities and differences
Both companies operate as REITs in the retail real estate sector and are listed on the NYSE with a focus on generating income from leased properties. Realty Income emphasizes monthly dividend reliability supported by a vast portfolio of long-term leased properties, while Kimco concentrates on owning and managing grocery-anchored and mixed-use shopping centers. Realty Income’s portfolio is larger and more diversified, whereas Kimco’s assets are concentrated in major metropolitan areas.
Income Statement Comparison
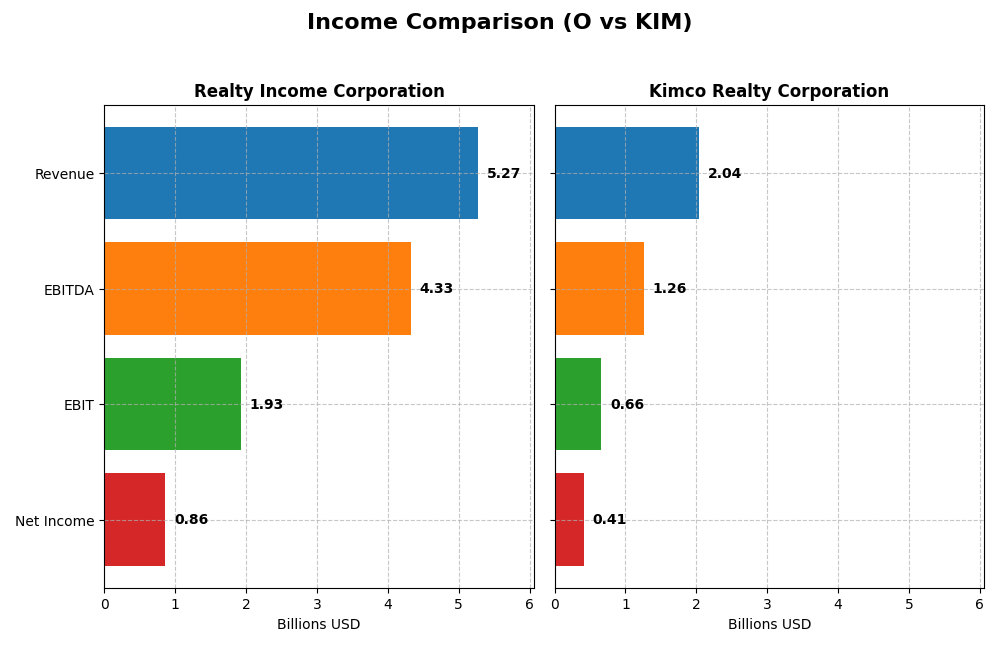
The table below compares key income statement metrics for Realty Income Corporation and Kimco Realty Corporation for their most recent fiscal year, 2024.
| Metric | Realty Income Corporation (O) | Kimco Realty Corporation (KIM) |
|---|---|---|
| Market Cap | 53.6B | 14.0B |
| Revenue | 5.27B | 2.04B |
| EBITDA | 4.33B | 1.26B |
| EBIT | 1.93B | 659M |
| Net Income | 848M | 371M |
| EPS | 0.98 | 0.55 |
| Fiscal Year | 2024 | 2024 |
Income Statement Interpretations
Realty Income Corporation
Realty Income showed strong revenue growth from $1.65B in 2020 to $5.27B in 2024, with net income rising from $395M to $861M over the same period. Gross and EBIT margins remained favorable, with a gross margin at 92.84% and EBIT margin at 36.65% in 2024. Despite a significant net margin decline last year, overall performance exhibits robust expansion and margin stability.
Kimco Realty Corporation
Kimco Realty’s revenue increased from $1.06B in 2020 to $2.04B in 2024, but net income declined from $1.0B to $411M. Gross margin stayed favorable at 68.7%, while EBIT margin was 32.35% in 2024. However, interest expenses rose unfavorably to 15.11%, and net margin dropped sharply last year, reflecting challenges in profitability and margin compression.
Which one has the stronger fundamentals?
Realty Income demonstrates stronger fundamentals with sustained revenue and net income growth, higher and stable margins, and favorable overall income statement evaluations. Kimco, despite revenue gains, suffers from declining net income, higher interest costs, and unfavorable margin trends, leading to a less favorable fundamental outlook compared to Realty Income.
Financial Ratios Comparison
The table below presents the most recent financial ratios for Realty Income Corporation (O) and Kimco Realty Corporation (KIM) based on their fiscal year 2024 data.
| Ratios | Realty Income Corporation (O) | Kimco Realty Corporation (KIM) |
|---|---|---|
| ROE | 2.22% | 3.86% |
| ROIC | 3.19% | 2.96% |
| P/E | 54.18 | 38.30 |
| P/B | 1.20 | 1.48 |
| Current Ratio | 1.68 | 3.58 |
| Quick Ratio | 1.68 | 3.58 |
| D/E (Debt-to-Equity) | 0.69 | 0.81 |
| Debt-to-Assets | 38.9% | 42.2% |
| Interest Coverage | 2.33 | 2.04 |
| Asset Turnover | 0.077 | 0.10 |
| Fixed Asset Turnover | 4.14 | 16.11 |
| Payout Ratio | 314% | 167% |
| Dividend Yield | 5.79% | 4.36% |
Interpretation of the Ratios
Realty Income Corporation
Realty Income shows a mixed ratio profile with favorable net margin (16.33%) and a strong current and quick ratio (~1.68), indicating good liquidity. However, low returns on equity (2.22%) and invested capital (3.19%) and a high price-to-earnings ratio (54.18) raise concerns. The company maintains a stable dividend yield of 5.79%, supported by consistent monthly payouts and a strong free cash flow coverage.
Kimco Realty Corporation
Kimco Realty exhibits a favorable net margin (20.17%) and a solid dividend yield of 4.36%, supported by reliable distributions. The company’s current ratio is notably high at 3.58, signaling strong liquidity, though interest coverage is moderate at 2.14, which could indicate some debt servicing pressure. Returns on equity (3.86%) and invested capital (2.96%) are low, with a relatively lower P/E ratio of 38.3 compared to peers.
Which one has the best ratios?
Both Realty Income and Kimco Realty have slightly favorable overall ratio profiles, with Realty Income showing stronger liquidity and dividend sustainability, while Kimco offers a higher net margin but weaker interest coverage. Realty Income’s lower P/E and balanced leverage contrast with Kimco’s higher asset turnover and liquidity, leaving no clear superior choice based solely on ratios.
Strategic Positioning
This section compares the strategic positioning of Realty Income Corporation and Kimco Realty Corporation, including Market position, Key segments, and disruption:
Realty Income Corporation
- Large market cap of 53.6B with moderate beta (0.807), facing retail REIT competition
- Revenue mainly from retail segment (4B) and industrial (795M), diversified across multiple property types
- Exposure to technological disruption not explicitly detailed
Kimco Realty Corporation
- Smaller market cap of 13.9B with higher beta (1.065), focused on retail REITs in major metro areas
- Revenue primarily from rental properties and fee incomes, focused on grocery-anchored shopping centers
- Exposure to technological disruption not explicitly detailed
Realty Income Corporation vs Kimco Realty Corporation Positioning
Realty Income shows a broad retail and industrial property base with higher market capitalization, while Kimco concentrates on grocery-anchored shopping centers in key metro markets with a smaller scale. Realty Income’s approach is more diversified, Kimco’s more concentrated.
Which has the best competitive advantage?
Both companies are shedding value with ROIC below WACC; Realty Income shows very unfavorable declining profitability, while Kimco has slightly unfavorable but improving ROIC, indicating modestly better competitive resilience.
Stock Comparison
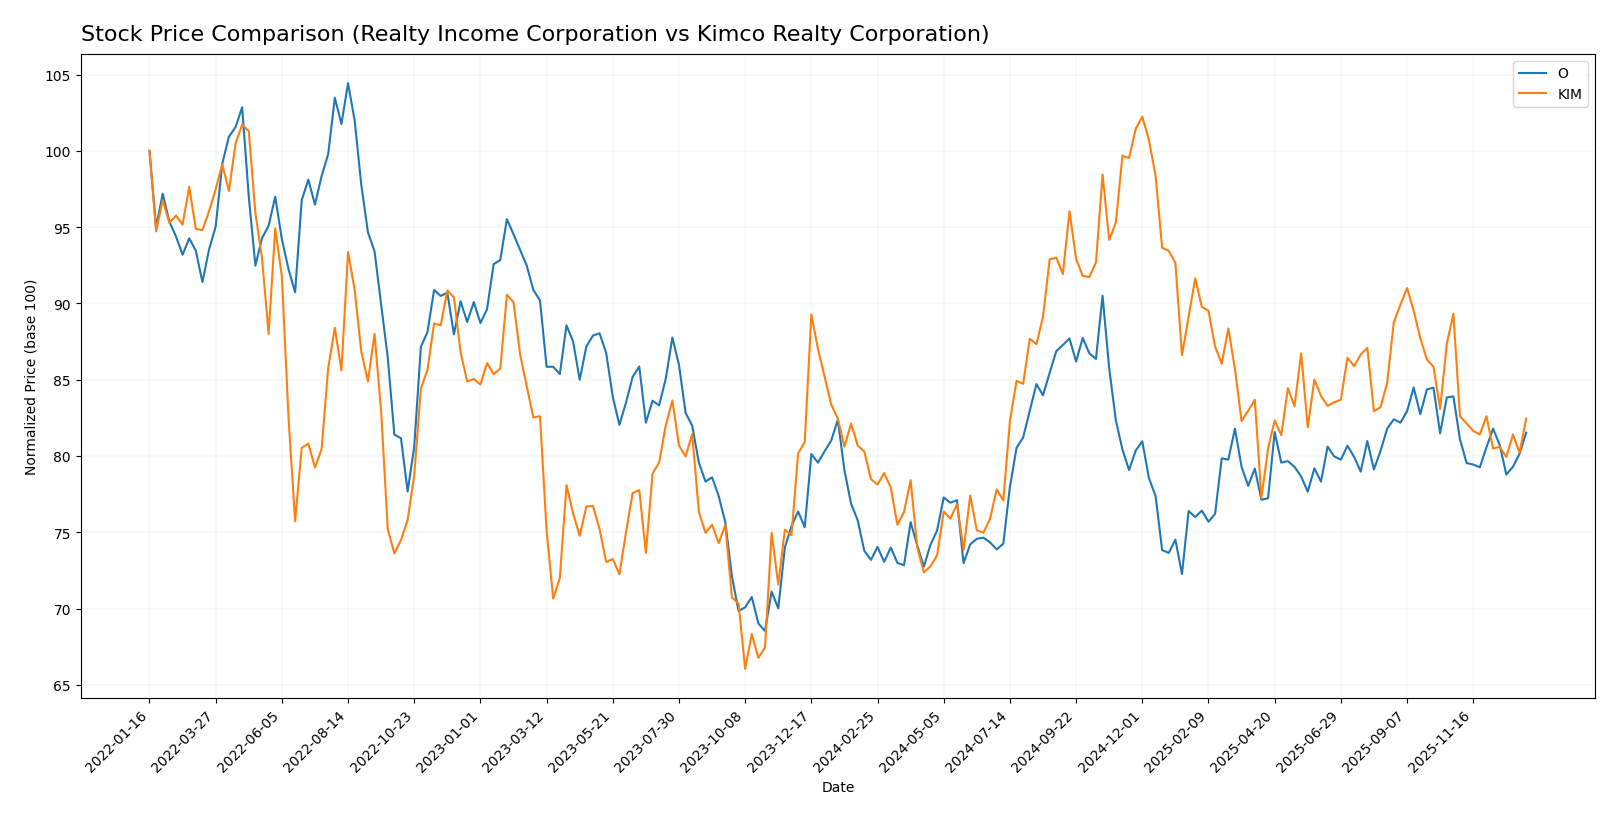
The stock price movements of Realty Income Corporation and Kimco Realty Corporation over the past 12 months show distinct bullish trends with decelerating momentum, followed by a recent downturn in both stocks from late October 2025 to mid-January 2026.
Trend Analysis
Realty Income Corporation experienced an 11.39% price increase over the past year, indicating a bullish trend with deceleration. Its stock ranged between 51.67 and 64.71, showing moderate volatility with a 2.92 standard deviation. The recent trend shows a -2.83% decline with a slight negative slope.
Kimco Realty Corporation saw a 5.04% price increase over the past year, also bullish with deceleration. The stock fluctuated from 18.1 to 25.57, with lower volatility at 1.74 standard deviation. The recent price trend declined by -7.7%, reflecting a stronger downward slope.
Comparing both, Realty Income Corporation delivered the highest market performance over the 12-month period, outperforming Kimco Realty Corporation by a wider margin despite recent short-term declines.
Target Prices
Analyst consensus target prices indicate moderate upside potential for these REITs.
| Company | Target High | Target Low | Consensus |
|---|---|---|---|
| Realty Income Corporation | 65 | 60 | 61.57 |
| Kimco Realty Corporation | 27 | 21 | 24.42 |
Realty Income’s target consensus at 61.57 suggests a slight upside from its current price of 58.29. Kimco Realty’s consensus target of 24.42 also indicates potential appreciation above its present 20.62 price.
Analyst Opinions Comparison
This section compares analysts’ ratings and grades for Realty Income Corporation (O) and Kimco Realty Corporation (KIM):
Rating Comparison
O Rating
- Rating: B- with a very favorable status
- Discounted Cash Flow Score: 5, very favorable
- ROE Score: 2, moderate
- ROA Score: 2, moderate
- Debt To Equity Score: 2, moderate
- Overall Score: 2, moderate
KIM Rating
- Rating: B with a very favorable status
- Discounted Cash Flow Score: 5, very favorable
- ROE Score: 3, moderate
- ROA Score: 3, moderate
- Debt To Equity Score: 2, moderate
- Overall Score: 3, moderate
Which one is the best rated?
Based strictly on the data, KIM holds a higher overall rating (B) and better scores in ROE, ROA, and overall score compared to O, which has a B- rating and lower corresponding scores.
Scores Comparison
The following table compares the Altman Z-Score and Piotroski Score of the two companies:
O Scores
- Altman Z-Score: 0.95, indicating financial distress zone.
- Piotroski Score: 5, reflecting average financial strength.
KIM Scores
- Altman Z-Score: 1.16, also in financial distress zone.
- Piotroski Score: 7, reflecting strong financial strength.
Which company has the best scores?
Based on the provided scores, KIM has a slightly higher Altman Z-Score but still in distress, and a significantly stronger Piotroski Score compared to O. KIM shows better financial strength according to these metrics.
Grades Comparison
Here is a comparison of the latest reliable grades assigned to Realty Income Corporation and Kimco Realty Corporation:
Realty Income Corporation Grades
The table below summarizes recent grades assigned by reputable financial institutions for Realty Income Corporation:
| Grading Company | Action | New Grade | Date |
|---|---|---|---|
| Morgan Stanley | Maintain | Equal Weight | 2025-12-24 |
| JP Morgan | Downgrade | Underweight | 2025-12-18 |
| Mizuho | Maintain | Neutral | 2025-12-17 |
| Barclays | Maintain | Equal Weight | 2025-12-03 |
| Wells Fargo | Maintain | Equal Weight | 2025-11-25 |
| Cantor Fitzgerald | Maintain | Neutral | 2025-11-06 |
| RBC Capital | Maintain | Outperform | 2025-11-04 |
| Barclays | Maintain | Equal Weight | 2025-10-20 |
| Mizuho | Maintain | Neutral | 2025-09-11 |
| Scotiabank | Maintain | Sector Perform | 2025-08-28 |
Overall, grades for Realty Income Corporation predominantly indicate a neutral to equal weight stance, with one outperform rating and a recent downgrade to underweight from JP Morgan.
Kimco Realty Corporation Grades
The following table shows recent grades for Kimco Realty Corporation from recognized grading firms:
| Grading Company | Action | New Grade | Date |
|---|---|---|---|
| Wells Fargo | Maintain | Equal Weight | 2025-12-15 |
| Citigroup | Maintain | Neutral | 2025-12-03 |
| Argus Research | Maintain | Buy | 2025-12-01 |
| Scotiabank | Maintain | Sector Perform | 2025-11-13 |
| Barclays | Maintain | Overweight | 2025-10-06 |
| Evercore ISI Group | Maintain | In Line | 2025-09-08 |
| Barclays | Maintain | Overweight | 2025-08-27 |
| Mizuho | Maintain | Neutral | 2025-08-20 |
| Piper Sandler | Maintain | Overweight | 2025-08-04 |
| Piper Sandler | Maintain | Overweight | 2025-05-05 |
Kimco Realty Corporation’s grades tend to be more positive, with multiple overweight and buy ratings, indicating a generally favorable outlook.
Which company has the best grades?
Kimco Realty Corporation has received more consistently positive grades, including several overweight and buy ratings, compared to Realty Income Corporation’s predominantly neutral and equal weight grades. This pattern may reflect a more optimistic market sentiment toward Kimco, potentially influencing investor confidence and portfolio positioning.
Strengths and Weaknesses
Below is a comparative overview of key strengths and weaknesses for Realty Income Corporation (O) and Kimco Realty Corporation (KIM) based on the most recent financial and operational data.
| Criterion | Realty Income Corporation (O) | Kimco Realty Corporation (KIM) |
|---|---|---|
| Diversification | Strong retail segment focus with expanding industrial segment, good geographic mix primarily US and UK | Mainly retail properties with less diversification, focused on rental properties |
| Profitability | Net margin 16.33% (favorable), but ROIC 3.19% below WACC indicating value destruction | Net margin 20.17% (favorable) but ROIC 2.96% below WACC; improving ROIC trend |
| Innovation | Moderate; traditional REIT model with stable dividend but limited tech innovation | Moderate; traditional retail REIT with focus on improving profitability |
| Global presence | Significant US presence and growing UK operations | Primarily US-focused with limited global exposure |
| Market Share | Large presence in retail real estate with solid asset turnover | Strong in retail leasing with high fixed asset turnover |
Key takeaways: Both companies face challenges in value creation as their ROIC remains below their respective costs of capital, signaling caution. Realty Income shows a decline in profitability trend, while Kimco demonstrates improving returns. Diversification and global presence favor Realty Income, but Kimco holds a slight edge in operational efficiency. Investors should weigh these factors carefully with attention to risk management.
Risk Analysis
Below is a comparative overview of key risks affecting Realty Income Corporation (O) and Kimco Realty Corporation (KIM) as of 2024:
| Metric | Realty Income Corporation (O) | Kimco Realty Corporation (KIM) |
|---|---|---|
| Market Risk | Moderate (Beta 0.81) | Higher (Beta 1.07) |
| Debt Level | Moderate (D/E 0.69) | Moderate (D/E 0.81) |
| Regulatory Risk | Low to moderate | Low to moderate |
| Operational Risk | Moderate | Moderate |
| Environmental Risk | Moderate (real estate sector) | Moderate (retail centers) |
| Geopolitical Risk | Low (US-focused assets) | Low (US-focused assets) |
Realty Income shows a slightly lower market risk and a solid interest coverage ratio, yet its Altman Z-score indicates distress, signaling potential financial vulnerability. Kimco, while having a higher beta and debt ratio, maintains a stronger Piotroski score, reflecting better financial health. The most impactful risks for both remain market volatility and financial distress signals.
Which Stock to Choose?
Realty Income Corporation (O) shows a favorable income evolution with 220% revenue growth over 2020-2024 and a slight decline in net margin and EPS recently. Financial ratios are slightly favorable, with strong gross and EBIT margins, moderate debt, and mixed profitability metrics. However, its MOAT evaluation is very unfavorable, indicating value destruction and declining ROIC. The company holds a very favorable overall rating (B-), despite some concerns on earnings yield and asset turnover.
Kimco Realty Corporation (KIM) presents a less favorable income evolution, with 92.5% revenue growth but significant net income and EPS decline over the same period. Financial ratios are slightly favorable overall, showing solid net margin and dividend yield, though interest expense is higher and some ratios unfavorable. Its MOAT rating is slightly unfavorable but with a growing ROIC trend. The company’s overall rating is very favorable (B) with stronger Piotroski score but also in the distress zone for Altman Z-score.
For investors focused on income statement strength and stable financial ratios, Realty Income might appear more favorable, while Kimco’s improving MOAT and stronger Piotroski score could appeal to those valuing improving profitability and financial health. Risk-averse investors might weigh Realty Income’s established rating and income growth, whereas risk-tolerant or value-focused profiles may find Kimco’s improving return on capital and financial scores more compelling.
Disclaimer: Investment carries a risk of loss of initial capital. The past performance is not a reliable indicator of future results. Be sure to understand risks before making an investment decision.
Go Further
I encourage you to read the complete analyses of Realty Income Corporation and Kimco Realty Corporation to enhance your investment decisions: