Home > Comparison > Consumer Defensive > UL vs KMB
The strategic rivalry between Unilever PLC and Kimberly-Clark Corporation shapes the consumer defensive sector’s landscape. Unilever operates as a diversified fast-moving consumer goods powerhouse, spanning beauty, foods, and home care. Kimberly-Clark focuses on personal care and consumer tissue products, leveraging a specialized product mix. This analysis weighs their distinct operational models to identify which offers a superior risk-adjusted return for diversified portfolios amid evolving market dynamics.
Table of contents
Companies Overview
Unilever and Kimberly-Clark hold pivotal roles in the global consumer defensive sector, shaping household product markets.
Unilever PLC: Global Consumer Goods Powerhouse
Unilever dominates the fast-moving consumer goods space with a diversified portfolio spanning Beauty & Personal Care, Foods & Refreshment, and Home Care. Its core revenue engine thrives on iconic brands like Dove, Knorr, and Ben & Jerry’s. In 2026, Unilever’s strategic focus emphasizes sustainable product innovation and expanding its footprint in emerging markets to secure long-term growth.
Kimberly-Clark Corporation: Leading Personal Care Innovator
Kimberly-Clark commands the personal care and consumer tissue market through strong brands such as Huggies, Kleenex, and Kotex. Its revenue model relies on delivering disposable hygiene products to retail and professional channels worldwide. The firm’s 2026 strategy targets operational efficiency and product line innovation to maintain competitive advantage amid shifting consumer preferences.
Strategic Collision: Similarities & Divergences
Both companies excel in household essentials but diverge in philosophy: Unilever embraces a broad, open portfolio across multiple categories, while Kimberly-Clark focuses on specialized personal and tissue care. Their primary battleground is brand loyalty and innovation in daily-use products. This contrast creates distinct investment profiles—Unilever offers scale and diversification, Kimberly-Clark delivers focused market leadership and operational discipline.
Income Statement Comparison
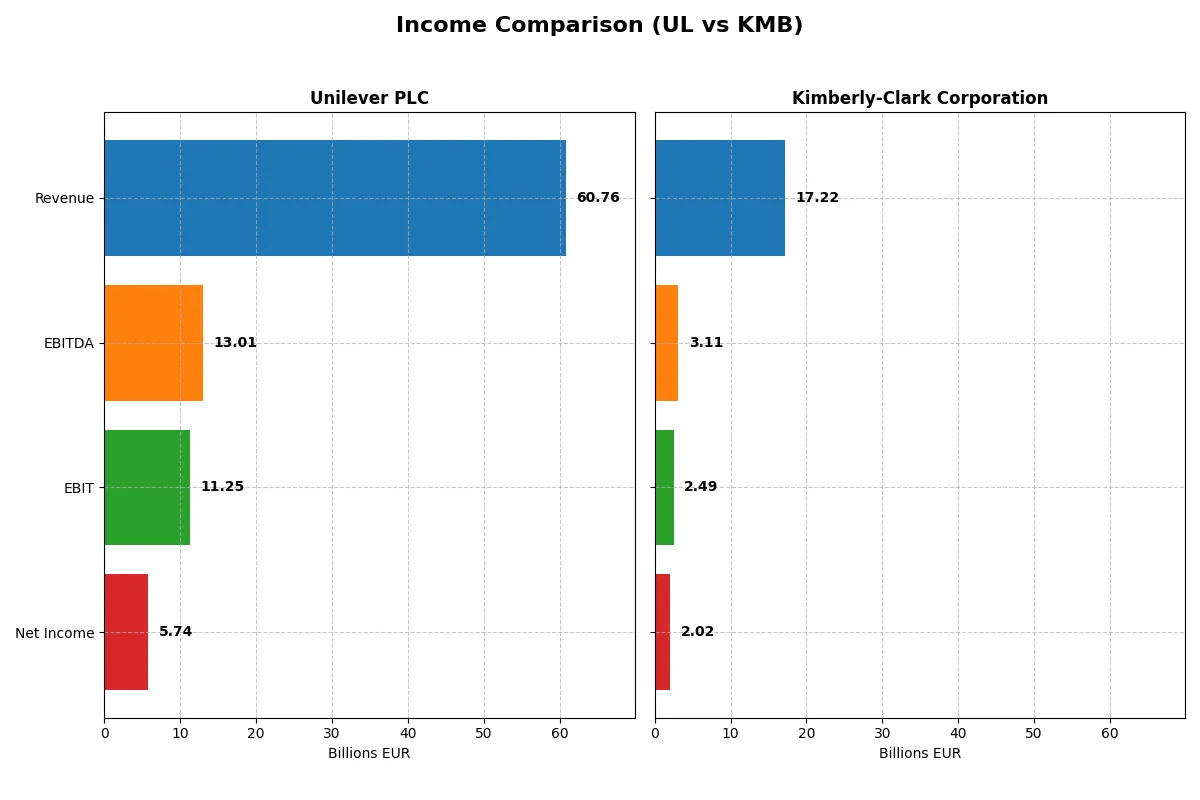
This data dissects the core profitability and scalability of both corporate engines to reveal who dominates the bottom line:
| Metric | Unilever PLC (UL) | Kimberly-Clark Corporation (KMB) |
|---|---|---|
| Revenue | 60.8B EUR | 17.2B USD |
| Cost of Revenue | 0 EUR | 11.1B USD |
| Operating Expenses | 51.4B EUR | 3.64B USD |
| Gross Profit | 60.8B EUR | 6.13B USD |
| EBITDA | 13.0B EUR | 3.11B USD |
| EBIT | 11.3B EUR | 2.49B USD |
| Interest Expense | 1.12B EUR | 256M USD |
| Net Income | 5.74B EUR | 2.02B USD |
| EPS | 2.3 EUR | 6.08 USD |
| Fiscal Year | 2024 | 2025 |
Income Statement Analysis: The Bottom-Line Duel
This Income Statement comparison exposes the true operational efficiency and profitability of two leading consumer goods giants.
Unilever PLC Analysis
Unilever’s revenue grew moderately by 1.94% in 2024, reaching €60.8B, but net income declined by 13.14% to €5.74B. The company maintains an exceptional gross margin of 100%, reflecting strong cost control or accounting treatment. However, net margin slipped to 9.45%, signaling pressure on bottom-line efficiency despite a favorable EBIT margin of 18.52%. The latest year shows momentum in EBIT growth but margin compression requires caution.
Kimberly-Clark Corporation Analysis
Kimberly-Clark’s 2025 revenue dropped sharply by 14.17% to $17.2B, paralleled by a 7.48% net margin decline, yet net income increased by 11.41% to $2.02B. Gross margin remains healthy at 35.61%, supported by an EBIT margin of 14.47%. The company faces revenue headwinds but demonstrates resilience through margin expansion and improved earnings per share growth over the longer term.
Margin Resilience vs. Revenue Stability
Unilever delivers superior revenue scale and a pristine gross margin but struggles with margin contraction and net income volatility. Kimberly-Clark battles declining top-line figures yet sustains profitability growth and margin improvements. For investors, Unilever offers stability in size and operational leverage, while Kimberly-Clark presents a leaner, margin-focused profile with earnings growth despite top-line challenges.
Financial Ratios Comparison
These vital ratios act as a diagnostic tool to expose the underlying fiscal health, valuation premiums, and capital efficiency of the companies compared below:
| Ratios | Unilever (UL) | Kimberly-Clark (KMB) |
|---|---|---|
| ROE | 28.7% | N/A |
| ROIC | 11.1% | N/A |
| P/E | 26.9 | 16.6 |
| P/B | 7.7 | 0 |
| Current Ratio | 0.76 | 0.80 |
| Quick Ratio | 0.56 | 0.54 |
| D/E (Debt-to-Equity) | 1.53 | 0 |
| Debt-to-Assets | 38.4% | 0 |
| Interest Coverage | 8.4 | 9.7 |
| Asset Turnover | 0.76 | 0 |
| Fixed Asset Turnover | 5.21 | 0 |
| Payout ratio | 75.2% | 82.1% |
| Dividend yield | 2.79% | 4.94% |
| Fiscal Year | 2024 | 2025 |
Efficiency & Valuation Duel: The Vital Signs
Ratios act as a company’s DNA, uncovering hidden risks and operational strengths that shape investment decisions.
Unilever PLC
Unilever commands a strong ROE of 28.7% and a solid 9.45% net margin, signaling efficient profitability. Its valuation is stretched, with a P/E of 26.9 and a high P/B of 7.74. The firm supports shareholders via a 2.79% dividend yield, reflecting a balanced capital return approach amid steady reinvestment.
Kimberly-Clark Corporation
Kimberly-Clark posts a favorable net margin of 11.7% but shows no ROE or ROIC data for 2025, clouding profitability insight. The stock trades at a moderate P/E of 16.6, suggesting fair valuation. It delivers a strong 4.94% dividend yield, emphasizing shareholder returns over aggressive reinvestment, though some liquidity ratios are unavailable.
Premium Valuation vs. Dividend Reliability
Unilever’s higher valuation contrasts with its robust returns on equity and invested capital, while Kimberly-Clark offers a lower P/E and stronger dividend yield but lacks clarity on profitability metrics. Investors seeking operational efficiency may lean toward Unilever; income-focused profiles might prefer Kimberly-Clark’s consistent dividends.
Which one offers the Superior Shareholder Reward?
I compare Unilever PLC (UL) and Kimberly-Clark Corporation (KMB) on dividends, payout ratios, and buybacks. KMB yields 4.94% in 2025, with a moderate 82% payout, funded by strong free cash flow of 8.3/share. UL yields 2.8% in 2024, with a 75% payout and 3.1/share free cash flow. Both sustain dividends with solid coverage ratios above 1.5. KMB’s buyback program is more intense, driving higher total return. UL’s lower yield but steady buybacks suit income-focused investors. I favor KMB for superior total shareholder rewards in 2026 due to its higher yield, robust cash flow, and aggressive capital return.
Comparative Score Analysis: The Strategic Profile
The radar chart reveals the fundamental DNA and trade-offs of Unilever PLC and Kimberly-Clark Corporation, exposing their distinct strengths and weaknesses:
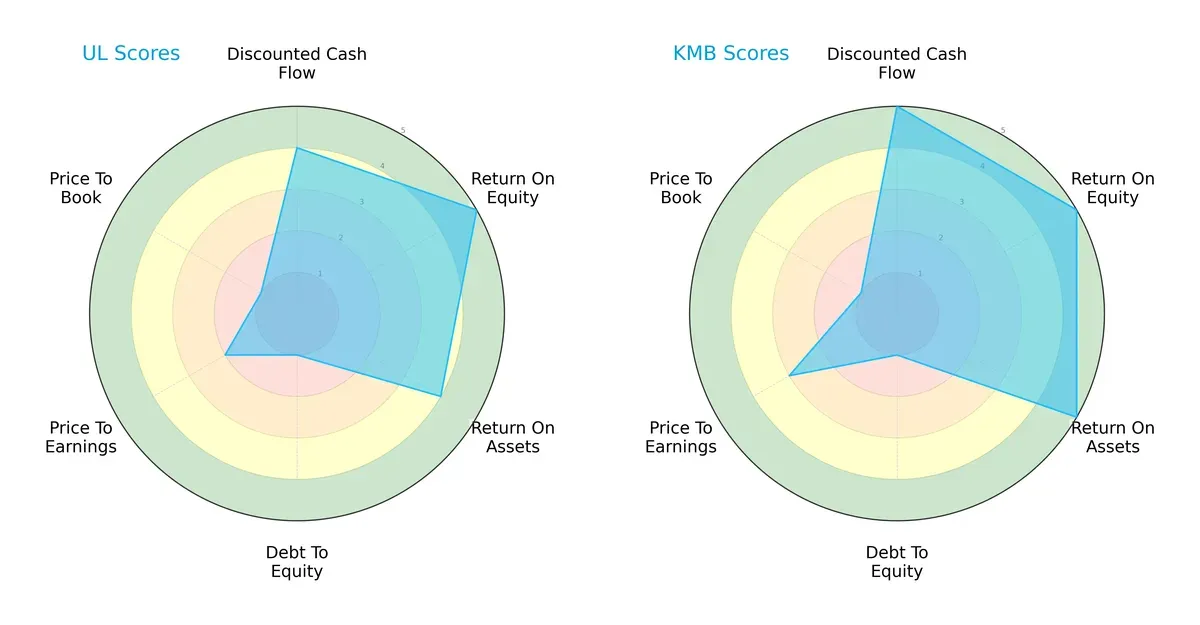
Kimberly-Clark leads with higher overall, DCF, ROE, and ROA scores, reflecting superior cash flow and asset efficiency. Both firms share a weak debt-to-equity profile, signaling elevated financial risk. Unilever shows a more moderate valuation, but Kimberly-Clark’s balanced edge in profitability metrics makes it the stronger all-around performer.
Bankruptcy Risk: Solvency Showdown
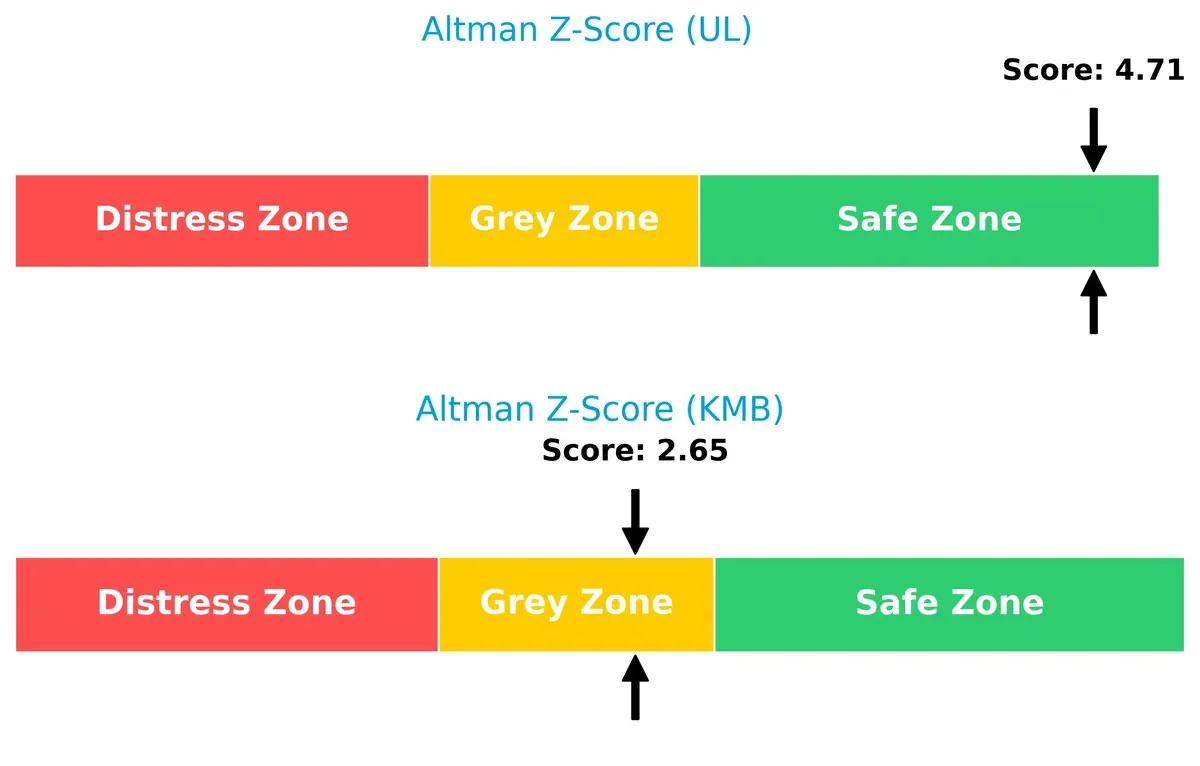
Unilever’s Altman Z-Score of 4.71 places it securely in the safe zone. Kimberly-Clark’s 2.65, in the grey zone, signals moderate bankruptcy risk amid current market cycles:
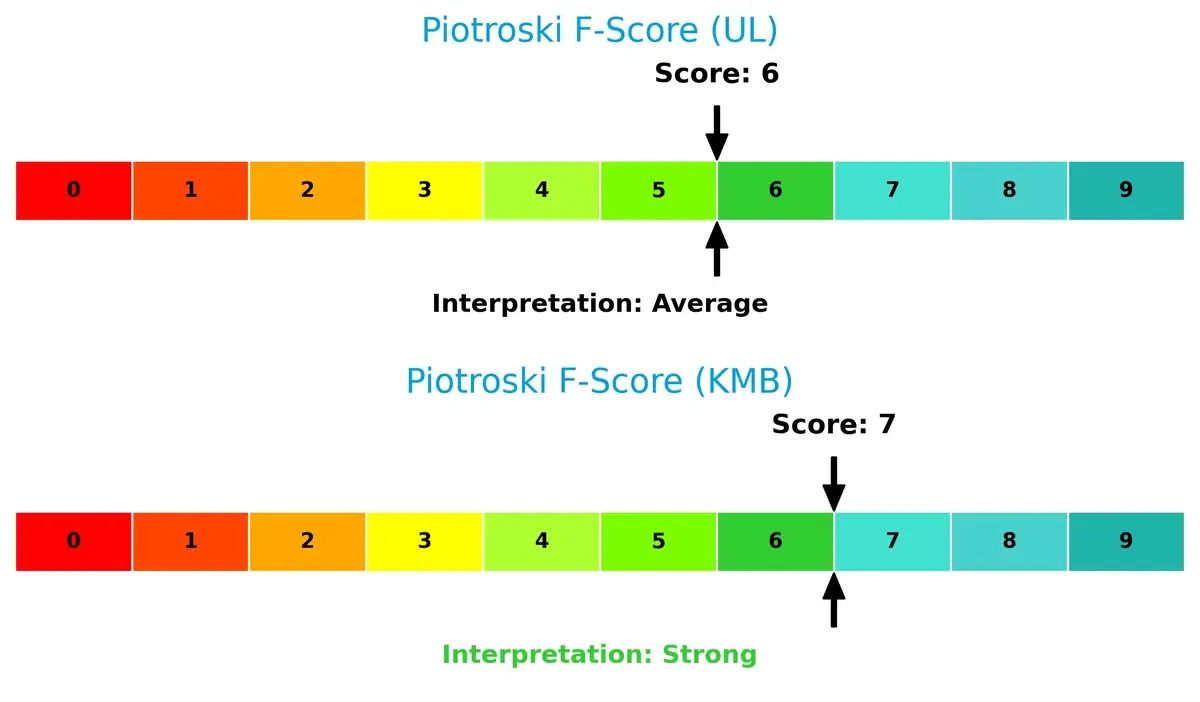
Financial Health: Quality of Operations
Kimberly-Clark’s Piotroski F-Score of 7 surpasses Unilever’s 6, indicating stronger operational quality and fewer red flags in internal metrics:
How are the two companies positioned?
This section dissects Unilever and Kimberly-Clark’s operational DNA by comparing their revenue distribution and internal strengths and weaknesses. The ultimate goal is to confront their economic moats to reveal which model delivers the most resilient competitive advantage today.
Revenue Segmentation: The Strategic Mix
This visual comparison dissects how Unilever PLC and Kimberly-Clark Corporation diversify their income streams and where their primary sector bets lie:
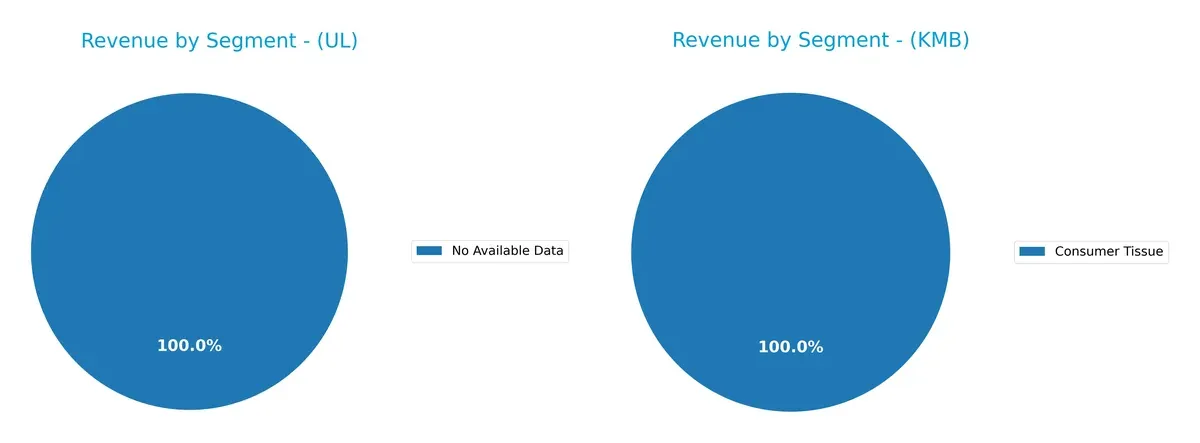
Unilever PLC lacks available segment data, preventing a direct comparison. Kimberly-Clark pivots on three segments: Personal Care anchors with $10.7B, Consumer Tissue follows at $6.2B, and K-C Professional contributes $3.4B. This diversified mix contrasts with companies heavily reliant on one sector, reducing concentration risk. Kimberly-Clark’s balanced segmentation supports resilience through ecosystem lock-in across consumer and professional markets.
Strengths and Weaknesses Comparison
This table compares the Strengths and Weaknesses of Unilever PLC and Kimberly-Clark Corporation:
Unilever PLC Strengths
- Strong global presence across Americas, Asia Pacific, Europe, Latin America
- Favorable ROE at 28.73% and ROIC at 11.12% indicates efficient capital use
- High interest coverage of 10.06 boosts financial stability
- Favorable fixed asset turnover at 5.21 shows operational efficiency
- Dividend yield at 2.79% appeals to income investors
Kimberly-Clark Corporation Strengths
- Diverse product segments including Consumer Tissue, K-C Professional, Personal Care
- Favorable net margin of 11.74% demonstrates profitability
- Strong dividend yield at 4.94% enhances shareholder return
- Favorable debt-to-equity and debt-to-assets ratios suggest low leverage risk
- Solid interest coverage at 9.73 supports debt servicing
Unilever PLC Weaknesses
- Unfavorable liquidity ratios: current ratio 0.76 and quick ratio 0.56 indicate tight short-term liquidity
- High debt-to-equity ratio at 1.53 signals reliance on debt financing
- Unfavorable valuation multiples: PE 26.93 and PB 7.74 suggest potential overvaluation
- Neutral net margin at 9.45% may reflect margin pressure
- Neutral asset turnover at 0.76 limits asset productivity
Kimberly-Clark Corporation Weaknesses
- ROE and ROIC at zero indicate inefficiency in capital returns
- Unavailable WACC hinders cost of capital evaluation
- Unfavorable asset turnover and fixed asset turnover at zero imply operational weaknesses
- Poor liquidity ratios, both current and quick, reported as zero raise red flags
- Neutral PE ratio at 16.63 may limit valuation upside
Unilever shows strong global diversification and capital efficiency but faces liquidity and valuation challenges. Kimberly-Clark benefits from product diversification and profitability but reveals weaknesses in capital returns and asset utilization. These factors shape each company’s strategic priorities for sustainable growth.
The Moat Duel: Analyzing Competitive Defensibility
A structural moat shields long-term profits from competition’s relentless pressure. Only durable advantages withstand erosion and secure value creation:
Unilever PLC: Diversified Brand Power with Scale Economies
Unilever’s moat stems from a vast portfolio and global scale, driving stable margins and a 6.7% ROIC premium over WACC. Yet, its declining ROIC signals rising competitive pressures into 2026, requiring innovation and emerging market expansion to sustain advantage.
Kimberly-Clark Corporation: Focused Brand Loyalty in Consumer Tissue
Kimberly-Clark relies on strong brand loyalty in personal care and tissue segments, generating solid net margins near 12%. However, its shrinking revenue growth and unavailable ROIC data raise caution about sustaining this edge against Unilever’s broader footprint.
Moat Strength Faceoff: Scale and Diversification vs. Brand Loyalty
Unilever’s wider moat benefits from diversified brands and global scale, creating more resilient profit streams. Kimberly-Clark’s narrower focus offers loyalty but less growth cushion. I see Unilever better positioned to defend and grow market share in 2026.
Which stock offers better returns?
The past year shows contrasting price movements between Unilever PLC and Kimberly-Clark Corporation, with Unilever gaining traction while Kimberly-Clark faces downward pressure.
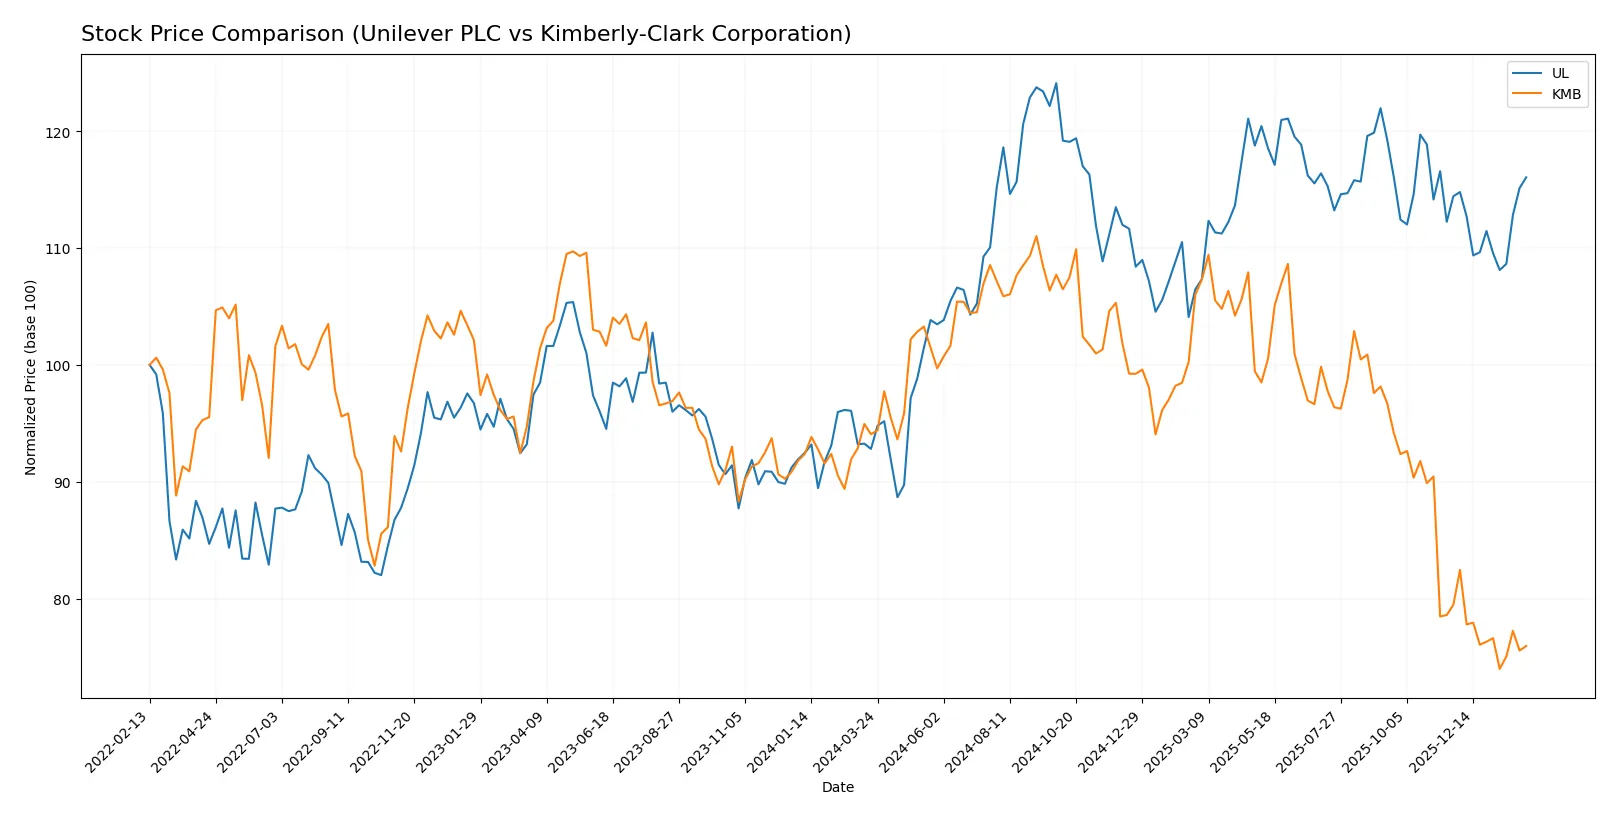
Trend Comparison
Unilever PLC’s stock price rose 25.03% over the past year, a bullish trend marked by decelerating momentum and a steady price range from 52.66 to 73.69. Recent movement shows a neutral 1.41% gain.
Kimberly-Clark’s stock declined 19.24% over the same period, reflecting a bearish trend with deceleration and higher volatility, ranging between 97.92 and 146.91. Recent losses accelerated with a -4.43% drop.
Comparing both, Unilever delivered stronger market performance with a clear bullish trend, while Kimberly-Clark’s price trend remains bearish and more volatile.
Target Prices
Analysts present a mixed but constructive outlook on Unilever PLC and Kimberly-Clark Corporation.
| Company | Target Low | Target High | Consensus |
|---|---|---|---|
| Unilever PLC | 60.1 | 71 | 65.55 |
| Kimberly-Clark Corporation | 102 | 162 | 122.38 |
Unilever’s target consensus of 65.55 slightly trails its current price of 68.73, signaling modest downside risk. Kimberly-Clark’s consensus at 122.38 exceeds its 99.66 stock price, suggesting room for upside.

Don’t Let Luck Decide Your Entry Point
Optimize your entry points with our advanced ProRealTime indicators. You’ll get efficient buy signals with precise price targets for maximum performance. Start outperforming now!
How do institutions grade them?
Unilever PLC Grades
The following table summarizes recent institutional grades for Unilever PLC.
| Grading Company | Action | New Grade | Date |
|---|---|---|---|
| Erste Group | Downgrade | Hold | 2024-11-19 |
| B of A Securities | Upgrade | Buy | 2024-08-22 |
| JP Morgan | Upgrade | Overweight | 2024-05-23 |
| Argus Research | Maintain | Buy | 2024-05-08 |
| Morgan Stanley | Downgrade | Underweight | 2024-02-27 |
| Bernstein | Upgrade | Market Perform | 2022-03-14 |
| Bernstein | Upgrade | Market Perform | 2022-03-13 |
| Bernstein | Upgrade | Market Perform | 2021-11-01 |
| Bernstein | Upgrade | Market Perform | 2021-10-31 |
| Deutsche Bank | Downgrade | Hold | 2021-09-16 |
Kimberly-Clark Corporation Grades
The following table summarizes recent institutional grades for Kimberly-Clark Corporation.
| Grading Company | Action | New Grade | Date |
|---|---|---|---|
| UBS | Maintain | Neutral | 2026-01-28 |
| Citigroup | Maintain | Sell | 2026-01-14 |
| UBS | Maintain | Neutral | 2026-01-14 |
| TD Cowen | Maintain | Hold | 2026-01-08 |
| Wells Fargo | Maintain | Equal Weight | 2026-01-05 |
| Citigroup | Maintain | Sell | 2025-12-17 |
| BNP Paribas Exane | Maintain | Neutral | 2025-12-01 |
| Argus Research | Upgrade | Buy | 2025-11-13 |
| Wells Fargo | Maintain | Equal Weight | 2025-11-04 |
| Evercore ISI Group | Downgrade | In Line | 2025-11-04 |
Which company has the best grades?
Unilever displays more upgrades and Buy or Overweight ratings from top firms, indicating stronger institutional confidence. Kimberly-Clark’s grades lean toward Neutral and Sell, signaling cautious investor sentiment. This divergence could affect investor preference and portfolio positioning.
Risks specific to each company
The following categories identify critical pressure points and systemic threats facing Unilever PLC and Kimberly-Clark Corporation in the 2026 market environment:
1. Market & Competition
Unilever PLC
- Faces stiff competition in fast-moving consumer goods across multiple segments, risking margin pressure.
Kimberly-Clark Corporation
- Competes mainly in personal care and tissue products with strong brand loyalty but limited segment diversification.
2. Capital Structure & Debt
Unilever PLC
- Debt-to-equity ratio of 1.53 signals relatively high leverage; interest coverage remains strong at 10.06.
Kimberly-Clark Corporation
- Shows favorable debt metrics with low or no reported debt; interest coverage at 9.73 is solid.
3. Stock Volatility
Unilever PLC
- Beta at 0.223 indicates low stock volatility, offering defensive characteristics.
Kimberly-Clark Corporation
- Slightly higher beta of 0.277, still low but marginally more sensitive to market swings.
4. Regulatory & Legal
Unilever PLC
- Global footprint exposes it to complex regulatory environments, increasing compliance costs and legal risks.
Kimberly-Clark Corporation
- Primarily US-based but with international sales, faces moderate regulatory challenges and product safety scrutiny.
5. Supply Chain & Operations
Unilever PLC
- Extensive global supply chains risk disruption from geopolitical tensions and inflationary cost pressures.
Kimberly-Clark Corporation
- Supply chain focused on consumer tissue and personal care; vulnerable to raw material cost spikes and logistics delays.
6. ESG & Climate Transition
Unilever PLC
- Strong ESG initiatives but faces pressure to accelerate climate transition and reduce carbon footprint.
Kimberly-Clark Corporation
- ESG efforts improving; however, reliance on paper-based products raises sustainability concerns amid tightening regulations.
7. Geopolitical Exposure
Unilever PLC
- High exposure to emerging markets and currency fluctuations increases geopolitical risk profile.
Kimberly-Clark Corporation
- More concentrated in North America, limiting geopolitical risk but also growth opportunities.
Which company shows a better risk-adjusted profile?
Unilever’s highest risk lies in its leveraged capital structure coupled with broad geopolitical exposure. Kimberly-Clark’s main risk centers on weaker operational metrics and limited diversification. Despite Unilever’s debt concerns, its Altman Z-Score (4.71) places it firmly in the safe zone, while Kimberly-Clark’s (2.65) remains in the grey zone. I find Unilever’s risk-adjusted profile superior due to stronger financial stability and diversified market presence, though investors should monitor Unilever’s high leverage closely.
Final Verdict: Which stock to choose?
Unilever PLC wields a superpower in its ability to generate strong returns on equity and capital efficiently, signaling value creation amid a challenging macro environment. Its main point of vigilance is the stretched balance sheet and low liquidity ratios, which could pressure short-term resilience. It suits portfolios targeting aggressive growth tempered with a tolerance for leverage risk.
Kimberly-Clark Corporation’s strategic moat lies in its consistent cash flow generation and a stable dividend yield, offering a safer harbor relative to Unilever. Despite recent revenue headwinds, its lower valuation multiples and solid income quality appeal to investors favoring steady income and capital preservation. This makes it a fit for GARP portfolios seeking a balance between growth and safety.
If you prioritize capital efficiency and growth potential, Unilever outshines with its proven ability to create shareholder value despite rising leverage. However, if you seek better stability and income reliability, Kimberly-Clark offers a more conservative profile with recurring cash flows and a defensive income stream. Each presents a nuanced investment case aligned with distinct risk tolerances and strategic goals.
Disclaimer: Investment carries a risk of loss of initial capital. The past performance is not a reliable indicator of future results. Be sure to understand risks before making an investment decision.
Go Further
I encourage you to read the complete analyses of Unilever PLC and Kimberly-Clark Corporation to enhance your investment decisions: