Home > Comparison > Consumer Defensive > PG vs KMB
The strategic rivalry between The Procter & Gamble Company and Kimberly-Clark Corporation shapes the competitive landscape of the household and personal products sector. P&G operates as a diversified consumer defensive behemoth with broad global reach and multiple product segments. Kimberly-Clark, while also in consumer defensives, focuses more narrowly on personal care and tissue products. This analysis will assess which company offers a superior risk-adjusted return potential for diversified portfolios amid ongoing sector challenges.
Table of contents
Companies Overview
The Procter & Gamble Company and Kimberly-Clark Corporation lead the Household & Personal Products sector with distinct market footprints.
The Procter & Gamble Company: Global Consumer Goods Powerhouse
Procter & Gamble dominates with a diversified portfolio across five segments, including Beauty, Grooming, and Health Care. Its core revenue stems from branded consumer packaged goods sold worldwide. In 2026, it emphasizes broad market penetration through mass merchandisers, e-commerce, and specialty channels, leveraging iconic brands like Gillette and Tide.
Kimberly-Clark Corporation: Specialist in Personal Care and Tissue Products
Kimberly-Clark focuses on personal care, consumer tissue, and professional products. It generates revenue primarily from trusted brands such as Huggies and Kleenex, targeting both household and away-from-home markets. The company’s 2026 strategy centers on deepening product innovation and expanding distribution across retail and professional channels.
Strategic Collision: Similarities & Divergences
Both firms compete in personal care and consumer staples, yet Procter & Gamble pursues a multi-segment, global scale approach, while Kimberly-Clark specializes with a sharper brand focus. Their primary battleground lies in retail penetration and brand loyalty. Investors face contrasting profiles: Procter & Gamble offers scale and diversification, Kimberly-Clark presents focused niche leadership.
Income Statement Comparison
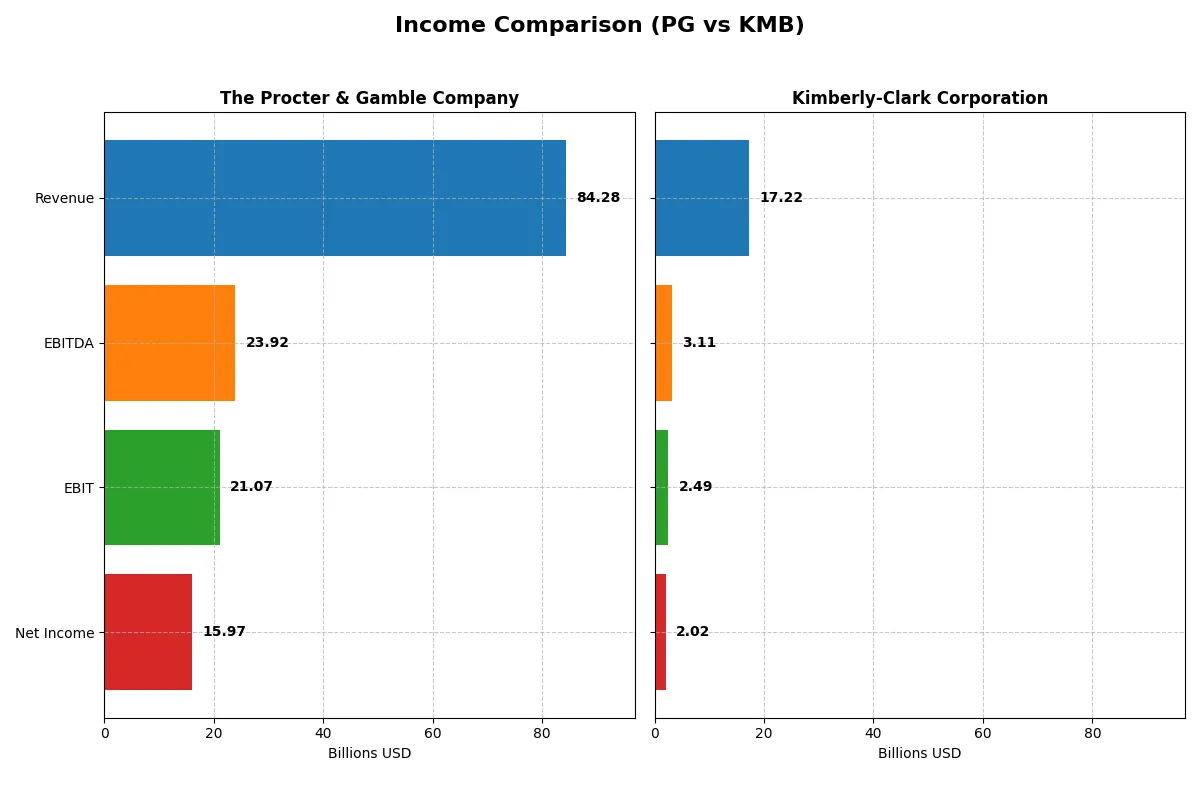
This data dissects the core profitability and scalability of both corporate engines to reveal who dominates the bottom line:
| Metric | The Procter & Gamble Company (PG) | Kimberly-Clark Corporation (KMB) |
|---|---|---|
| Revenue | 84.3B | 17.2B |
| Cost of Revenue | 41.2B | 11.1B |
| Operating Expenses | 22.7B | 3.64B |
| Gross Profit | 43.1B | 6.13B |
| EBITDA | 23.9B | 3.11B |
| EBIT | 21.1B | 2.49B |
| Interest Expense | 907M | 256M |
| Net Income | 15.97B | 2.02B |
| EPS | 6.67 | 6.08 |
| Fiscal Year | 2025 | 2025 |
Income Statement Analysis: The Bottom-Line Duel
This income statement comparison reveals which company converts sales into profits with greater efficiency and momentum in recent years.
The Procter & Gamble Company Analysis
P&G’s revenue steadily grew from 76B in 2021 to 84.3B in 2025, showing resilience in top-line expansion. Net income climbed from 14.3B to 15.9B, lifting net margins to a healthy 18.95%. Its gross margin remains robust above 51%, and EBIT margin hits 25%, reflecting strong cost control and operational efficiency in 2025.
Kimberly-Clark Corporation Analysis
Kimberly-Clark’s revenue declined sharply from 19.4B in 2021 to 17.2B in 2025, marking a 14% revenue drop last year alone. Net income fluctuated but improved to 2.0B in 2025, supporting a modest net margin of 11.7%. Gross margin at 35.6% and EBIT margin at 14.5% lag behind P&G, highlighting pressure on profitability and operational leverage.
Margin Dominance vs. Revenue Scale
P&G dominates with superior margin profiles and consistent revenue growth, showcasing scalable efficiency unmatched by Kimberly-Clark. Despite KMB’s respectable net income growth overall, its declining revenues and weaker profitability metrics mark P&G as the fundamental winner. Investors seeking stable margin power and growth should favor P&G’s profile.
Financial Ratios Comparison
These vital ratios act as a diagnostic tool to expose the underlying fiscal health, valuation premiums, and capital efficiency of the companies compared below:
| Ratios | The Procter & Gamble Company (PG) | Kimberly-Clark Corporation (KMB) |
|---|---|---|
| ROE | 30.7% | 3.03% |
| ROIC | 16.5% | 25.3% |
| P/E | 24.5 | 16.6 |
| P/B | 7.52 | 0 (not reported) |
| Current Ratio | 0.70 | 0.00 (not reported) |
| Quick Ratio | 0.49 | 0.00 (not reported) |
| D/E | 0.68 | 0.00 (not reported) |
| Debt-to-Assets | 28.3% | 0.00 (not reported) |
| Interest Coverage | 22.5 | 9.72 |
| Asset Turnover | 0.67 | 0.00 (not reported) |
| Fixed Asset Turnover | 3.53 | 0.00 (not reported) |
| Payout ratio | 61.8% | 82.1% |
| Dividend yield | 2.52% | 4.94% |
| Fiscal Year | 2025 | 2025 |
Efficiency & Valuation Duel: The Vital Signs
Financial ratios act as a company’s DNA, revealing hidden risks and operational excellence that shape investor decisions.
The Procter & Gamble Company
Procter & Gamble posts a strong 30.7% ROE and an impressive 18.95% net margin, signaling robust profitability. Its P/E ratio of 24.5 indicates a fairly valued stock, while a high P/B ratio of 7.5 suggests some premium pricing. The company sustains shareholder returns with a 2.5% dividend yield, reflecting disciplined capital allocation.
Kimberly-Clark Corporation
Kimberly-Clark shows a favorable 11.7% net margin but reports zero ROE and ROIC, signaling data gaps or structural issues. Its P/E of 16.6 appears reasonable, and a 4.9% dividend yield offers attractive income. However, missing key ratios and a lack of leverage data introduce uncertainty over operational efficiency and risk.
Premium Valuation vs. Mixed Signals
P&G delivers a clearer balance of profitability and valuation with substantial shareholder rewards. Kimberly-Clark’s incomplete ratio set weakens confidence despite better dividend yield. Investors seeking operational clarity and stable returns may lean toward P&G, while income-focused profiles might consider Kimberly-Clark’s yield merits.
Which one offers the Superior Shareholder Reward?
I observe that Kimberly-Clark (KMB) delivers a higher dividend yield at 4.94% versus Procter & Gamble’s (PG) 2.52%. However, PG’s payout ratio is more conservative, around 62%, compared to KMB’s 82%, suggesting PG’s dividend is more sustainable. PG also balances this with steady buybacks, enhancing total shareholder return. KMB’s payout ratio near 82% raises red flags about dividend safety, despite its appealing yield. PG’s disciplined capital allocation, combining dividends with share repurchases funded by strong free cash flow (~$7B), offers a more reliable, long-term total return. I conclude PG provides the superior shareholder reward in 2026, balancing yield, buybacks, and sustainability more prudently than KMB.
Comparative Score Analysis: The Strategic Profile
The radar chart reveals the fundamental DNA and trade-offs of both firms, highlighting where each excels and where vulnerabilities exist:
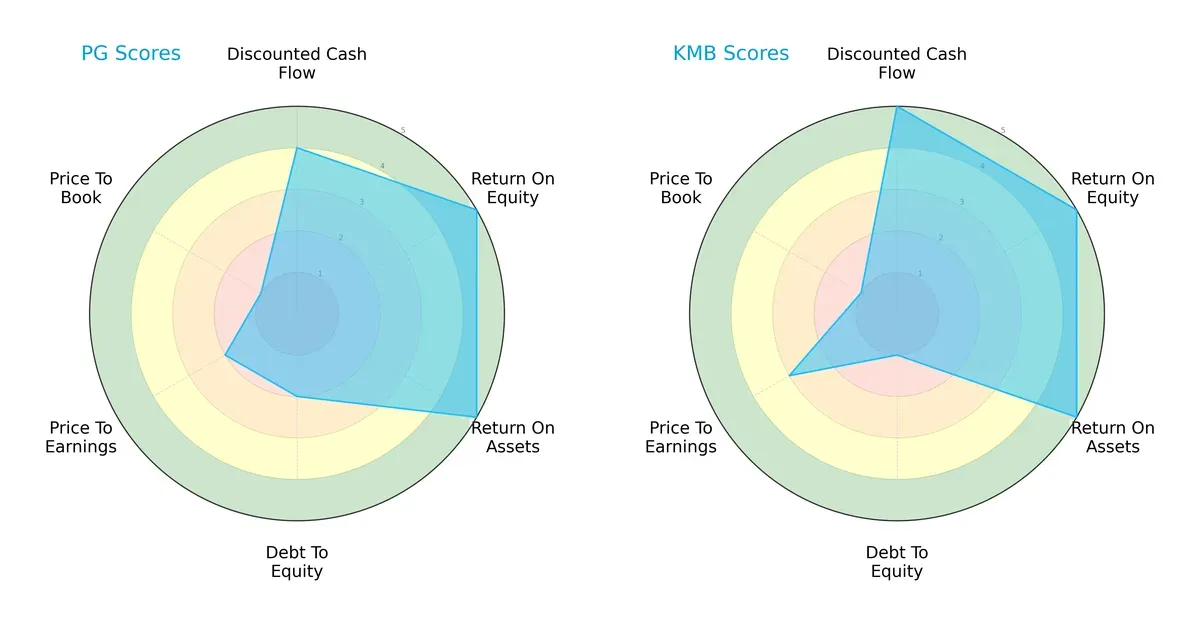
Kimberly-Clark (KMB) boasts a more balanced profile with top scores in DCF, ROE, and ROA, reflecting superior cash flow visibility and operational efficiency. Procter & Gamble (PG) shows strength in ROE and ROA but lags in debt management and valuation metrics. PG relies more on profitability edges, while KMB combines efficiency with financial prudence.
Bankruptcy Risk: Solvency Showdown
The Altman Z-Score delta highlights a clear solvency advantage for Procter & Gamble, signaling a safer long-term survival outlook in this cycle:
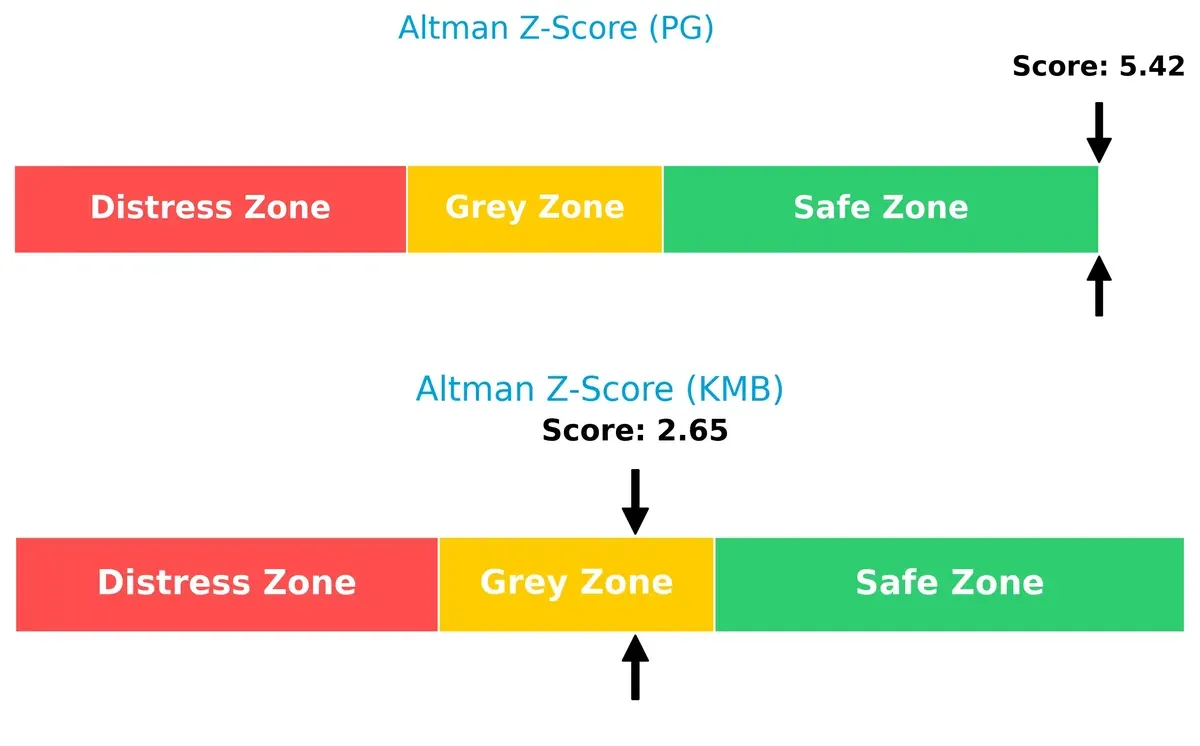
PG’s score above 5.4 places it securely in the safe zone, whereas KMB’s 2.65 score signals caution in the grey zone, implying greater bankruptcy risk amid economic stress.
Financial Health: Quality of Operations
Kimberly-Clark’s Piotroski F-Score of 7 versus Procter & Gamble’s 4 signals stronger internal financial health and operational quality for KMB:
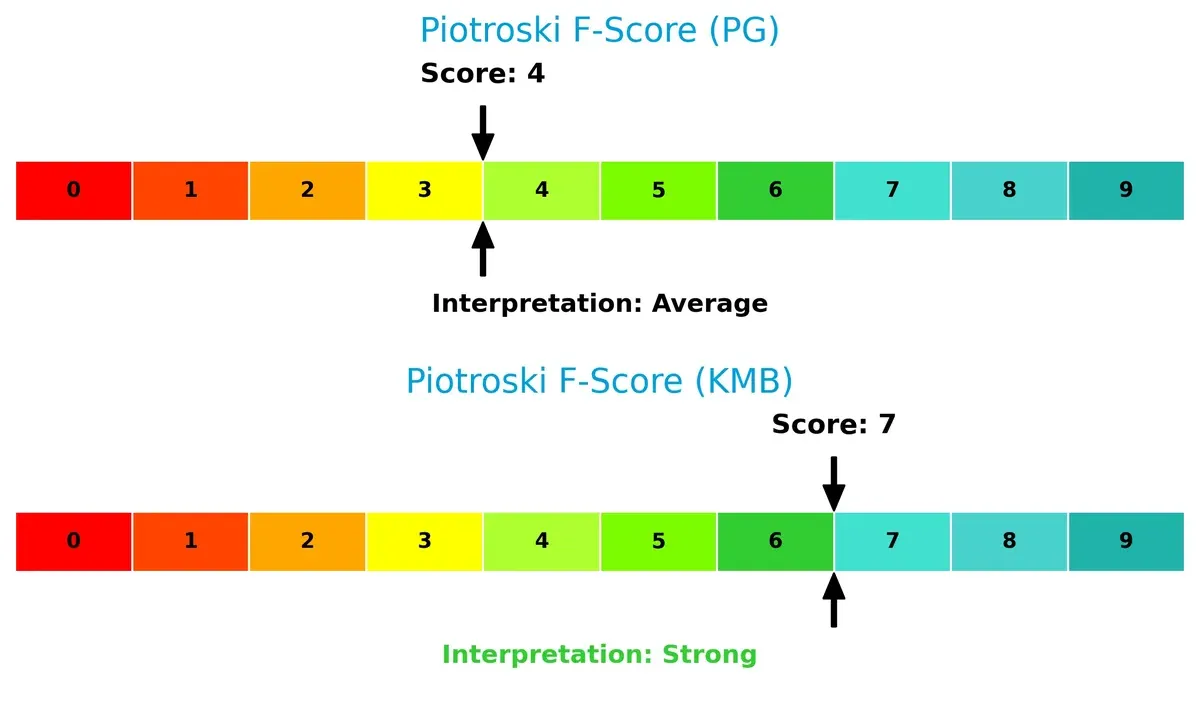
KMB’s score reflects robust profitability and balance sheet efficiency. PG’s average score raises red flags on internal metrics, suggesting room for improvement in financial discipline and cash flow generation.
How are the two companies positioned?
This section dissects the operational DNA of PG and KMB by comparing their revenue distribution by segment and examining their internal strengths and weaknesses. The final goal is to confront their economic moats to reveal which model delivers the most resilient, sustainable advantage in today’s market.
Revenue Segmentation: The Strategic Mix
The following comparison dissects how The Procter & Gamble Company and Kimberly-Clark Corporation diversify their income streams and where their primary sector bets lie:
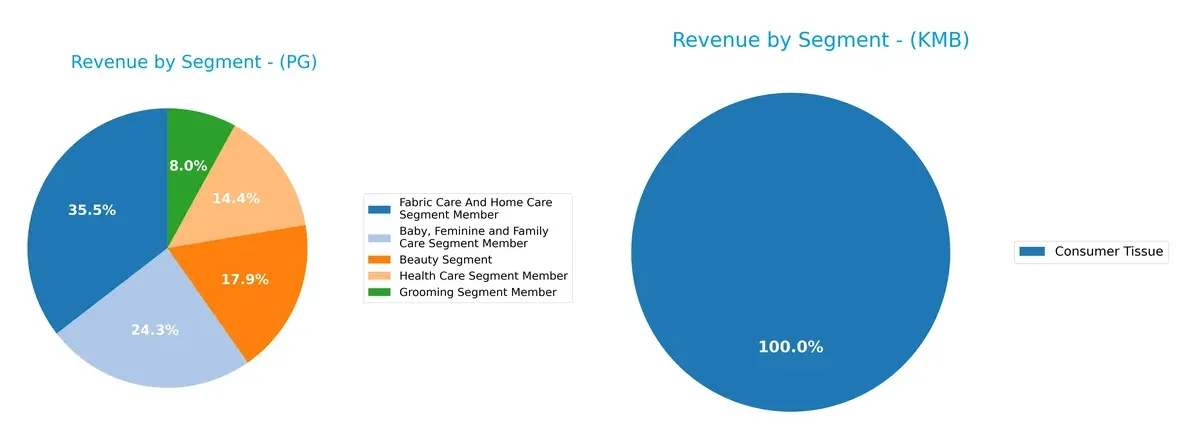
Procter & Gamble anchors revenue in Fabric Care & Home Care at $29.6B, with substantial contributions from Baby, Feminine & Family Care ($20.2B) and Beauty ($14.96B). Kimberly-Clark leans heavily on Personal Care at $10.7B and Consumer Tissue at $6.16B, showing less segment diversity. P&G’s broad portfolio reduces concentration risk, enhancing ecosystem lock-in. In contrast, Kimberly-Clark’s narrower mix increases vulnerability to shifts in a few categories.
Strengths and Weaknesses Comparison
This table compares the strengths and weaknesses of The Procter & Gamble Company (PG) and Kimberly-Clark Corporation (KMB):
PG Strengths
- Diverse product segments with strong revenue in five categories
- High profitability with 18.95% net margin and 30.71% ROE
- Favorable capital efficiency with 16.47% ROIC above 5.36% WACC
- Balanced global presence with nearly equal US and Non-US sales
- Strong interest coverage at 23.23 and moderate debt levels
KMB Strengths
- Focused product lines with significant Consumer Tissue and Personal Care sales
- Positive net margin of 11.74% and favorable dividend yield at 4.94%
- Low debt levels with favorable debt-to-assets and debt-to-equity ratios
- Reasonable interest coverage at 9.73 supports debt servicing
- Favorable price-to-book valuation
PG Weaknesses
- Weak liquidity with current ratio at 0.7 and quick ratio at 0.49
- Unfavorable high price-to-book ratio at 7.52
- Neutral asset turnover at 0.67 could indicate moderate efficiency
KMB Weaknesses
- Zero reported ROE and ROIC raise concerns on capital returns
- Missing WACC data limits valuation precision
- Unfavorable liquidity ratios with current and quick ratios at 0
- Asset turnover and fixed asset turnover not reported, indicating possible operational challenges
PG benefits from broad diversification and strong profitability metrics, but faces liquidity and valuation pressure. KMB shows strengths in focused product lines and conservative leverage but suffers from weak reported returns and incomplete financial data. These factors shape their respective strategic priorities.
The Moat Duel: Analyzing Competitive Defensibility
A structural moat is the only thing protecting long-term profits from the erosion of competition. Let’s examine how two consumer giants defend their turf:
The Procter & Gamble Company: Brand Power and Operational Excellence
P&G’s moat stems from its intangible assets—strong brands like Gillette and Tide—and cost advantages. This reflects in a robust 25% EBIT margin and 11% ROIC above WACC. Its expanding global reach and innovation pipeline in personal care deepen this moat in 2026.
Kimberly-Clark Corporation: Focused Product Niches and Distribution
Kimberly-Clark relies on specialized personal care products and professional channels, contrasting P&G’s breadth. However, it suffers from declining ROIC and weaker margin profiles, signaling a shrinking moat. Growth constraints and revenue declines pose risks in 2026, limiting expansion opportunities.
Market Dominance vs. Niche Specialization: The Moat Verdict
P&G’s wider and deepening moat outclasses Kimberly-Clark’s narrowing defenses. Its scale, brand equity, and rising profitability better shield market share amid intensifying competition. I see P&G as more equipped to sustain long-term value creation.
Which stock offers better returns?
The past year reveals contrasting dynamics: The Procter & Gamble Company shows a bearish trend with recent bullish acceleration, while Kimberly-Clark Corporation faces a pronounced bearish trend with decelerating losses.
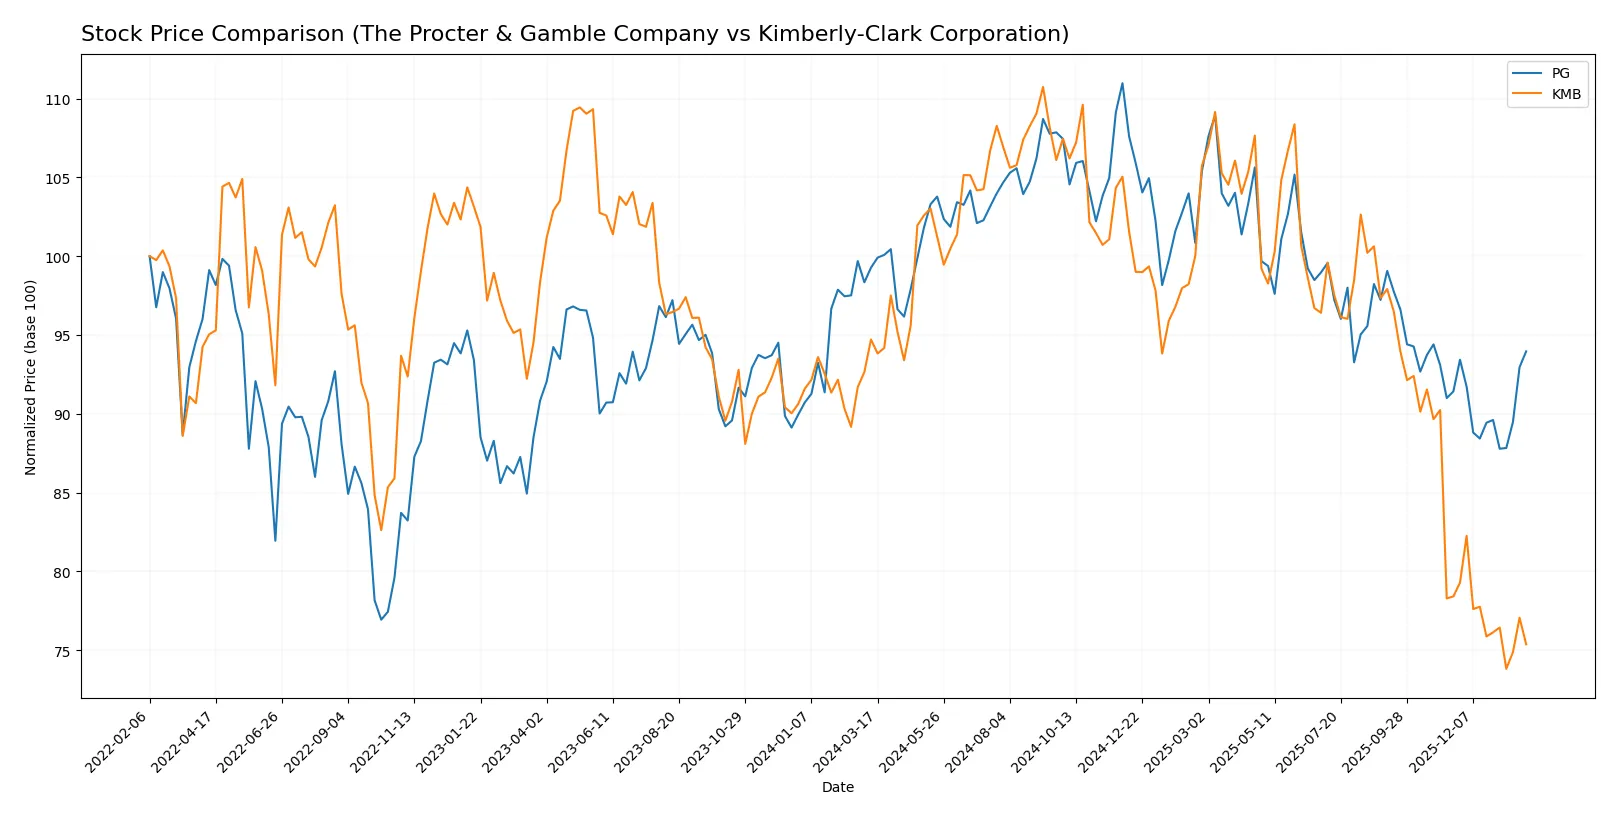
Trend Comparison
The Procter & Gamble Company’s stock declined 5.35% over the past 12 months, marking a bearish trend with accelerating negative momentum and a high volatility of 8.85%. The price ranged between 141.79 and 179.26.
Kimberly-Clark Corporation experienced a steeper 20.42% drop in the same period, confirming a bearish trend with decelerating losses and greater volatility at 12.48%. The price fluctuated from 97.92 to 146.91.
Between the two, The Procter & Gamble Company outperformed Kimberly-Clark with a smaller decline and recent signs of positive momentum.
Target Prices
Analysts present a cautiously optimistic target consensus for Procter & Gamble and Kimberly-Clark.
| Company | Target Low | Target High | Consensus |
|---|---|---|---|
| The Procter & Gamble Company | 150 | 179 | 165.67 |
| Kimberly-Clark Corporation | 102 | 162 | 122.38 |
The consensus target prices for both stocks exceed current market prices, signaling moderate upside potential. Procter & Gamble’s target consensus at 165.67 suggests a 9% premium over its 151.77 price, while Kimberly-Clark’s 122.38 target implies a 22% upside from 99.99.

Don’t Let Luck Decide Your Entry Point
Optimize your entry points with our advanced ProRealTime indicators. You’ll get efficient buy signals with precise price targets for maximum performance. Start outperforming now!
How do institutions grade them?
The Procter & Gamble Company Grades
The latest institutional grades for The Procter & Gamble Company are as follows:
| Grading Company | Action | New Grade | Date |
|---|---|---|---|
| TD Cowen | Downgrade | Hold | 2026-01-27 |
| Wells Fargo | Maintain | Overweight | 2026-01-23 |
| JP Morgan | Upgrade | Overweight | 2026-01-23 |
| UBS | Maintain | Buy | 2026-01-23 |
| UBS | Maintain | Buy | 2026-01-14 |
| TD Cowen | Maintain | Buy | 2026-01-08 |
| Wells Fargo | Maintain | Overweight | 2026-01-05 |
| JP Morgan | Maintain | Neutral | 2025-12-18 |
| Jefferies | Upgrade | Buy | 2025-12-17 |
| JP Morgan | Maintain | Neutral | 2025-10-27 |
Kimberly-Clark Corporation Grades
The latest institutional grades for Kimberly-Clark Corporation are as follows:
| Grading Company | Action | New Grade | Date |
|---|---|---|---|
| UBS | Maintain | Neutral | 2026-01-28 |
| Citigroup | Maintain | Sell | 2026-01-14 |
| UBS | Maintain | Neutral | 2026-01-14 |
| TD Cowen | Maintain | Hold | 2026-01-08 |
| Wells Fargo | Maintain | Equal Weight | 2026-01-05 |
| Citigroup | Maintain | Sell | 2025-12-17 |
| BNP Paribas Exane | Maintain | Neutral | 2025-12-01 |
| Argus Research | Upgrade | Buy | 2025-11-13 |
| Wells Fargo | Maintain | Equal Weight | 2025-11-04 |
| Evercore ISI Group | Downgrade | In Line | 2025-11-04 |
Which company has the best grades?
The Procter & Gamble Company holds generally stronger grades, including multiple Buy and Overweight ratings. Kimberly-Clark’s grades lean toward Neutral, Hold, and Sell. Investors may view P&G’s higher grades as a sign of greater analyst confidence.
Risks specific to each company
The following categories identify the critical pressure points and systemic threats facing both firms in the 2026 market environment:
1. Market & Competition
The Procter & Gamble Company
- Dominates with a $355B market cap and robust brand portfolio, but faces intense FMCG competition.
Kimberly-Clark Corporation
- Smaller $33B market cap limits scale; competes in niche personal care and tissue segments.
2. Capital Structure & Debt
The Procter & Gamble Company
- Moderate leverage with 0.68 debt/equity; strong interest coverage at 23.23x.
Kimberly-Clark Corporation
- Reported zero debt/equity but low transparency; interest coverage at 9.73x suggests manageable risk.
3. Stock Volatility
The Procter & Gamble Company
- Low beta at 0.38 signals defensive stability; tight trading range $138-$180.
Kimberly-Clark Corporation
- Even lower beta 0.277, indicating less volatility; wider range $96-$150 reflects episodic price swings.
4. Regulatory & Legal
The Procter & Gamble Company
- Operates globally with exposure to consumer safety regulations; well-prepared for compliance.
Kimberly-Clark Corporation
- Similar exposure but smaller scale may limit legal resource flexibility amid increasing regulations.
5. Supply Chain & Operations
The Procter & Gamble Company
- Complex global supply chain; benefits from scale but exposed to geopolitical disruptions.
Kimberly-Clark Corporation
- Leaner operations reduce complexity but could face supply shocks without scale buffers.
6. ESG & Climate Transition
The Procter & Gamble Company
- Progressive ESG initiatives; critical to maintaining consumer trust and regulatory goodwill.
Kimberly-Clark Corporation
- Strong ESG focus needed to keep pace; smaller size may hinder rapid transition investments.
7. Geopolitical Exposure
The Procter & Gamble Company
- Significant global footprint exposes PG to trade tensions and currency risks.
Kimberly-Clark Corporation
- More concentrated market presence limits exposure but also growth opportunities abroad.
Which company shows a better risk-adjusted profile?
The Procter & Gamble Company contends with scale-driven complexities but boasts strong financial health and market dominance. Kimberly-Clark faces risks from limited scale and weaker operational metrics, though it benefits from lower volatility. PG’s Altman Z-Score firmly places it in the safe zone, unlike KMB’s grey zone, signaling higher financial resilience. PG’s superior interest coverage and broader diversification justify its edge in risk-adjusted stability despite some liquidity red flags.
Final Verdict: Which stock to choose?
The Procter & Gamble Company (PG) excels as a cash-generating powerhouse with a durable competitive advantage, proven by its rising ROIC well above WACC. Its main point of vigilance remains a strained liquidity position, which could pressure short-term operations. PG suits portfolios focused on resilient, long-term value and moderate growth.
Kimberly-Clark Corporation (KMB) offers a strategic moat rooted in strong brand loyalty and consistent dividend yield, appealing for income-focused investors. It carries greater financial risk given its weaker liquidity and more volatile recent performance compared to PG. KMB fits well in a GARP portfolio seeking steady income with moderate growth potential.
If you prioritize durable competitive advantage and operational efficiency, PG outshines with its superior value creation and stability. However, if you seek higher dividend income with a tolerance for financial risk, KMB offers an attractive yield and brand moat. Both present distinct analytical scenarios suited to different investor profiles.
Disclaimer: Investment carries a risk of loss of initial capital. The past performance is not a reliable indicator of future results. Be sure to understand risks before making an investment decision.
Go Further
I encourage you to read the complete analyses of The Procter & Gamble Company and Kimberly-Clark Corporation to enhance your investment decisions: