Home > Comparison > Consumer Defensive > EL vs KMB
The strategic rivalry between The Estée Lauder Companies Inc. and Kimberly-Clark Corporation shapes the consumer defensive sector’s landscape. Estée Lauder excels as a premium, innovation-driven personal products leader. Kimberly-Clark operates as a broad-based, volume-focused manufacturer of personal care and tissue essentials. This head-to-head contrasts growth through brand prestige versus stable cash flow dominance. This analysis identifies which trajectory offers superior risk-adjusted returns for a diversified portfolio in 2026.

Table of contents
Companies Overview
The Estée Lauder Companies and Kimberly-Clark Corporation lead global personal and household products markets with distinct brand portfolios.
The Estée Lauder Companies Inc.: Luxury Beauty Powerhouse
The Estée Lauder Companies dominates the premium skincare and cosmetics market. It generates revenue primarily through its extensive lineup of makeup, skincare, hair care, and fragrance products sold globally under prestigious brands like MAC and Clinique. In 2026, the company focuses on expanding digital sales channels and innovating clean beauty formulas to capture evolving consumer preferences.
Kimberly-Clark Corporation: Essential Consumer Staples Leader
Kimberly-Clark Corporation excels in personal care and consumer tissue products with a broad brand portfolio including Huggies and Kleenex. Its revenue stream stems from disposable diapers, feminine care, and professional hygiene supplies distributed worldwide. The strategic emphasis for 2026 lies in enhancing supply chain efficiency and growing away-from-home product sales in commercial sectors.
Strategic Collision: Similarities & Divergences
Both firms operate in the Household & Personal Products industry but diverge sharply in business models. Estée Lauder pursues a high-margin, brand-driven, luxury approach, while Kimberly-Clark targets mass-market essentials with scale efficiencies. Their competition centers on consumer loyalty and channel expansion. Investors face contrasting risk profiles: Estée Lauder bets on premium innovation; Kimberly-Clark relies on steady demand for staples.
Income Statement Comparison
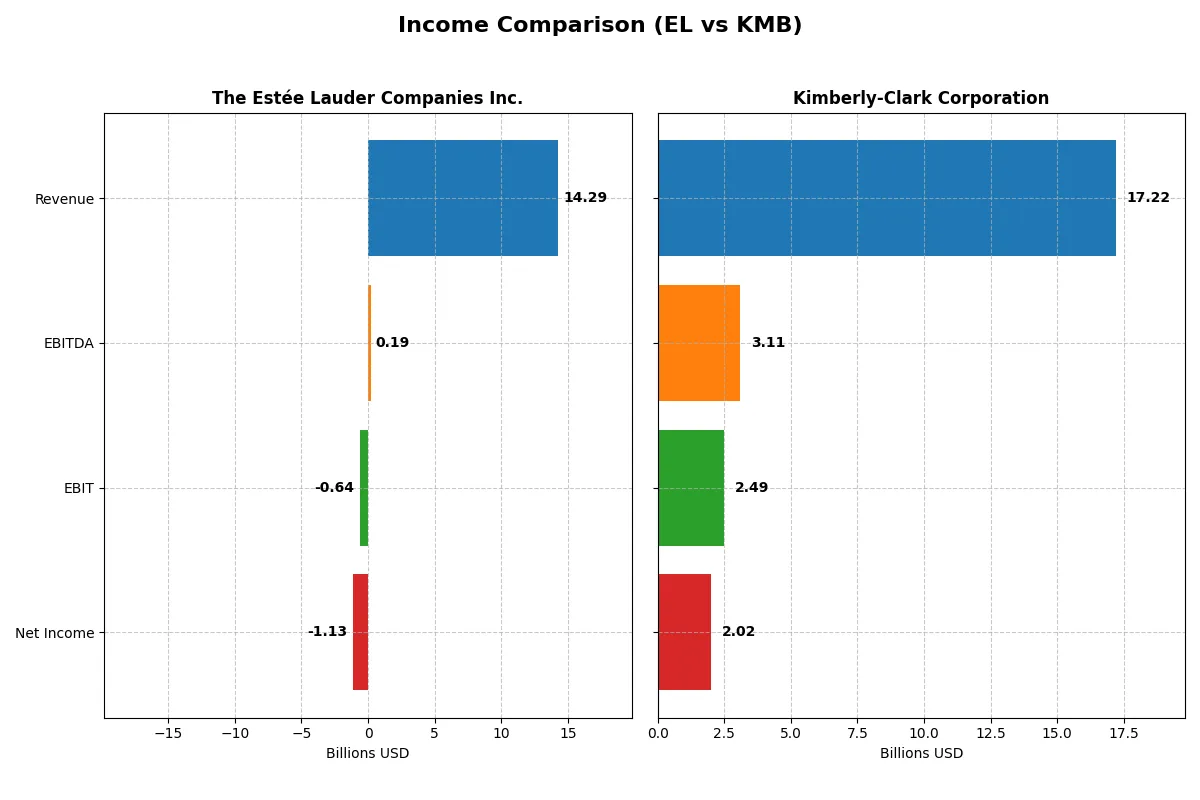
The following data dissects the core profitability and scalability of both corporate engines to reveal who dominates the bottom line:
| Metric | The Estée Lauder Companies Inc. (EL) | Kimberly-Clark Corporation (KMB) |
|---|---|---|
| Revenue | 14.3B | 17.2B |
| Cost of Revenue | 3.7B | 11.1B |
| Operating Expenses | 9.6B | 3.6B |
| Gross Profit | 10.6B | 6.1B |
| EBITDA | 193M | 3.1B |
| EBIT | -636M | 2.5B |
| Interest Expense | 404M | 256M |
| Net Income | -1.1B | 2.0B |
| EPS | -3.15 | 6.08 |
| Fiscal Year | 2025 | 2025 |
Income Statement Analysis: The Bottom-Line Duel
This income statement comparison reveals which company runs its operations more efficiently and sustainably over recent years.
The Estée Lauder Companies Inc. Analysis
Estée Lauder’s revenue shrank from 17.7B in 2022 to 14.3B in 2025, with net income plunging into a 1.13B loss in the latest year. Despite a strong gross margin near 74%, the net margin turned deeply negative at -7.93%, reflecting rising operating expenses and unfavorable EBIT margins. Momentum reversed sharply in 2025, signaling operational challenges.
Kimberly-Clark Corporation Analysis
Kimberly-Clark’s revenue declined from 20.2B in 2022 to 17.2B in 2025, yet net income improved to 2.02B, supported by a solid 11.74% net margin and 14.47% EBIT margin. Its gross margin stands at 35.6%, lower but stable. Despite a recent revenue dip, Kimberly-Clark shows healthier profitability and better expense control, sustaining positive earnings growth.
Margin Strength vs. Revenue Decline
Kimberly-Clark outperforms Estée Lauder in margin quality and net income resilience despite similar revenue contractions. Estée Lauder’s sharp net losses and negative EBIT margin mark operational inefficiency. Investors seeking stable profits and margin robustness may favor Kimberly-Clark’s consistent bottom-line growth over Estée Lauder’s volatile and deteriorating earnings profile.
Financial Ratios Comparison
These vital ratios act as a diagnostic tool to expose the underlying fiscal health, valuation premiums, and capital efficiency of the companies compared below:
| Ratios | The Estée Lauder Companies Inc. (EL) | Kimberly-Clark Corporation (KMB) |
|---|---|---|
| ROE | -29.3% (2025) | 0% (2025) |
| ROIC | 6.4% (2025) | 0% (2025) |
| P/E | -25.7 (2025) | 16.6 (2025) |
| P/B | 7.53 (2025) | 0 (2025) |
| Current Ratio | 1.30 (2025) | 0 (2025) |
| Quick Ratio | 0.92 (2025) | 0 (2025) |
| D/E (Debt-to-Equity) | 2.44 (2025) | 0 (2025) |
| Debt-to-Assets | 47.5% (2025) | 0% (2025) |
| Interest Coverage | 2.37 (2025) | 9.72 (2025) |
| Asset Turnover | 0.72 (2025) | 0 (2025) |
| Fixed Asset Turnover | 2.79 (2025) | 0 (2025) |
| Payout ratio | -54.5% (2025) | 82.1% (2025) |
| Dividend yield | 2.12% (2025) | 4.94% (2025) |
| Fiscal Year | 2025 | 2025 |
Efficiency & Valuation Duel: The Vital Signs
Ratios act as a company’s DNA, revealing hidden risks and operational excellence beyond surface-level financials.
The Estée Lauder Companies Inc.
Estée Lauder shows weak profitability with a -29.31% ROE and negative net margin at -7.93%. Its valuation appears favorable on P/E but stretched on price-to-book at 7.53. The company delivers modest shareholder returns via a 2.12% dividend yield, balancing reinvestment in R&D and growth amid operational challenges.
Kimberly-Clark Corporation
Kimberly-Clark posts a solid net margin of 11.74% with a neutral P/E of 16.63, signaling reasonable valuation. Despite a zero ROE figure, it maintains strong interest coverage at 9.73 and offers a generous 4.94% dividend yield. The firm’s capital structure and dividend policy reflect operational stability and shareholder focus.
Valuation and Profitability: Risk vs. Stability
Kimberly-Clark offers a better balance between profitability and shareholder returns despite some missing ratio data. Estée Lauder’s negative returns and stretched valuation suggest higher risk. Investors seeking stability and income may prefer Kimberly-Clark’s profile, while those tolerating risk must weigh Estée Lauder’s growth potential carefully.
Which one offers the Superior Shareholder Reward?
I see Estée Lauder (EL) pays a modest 2.1% dividend yield with a negative payout ratio in 2025, signaling a recent earnings dip. Its free cash flow per share of $1.86 supports dividends but limits aggressive payout. Buybacks appear restrained amid high leverage (debt/equity 2.44). Kimberly-Clark (KMB) yields a robust 4.94% with a stable 82% payout ratio, fully covered by free cash flow of $8.34 per share. KMB’s consistent buyback alongside strong operating margins and lower leverage enhances total return. I conclude Kimberly-Clark offers a more attractive, sustainable shareholder reward in 2026.
Comparative Score Analysis: The Strategic Profile
The radar chart reveals the fundamental DNA and trade-offs of The Estée Lauder Companies Inc. and Kimberly-Clark Corporation:
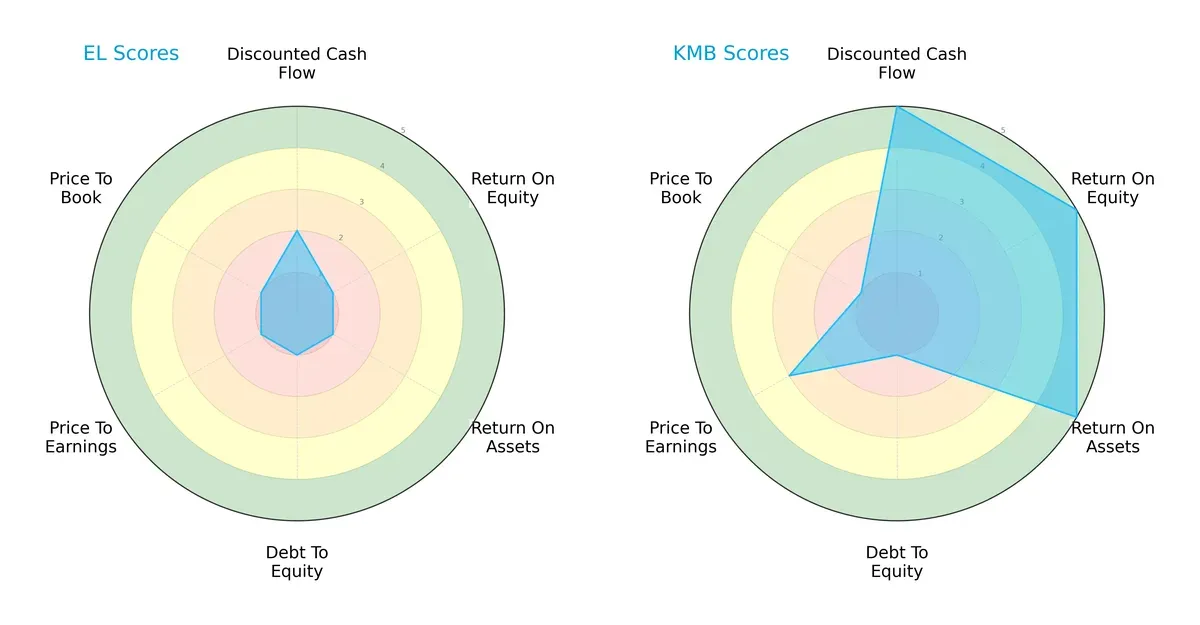
Kimberly-Clark dominates in cash flow, ROE, and ROA, showing operational efficiency. However, it carries higher financial risk with a weak debt-to-equity score. Estée Lauder’s profile is unbalanced, lagging across all key metrics, relying on minimal DCF strength but suffering from valuation and leverage issues.
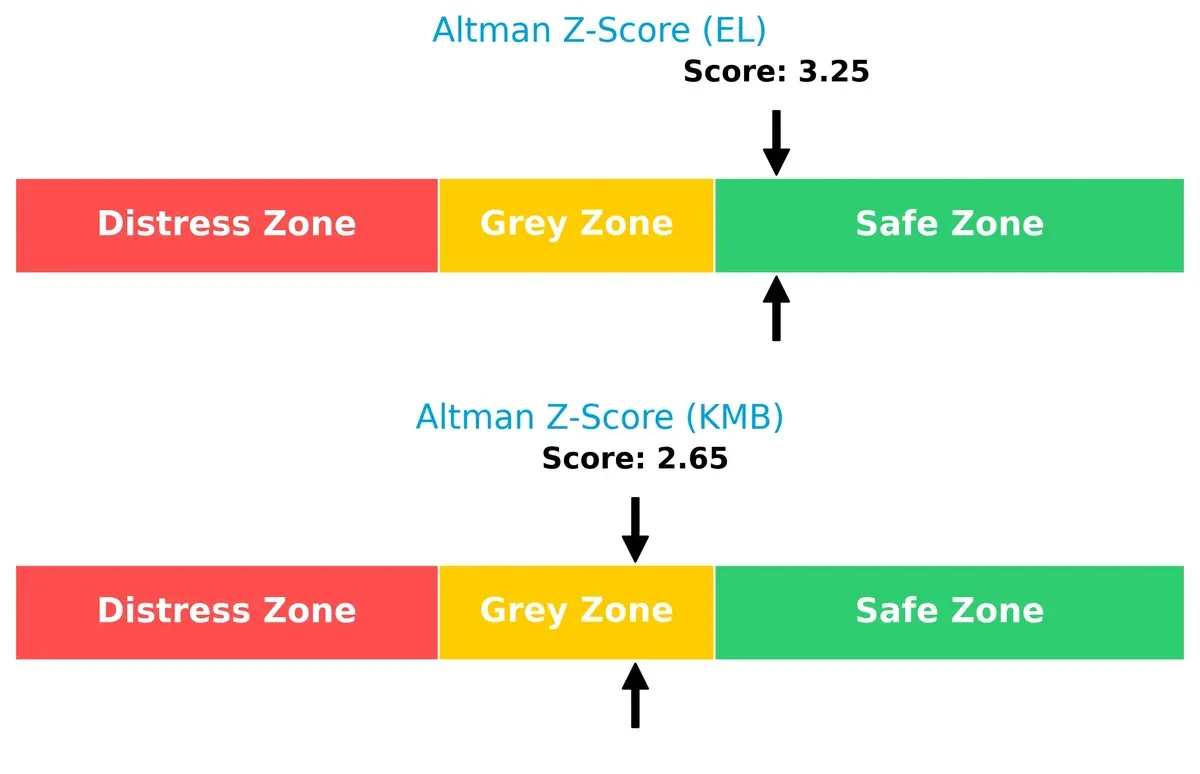
Bankruptcy Risk: Solvency Showdown
Kimberly-Clark’s Altman Z-Score at 2.65 places it in the grey zone, signaling moderate bankruptcy risk. Estée Lauder’s safer 3.25 score indicates stronger resilience in this cycle:
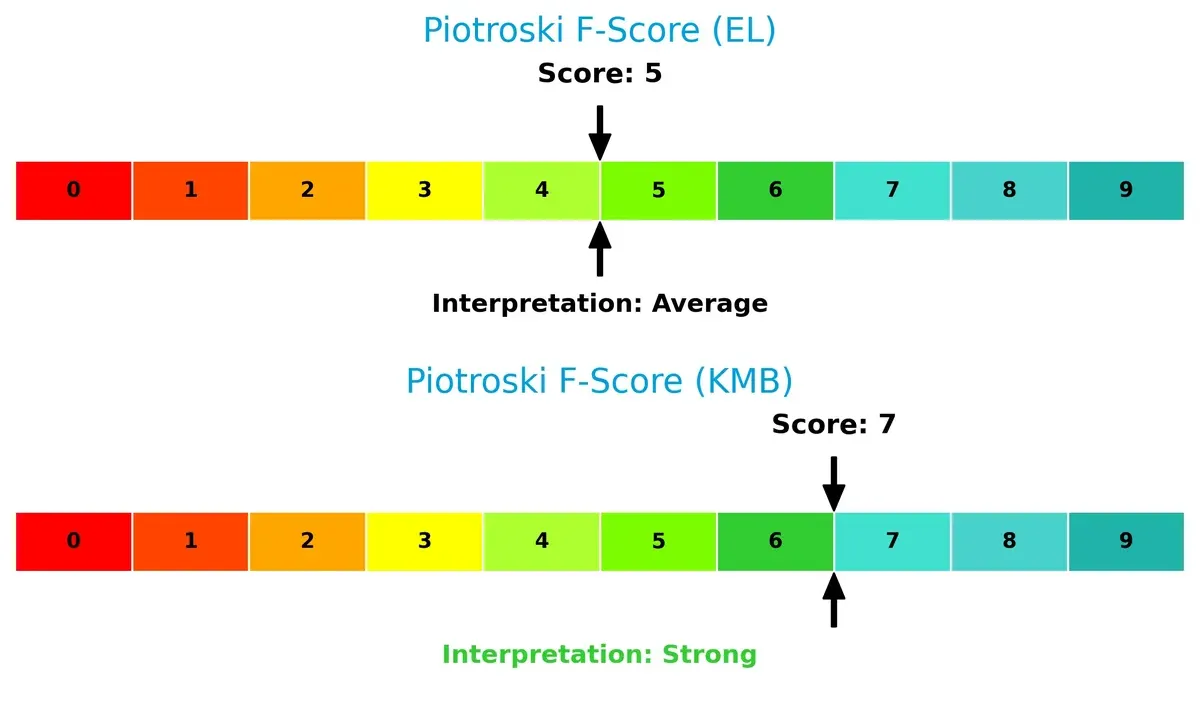
Financial Health: Quality of Operations
Kimberly-Clark’s Piotroski F-Score of 7 signals strong internal financial health. Estée Lauder’s average score of 5 flags some operational weaknesses, highlighting potential red flags in profitability and efficiency:
How are the two companies positioned?
This section dissects EL and KMB’s operational DNA by comparing their revenue distribution and internal strengths and weaknesses. The goal is to confront their economic moats to determine which model offers the most resilient competitive advantage today.
Revenue Segmentation: The Strategic Mix
This visual comparison dissects how The Estée Lauder Companies Inc. and Kimberly-Clark Corporation diversify income streams and where their primary sector bets lie:
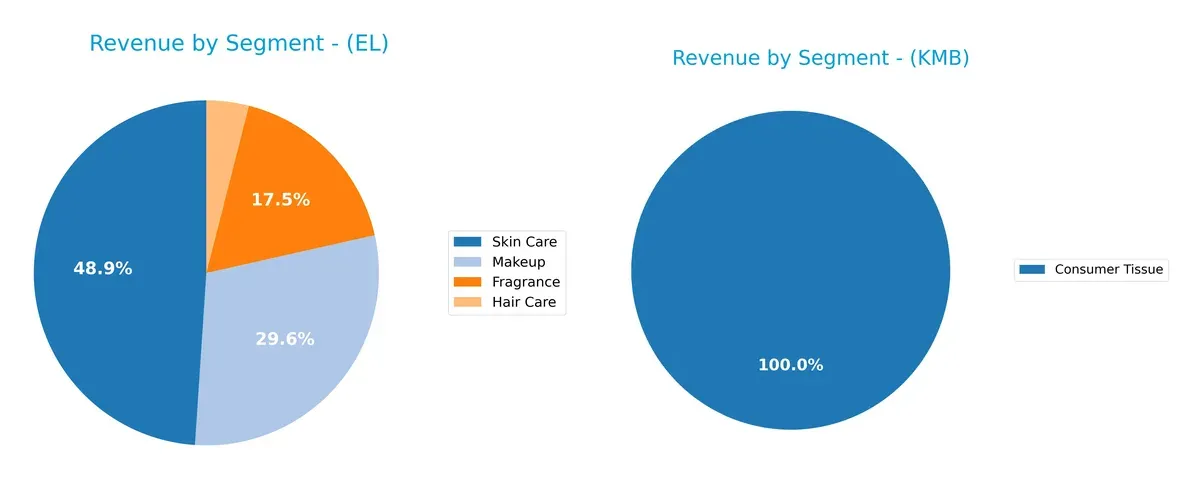
Estée Lauder anchors revenue in Skin Care with $6.96B, followed by Makeup at $4.21B, showing moderate diversification across four segments. Kimberly-Clark pivots on Personal Care at $10.7B, dwarfing Consumer Tissue ($6.16B) and K-C Professional ($3.4B), revealing concentration risk. Estée Lauder’s balanced mix supports ecosystem lock-in, while Kimberly-Clark’s dominance in Personal Care suggests infrastructure strength but heavier reliance on one segment.
Strengths and Weaknesses Comparison
This table compares the Strengths and Weaknesses of The Estée Lauder Companies Inc. and Kimberly-Clark Corporation:
EL Strengths
- Diversified product segments across Skin Care, Makeup, Fragrance, and Hair Care
- Strong global presence in US, Asia Pacific, and EMEA
- Neutral ROIC close to WACC supports steady capital efficiency
KMB Strengths
- Favorable net margin and dividend yield indicate solid profitability
- Low debt levels and strong interest coverage enhance financial stability
- Broad geographic reach including US, Asia, Latin America, Canada, and Europe
EL Weaknesses
- Negative net margin and ROE reflect profitability challenges
- Unfavorable debt to equity ratio and interest coverage raise financial risks
- High price-to-book ratio suggests overvaluation concerns
KMB Weaknesses
- Unfavorable ROE and ROIC imply inefficient capital allocation
- Lack of current and quick ratios data signals liquidity concerns
- Weak asset turnover metrics may hinder operational efficiency
The Estée Lauder’s strengths lie in product and geographic diversification but face profitability and leverage challenges. Kimberly-Clark shows financial stability and profitability but struggles with capital efficiency and operational metrics, highlighting differing strategic priorities.
The Moat Duel: Analyzing Competitive Defensibility
A structural moat alone shields long-term profits from relentless competition and market pressures. Let’s dissect the competitive foundations of these two giants:
The Estée Lauder Companies Inc.: Intangible Assets Powerhouse
Estee Lauder’s moat stems from its premium brand portfolio and strong intangible assets. It historically delivers high gross margins near 74%, reflecting brand pricing power. Yet, declining ROIC and negative net margins signal erosion. New product innovations and emerging markets could stabilize or deepen this advantage in 2026.
Kimberly-Clark Corporation: Cost Advantage and Scale Efficiency
Kimberly-Clark relies on scale and cost advantages in personal care and tissue segments. It sustains favorable EBIT and net margins around 14.5% and 11.7%, respectively, outperforming Estée Lauder’s profitability. Despite recent revenue headwinds, its efficient capital use and broad distribution offer expansion opportunities, particularly in emerging markets.
Brand Equity vs. Operational Scale: The Moat Face-Off
Kimberly-Clark boasts a wider moat through consistent profitability and cost leadership. Estée Lauder’s intangible assets remain valuable but show vulnerability due to declining returns. I view Kimberly-Clark as better positioned to defend and grow its market share in 2026.
Which stock offers better returns?
The past year shows contrasting dynamics: The Estée Lauder Companies Inc. experienced a sharp 23% decline with accelerating losses, while Kimberly-Clark Corporation saw a milder 20% drop amid decelerating downside momentum.
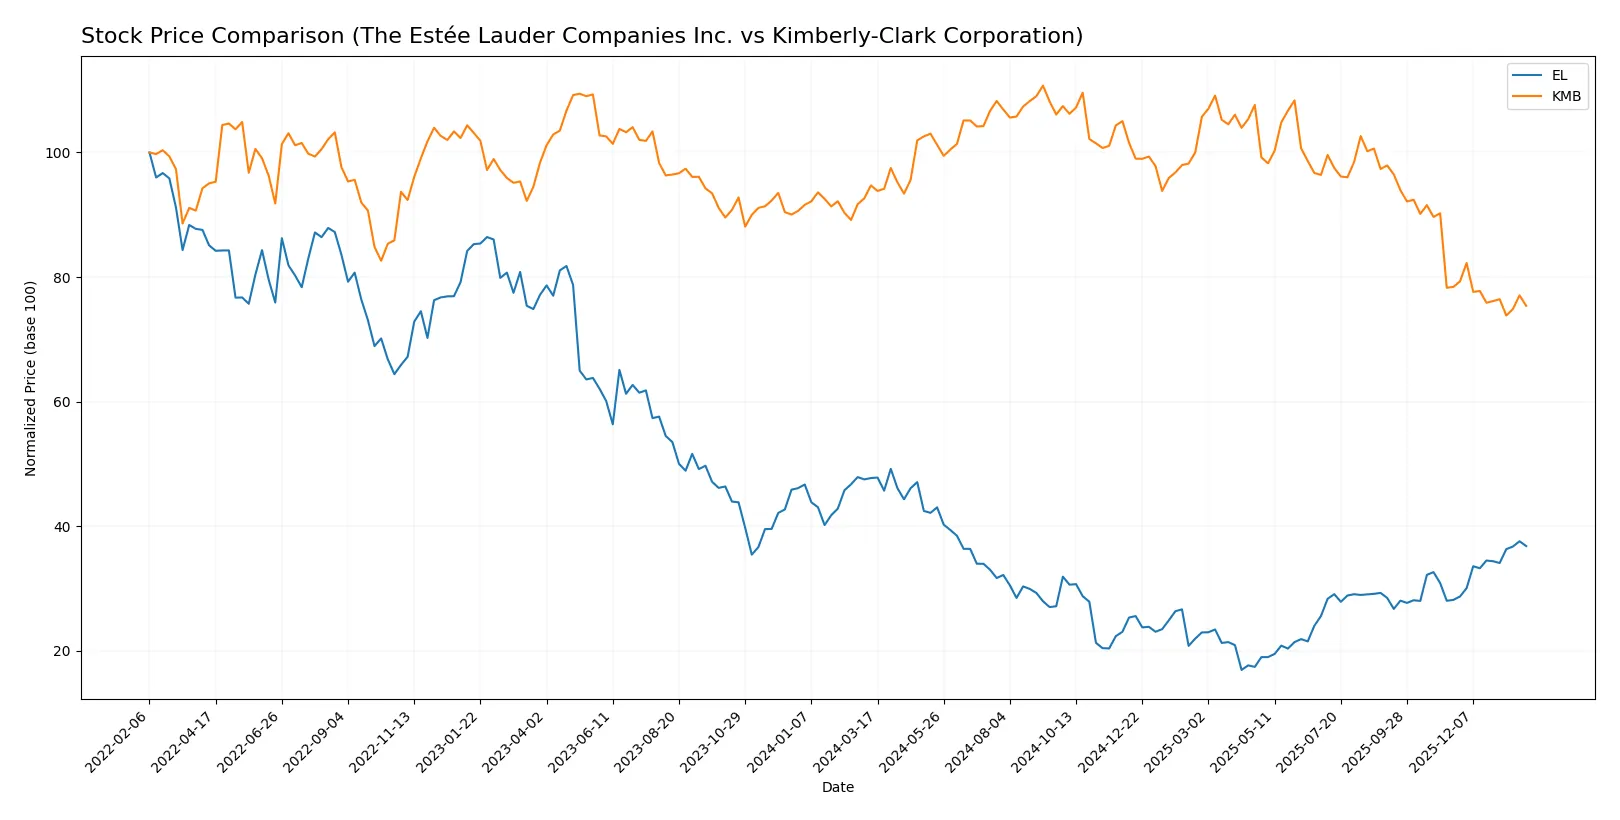
Trend Comparison
The Estée Lauder Companies Inc. stock fell 22.89% over 12 months, marking a bearish trend with accelerating decline. It showed high volatility (24.11 std deviation) and a recent strong rebound of 30.73% since November 2025.
Kimberly-Clark Corporation’s price declined 20.42% over the same period, also bearish but with decelerating losses. It exhibited lower volatility (12.48 std deviation) and a recent mild negative trend of -3.87%.
Comparing both stocks, Estée Lauder delivered the highest recent market performance despite greater overall losses, while Kimberly-Clark’s decline was steadier but less volatile.
Target Prices
Analysts present a broad but optimistic target consensus for Estée Lauder and Kimberly-Clark.
| Company | Target Low | Target High | Consensus |
|---|---|---|---|
| The Estée Lauder Companies Inc. | 70 | 140 | 113.42 |
| Kimberly-Clark Corporation | 102 | 162 | 122.38 |
The consensus targets suggest moderate upside potential for both stocks relative to current prices. Estée Lauder’s target slightly exceeds its $115 price, while Kimberly-Clark shows a more substantial gap above its $100 level.

Don’t Let Luck Decide Your Entry Point
Optimize your entry points with our advanced ProRealTime indicators. You’ll get efficient buy signals with precise price targets for maximum performance. Start outperforming now!
How do institutions grade them?
Here is a comparison of recent institutional grades for The Estée Lauder Companies Inc. and Kimberly-Clark Corporation:
The Estée Lauder Companies Inc. Grades
The latest grades from major institutions for The Estée Lauder Companies Inc. are as follows:
| Grading Company | Action | New Grade | Date |
|---|---|---|---|
| Telsey Advisory Group | maintain | Market Perform | 2026-01-30 |
| Deutsche Bank | maintain | Buy | 2026-01-29 |
| TD Cowen | maintain | Hold | 2026-01-21 |
| JP Morgan | maintain | Overweight | 2026-01-16 |
| Citigroup | maintain | Neutral | 2026-01-14 |
| UBS | maintain | Neutral | 2026-01-14 |
| Raymond James | upgrade | Strong Buy | 2026-01-05 |
| Wells Fargo | maintain | Equal Weight | 2026-01-05 |
| Citigroup | maintain | Neutral | 2025-12-17 |
| Evercore ISI Group | maintain | Outperform | 2025-12-16 |
Kimberly-Clark Corporation Grades
The latest grades from major institutions for Kimberly-Clark Corporation are as follows:
| Grading Company | Action | New Grade | Date |
|---|---|---|---|
| UBS | maintain | Neutral | 2026-01-28 |
| Citigroup | maintain | Sell | 2026-01-14 |
| UBS | maintain | Neutral | 2026-01-14 |
| TD Cowen | maintain | Hold | 2026-01-08 |
| Wells Fargo | maintain | Equal Weight | 2026-01-05 |
| Citigroup | maintain | Sell | 2025-12-17 |
| BNP Paribas Exane | maintain | Neutral | 2025-12-01 |
| Argus Research | upgrade | Buy | 2025-11-13 |
| Wells Fargo | maintain | Equal Weight | 2025-11-04 |
| Evercore ISI Group | downgrade | In Line | 2025-11-04 |
Which company has the best grades?
The Estée Lauder Companies consistently receive more favorable grades, including Buy, Strong Buy, and Outperform ratings. Kimberly-Clark shows more Neutral and Sell ratings, suggesting higher caution among analysts. Investors might view Estée Lauder’s grades as a sign of stronger institutional confidence.
Risks specific to each company
The following categories identify the critical pressure points and systemic threats facing both firms in the 2026 market environment:
1. Market & Competition
The Estée Lauder Companies Inc.
- Faces intense competition in luxury personal care, requiring constant innovation to maintain brand prestige.
Kimberly-Clark Corporation
- Competes in commoditized consumer tissue markets, relying on scale and brand loyalty to defend market share.
2. Capital Structure & Debt
The Estée Lauder Companies Inc.
- High debt-to-equity ratio (2.44) and negative interest coverage signal financial strain and refinancing risk.
Kimberly-Clark Corporation
- Strong balance sheet with favorable debt metrics and high interest coverage (9.73), indicating low financial risk.
3. Stock Volatility
The Estée Lauder Companies Inc.
- Beta of 1.146 suggests higher volatility and sensitivity to market swings.
Kimberly-Clark Corporation
- Beta of 0.276 indicates low volatility; stock is more defensive and stable in turbulent markets.
4. Regulatory & Legal
The Estée Lauder Companies Inc.
- Exposed to evolving cosmetic regulations globally, including ingredient restrictions and animal testing bans.
Kimberly-Clark Corporation
- Faces regulatory risks related to chemical safety and waste management in consumer tissue products.
5. Supply Chain & Operations
The Estée Lauder Companies Inc.
- Complex global supply chain vulnerable to raw material cost spikes and logistics disruptions.
Kimberly-Clark Corporation
- Supply chain risks concentrated in pulp and paper sourcing; moderate exposure to commodity price volatility.
6. ESG & Climate Transition
The Estée Lauder Companies Inc.
- Pressure to improve sustainability in packaging and reduce carbon footprint in luxury product lines.
Kimberly-Clark Corporation
- Significant push to decarbonize manufacturing and increase recycled content in products.
7. Geopolitical Exposure
The Estée Lauder Companies Inc.
- High exposure to international markets, especially Asia, vulnerable to trade tensions and currency fluctuations.
Kimberly-Clark Corporation
- More U.S.-centric but subject to NAFTA and other trade agreements impacting raw materials and sales.
Which company shows a better risk-adjusted profile?
Kimberly-Clark’s strong balance sheet and low stock volatility create a more stable risk-adjusted profile. Estée Lauder’s heavy debt burden and higher market sensitivity raise red flags. Kimberly-Clark’s Altman Z-Score in the grey zone versus Estée Lauder’s safe zone reflects moderate financial risk but better operational resilience. The most impactful risk for Estée Lauder is its strained capital structure, while Kimberly-Clark’s challenge lies in operational ESG pressures. The recent negative interest coverage for Estée Lauder confirms urgent refinancing concerns, making Kimberly-Clark the safer choice in 2026.
Final Verdict: Which stock to choose?
The Estée Lauder Companies Inc. (EL) excels with its strong brand equity and premium product positioning, making it a cash machine in beauty and luxury segments. However, its declining profitability and value destruction remain points of vigilance. EL suits investors seeking aggressive growth with tolerance for operational volatility.
Kimberly-Clark Corporation (KMB) boasts a durable moat through consumer staples demand and steady recurring revenue streams. It offers superior financial stability relative to EL, supported by a solid dividend yield and healthier cash flow metrics. KMB fits well in GARP portfolios prioritizing income and moderate growth with lower risk.
If you prioritize high-growth potential and brand-driven market leadership, EL is the compelling choice despite its recent margin pressures. However, if you seek better stability and income with a defensible market position, KMB offers a superior risk-adjusted profile. Both present distinct analytical scenarios tailored to different investor appetites.
Disclaimer: Investment carries a risk of loss of initial capital. The past performance is not a reliable indicator of future results. Be sure to understand risks before making an investment decision.
Go Further
I encourage you to read the complete analyses of The Estée Lauder Companies Inc. and Kimberly-Clark Corporation to enhance your investment decisions: