Home > Comparison > Consumer Defensive > KMB vs CLX
The strategic rivalry between Kimberly-Clark Corporation and The Clorox Company shapes the dynamics of the Consumer Defensive sector. Kimberly-Clark operates as a broad-based household and personal products manufacturer with global reach. Clorox, by contrast, focuses on diverse consumer and professional product lines emphasizing health and lifestyle segments. This analysis compares their operational models to identify which company offers a superior risk-adjusted return for a balanced portfolio in this competitive industry.

Table of contents
Companies Overview
Kimberly-Clark and The Clorox Company stand as pillars in the household and personal products industry, shaping consumer habits globally.
Kimberly-Clark Corporation: Global Leader in Personal Care and Tissue Products
Kimberly-Clark dominates the personal care and consumer tissue markets through iconic brands like Huggies and Kleenex. Its revenue stems from three core segments: Personal Care, Consumer Tissue, and K-C Professional. In 2026, the company strategically emphasized expanding its professional product lines and strengthening its retail partnerships worldwide.
The Clorox Company: Diverse Consumer and Professional Products Innovator
The Clorox Company commands a broad portfolio across Health and Wellness, Household, Lifestyle, and International segments. Its core revenue arises from cleaning, natural personal care, and food service products under brands like Clorox and Burt’s Bees. In 2026, Clorox sharpened its focus on international expansion and health-oriented product innovation to capture emerging consumer trends.
Strategic Collision: Similarities & Divergences
Both firms operate in the consumer defensive sector, but Kimberly-Clark centers on tissue and personal care, while Clorox spans cleaning and lifestyle products. They compete primarily in retail channels targeting both household and professional customers. Kimberly-Clark’s scale and professional segment contrast with Clorox’s diversified brand strategy, creating distinct risk and growth profiles for investors.
Income Statement Comparison
The following data dissects the core profitability and scalability of both corporate engines to reveal who dominates the bottom line:

| Metric | Kimberly-Clark Corporation (KMB) | The Clorox Company (CLX) |
|---|---|---|
| Revenue | 17.2B | 7.1B |
| Cost of Revenue | 11.1B | 3.9B |
| Operating Expenses | 3.6B | 2.0B |
| Gross Profit | 6.1B | 3.2B |
| EBITDA | 3.1B | 1.4B |
| EBIT | 2.5B | 1.2B |
| Interest Expense | 256M | 101M |
| Net Income | 2.0B | 810M |
| EPS | 6.08 | 6.56 |
| Fiscal Year | 2025 | 2025 |
Income Statement Analysis: The Bottom-Line Duel
This income statement comparison reveals which company runs a more efficient and profitable operational engine through recent fiscal results.
Kimberly-Clark Corporation Analysis
Kimberly-Clark’s revenue declined by 14% in 2025 to $17.2B, dragging gross profit down 14.6%. Despite this, the company sustains a solid gross margin near 36% and a net margin of 11.7%. Net income fell 20% year-over-year to $2.0B but grew 11% over five years. The 2025 results signal pressure on top-line momentum but maintained margin discipline.
The Clorox Company Analysis
Clorox’s revenue remained flat at $7.1B in 2025, yet gross profit rose 5.6%, lifting gross margin to an impressive 45%. EBIT surged 135% to $1.2B, and net income jumped 189% to $810M. Clorox’s net margin matches Kimberly-Clark’s at 11.4%, but its strong margin expansion and earnings growth reflect robust operational leverage and efficiency gains.
Margin Expansion vs. Revenue Resilience
Clorox outperforms Kimberly-Clark in margin expansion and earnings growth despite stable revenue. Kimberly-Clark shows stronger scale but weaker recent top-line momentum and margin contraction. For investors prioritizing margin improvement and earnings momentum, Clorox presents a more attractive profile. Kimberly-Clark offers scale and steady long-term net income growth but faces near-term margin pressure.
Financial Ratios Comparison
These vital ratios act as a diagnostic tool to expose the underlying fiscal health, valuation premiums, and capital efficiency of the companies analyzed:
| Ratios | Kimberly-Clark Corporation (KMB) | The Clorox Company (CLX) |
|---|---|---|
| ROE | 3.03% (2024) | 2.52% (2025) |
| ROIC | 25.3% (2024) | 24.1% (2025) |
| P/E | 17.35 (2024) | 18.31 (2025) |
| P/B | 52.57 (2024) | 46.20 (2025) |
| Current Ratio | 0.80 (2024) | 0.84 (2025) |
| Quick Ratio | 0.54 (2024) | 0.57 (2025) |
| D/E | 9.42 (2024) | 8.97 (2025) |
| Debt-to-Assets | 48% (2024) | 52% (2025) |
| Interest Coverage | 11.9 (2024) | 11.7 (2025) |
| Asset Turnover | 1.21 (2024) | 1.28 (2025) |
| Fixed Asset Turnover | 2.67 (2024) | 4.44 (2025) |
| Payout Ratio | 64.0% (2024) | 74.3% (2025) |
| Dividend Yield | 3.69% (2024) | 4.06% (2025) |
| Fiscal Year | 2024 | 2025 |
Efficiency & Valuation Duel: The Vital Signs
Financial ratios act as a company’s DNA, exposing hidden risks and operational strengths critical for investor insight.
Kimberly-Clark Corporation
Kimberly-Clark shows a favorable net margin of 11.74% but struggles with zero reported ROE and ROIC, signaling weak profitability. The P/E of 16.63 appears fairly valued. Its 4.94% dividend yield rewards shareholders, reflecting a stable income focus over aggressive growth or reinvestment.
The Clorox Company
Clorox boasts strong profitability with ROE at 252.34% and ROIC at 24.14%, indicating efficient capital use. The P/E of 18.31 is neutral but paired with a high P/B of 46.2, suggesting valuation stretch. A 4.06% dividend yield complements its shareholder returns despite heavy leverage.
Premium Valuation vs. Operational Safety
Clorox delivers superior profitability and operational efficiency but at a higher valuation and leverage risk. Kimberly-Clark offers stability with decent margins and a robust dividend, albeit weaker capital returns. Investors seeking growth and efficiency may prefer Clorox; those favoring income and prudence might lean to Kimberly-Clark.
Which one offers the Superior Shareholder Reward?
Kimberly-Clark (KMB) offers a higher dividend yield near 4.9% with a payout ratio around 82%, supported by strong free cash flow coverage above 1.6x. Clorox (CLX) yields roughly 4.1% but displays a less consistent payout, occasionally exceeding 100%, risking sustainability. KMB’s buybacks are moderate but steady, reinforcing shareholder returns alongside dividends. CLX’s buyback intensity is less clear but appears less balanced given payout irregularities. I see KMB’s disciplined, cash-backed distributions and reliable buybacks as a more sustainable model. For 2026 investors seeking dependable total returns, Kimberly-Clark delivers superior shareholder reward potential.
Comparative Score Analysis: The Strategic Profile
The radar chart reveals the fundamental DNA and trade-offs of Kimberly-Clark Corporation and The Clorox Company, highlighting their core financial strengths and weaknesses:

Kimberly-Clark shows a balanced profile with very favorable scores in DCF, ROE, and ROA, reflecting strong profitability and asset efficiency. Clorox matches Kimberly-Clark in asset use (ROA) but lags in equity returns and cash flow valuation. Both firms share weak debt-to-equity and price-to-book scores, signaling leverage and valuation concerns. Kimberly-Clark’s edge lies in consistent profitability, while Clorox relies more on asset efficiency.
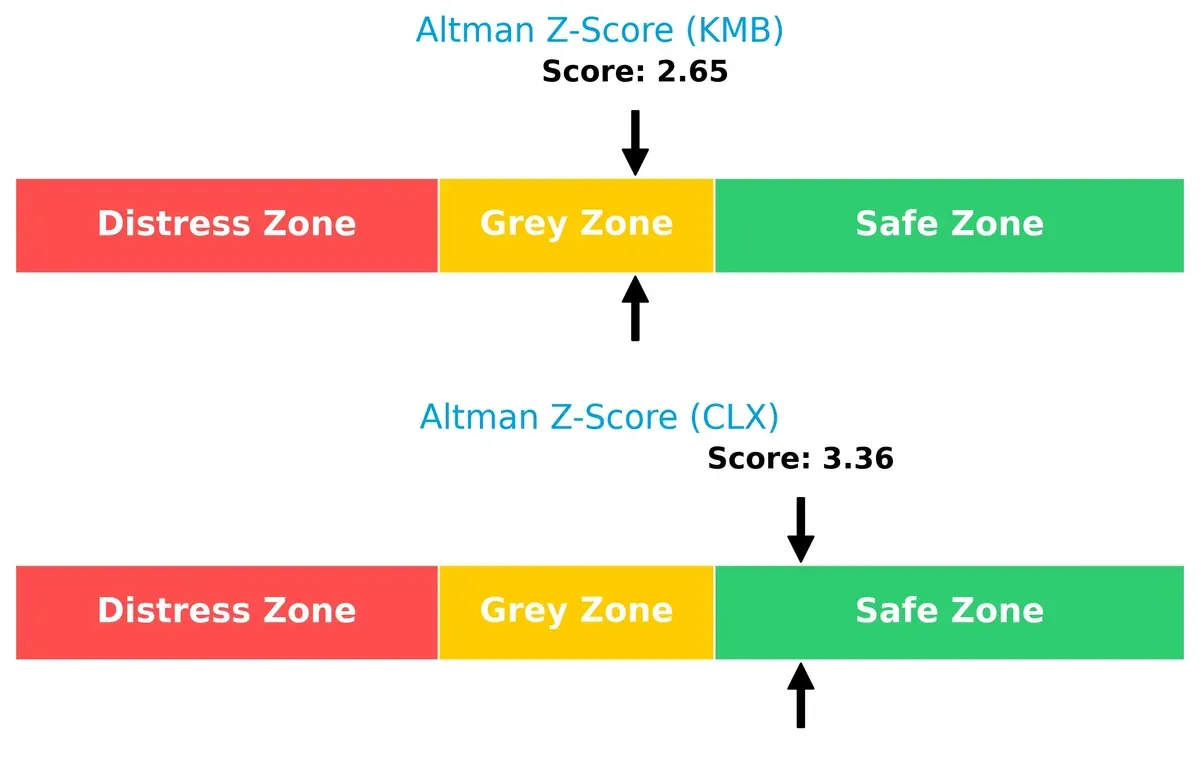
Bankruptcy Risk: Solvency Showdown
Kimberly-Clark’s Altman Z-Score of 2.65 versus Clorox’s 3.36 places Kimberly-Clark in the grey zone and Clorox safely above financial distress thresholds, implying stronger long-term solvency for Clorox in this cycle:
Financial Health: Quality of Operations
Kimberly-Clark’s Piotroski F-Score of 7 indicates strong financial health, outperforming Clorox’s average score of 5. Kimberly-Clark’s internal metrics show fewer red flags, suggesting more robust operational quality:

How are the two companies positioned?
This section dissects KMB and CLX’s operational DNA by comparing their revenue distribution and internal strengths and weaknesses. The goal is to confront their economic moats and identify which model offers the most resilient and sustainable competitive advantage today.
Revenue Segmentation: The Strategic Mix
This visual comparison dissects how Kimberly-Clark Corporation and The Clorox Company diversify their income streams and reveals their primary sector bets:

Kimberly-Clark leans heavily on Personal Care, generating over $10B, while Consumer Tissue and K-C Professional add diversification. Clorox displays a balanced mix across Health and Wellness ($2.7B), Household ($2B), International ($1.1B), and Lifestyle ($1.3B). Kimberly-Clark’s reliance on Personal Care anchors its ecosystem lock-in but carries concentration risk. Clorox’s broader spread suggests infrastructure dominance and resilience across consumer categories.
Strengths and Weaknesses Comparison
This table compares the strengths and weaknesses of Kimberly-Clark Corporation and The Clorox Company:
Kimberly-Clark Corporation Strengths
- Diversified product lines including Consumer Tissue, Professional, and Personal Care
- Strong net margin of 11.74%
- Favorable debt-to-equity and interest coverage ratios
- Dividend yield at 4.94% supports income investors
- Significant U.S. and international revenue base
The Clorox Company Strengths
- Favorable profitability metrics: net margin 11.4%, ROE 252%, ROIC 24.14%
- Efficient asset turnover ratios
- Global presence with solid U.S. and international sales
- Favorable WACC at 5.86%
- Dividend yield of 4.06%
Kimberly-Clark Corporation Weaknesses
- Unfavorable ROE and ROIC (both 0%) raise questions on capital efficiency
- Missing WACC data limits full cost of capital analysis
- Weak liquidity ratios (current and quick ratios at 0) pose risk
- Unfavorable asset turnover ratios indicate lower operational efficiency
- Neutral PE ratio at 16.63
The Clorox Company Weaknesses
- High debt-to-equity ratio (8.97) and debt-to-assets at 51.79% increase leverage risk
- Unfavorable liquidity ratios (current ratio 0.84, quick ratio 0.57)
- Unfavorable high price-to-book ratio (46.2) suggests potential overvaluation
- Neutral PE ratio at 18.31
Both companies show strong U.S. and international revenue streams with dividend yields appealing to income-focused investors. Kimberly-Clark struggles with capital efficiency and liquidity, while Clorox faces high leverage and valuation risks. These factors should inform each company’s strategic focus on operational improvement and financial risk management.
The Moat Duel: Analyzing Competitive Defensibility
A structural moat is the only safeguard preserving long-term profits from relentless competitive pressure. Let’s dissect the competitive defenses of Kimberly-Clark and Clorox:
Kimberly-Clark Corporation: Brand Power with Geographic Reach
Kimberly-Clark’s moat hinges on strong brand equity and diversified international presence. It reports stable gross margins around 35.6%, but declining revenue growth signals rising competitive pressure in 2026.
The Clorox Company: Efficient Capital Allocation and Margin Expansion
Clorox’s moat derives from efficient capital use, reflected in a 16.6% EBIT margin and ROIC comfortably exceeding WACC by 18.3%. Its growing profitability and margin expansion highlight a deepening moat in 2026.
Margin Stability vs. Capital Efficiency: The Moat Showdown
Clorox’s expanding ROIC and robust margin growth grant it a wider, more durable moat than Kimberly-Clark, which faces margin pressures and revenue decline. Clorox stands better equipped to defend market share amid evolving consumer demands.
Which stock offers better returns?
Over the past year, Kimberly-Clark and The Clorox Company displayed divergent price dynamics, with both stocks experiencing overall declines but contrasting recent momentum and volatility.
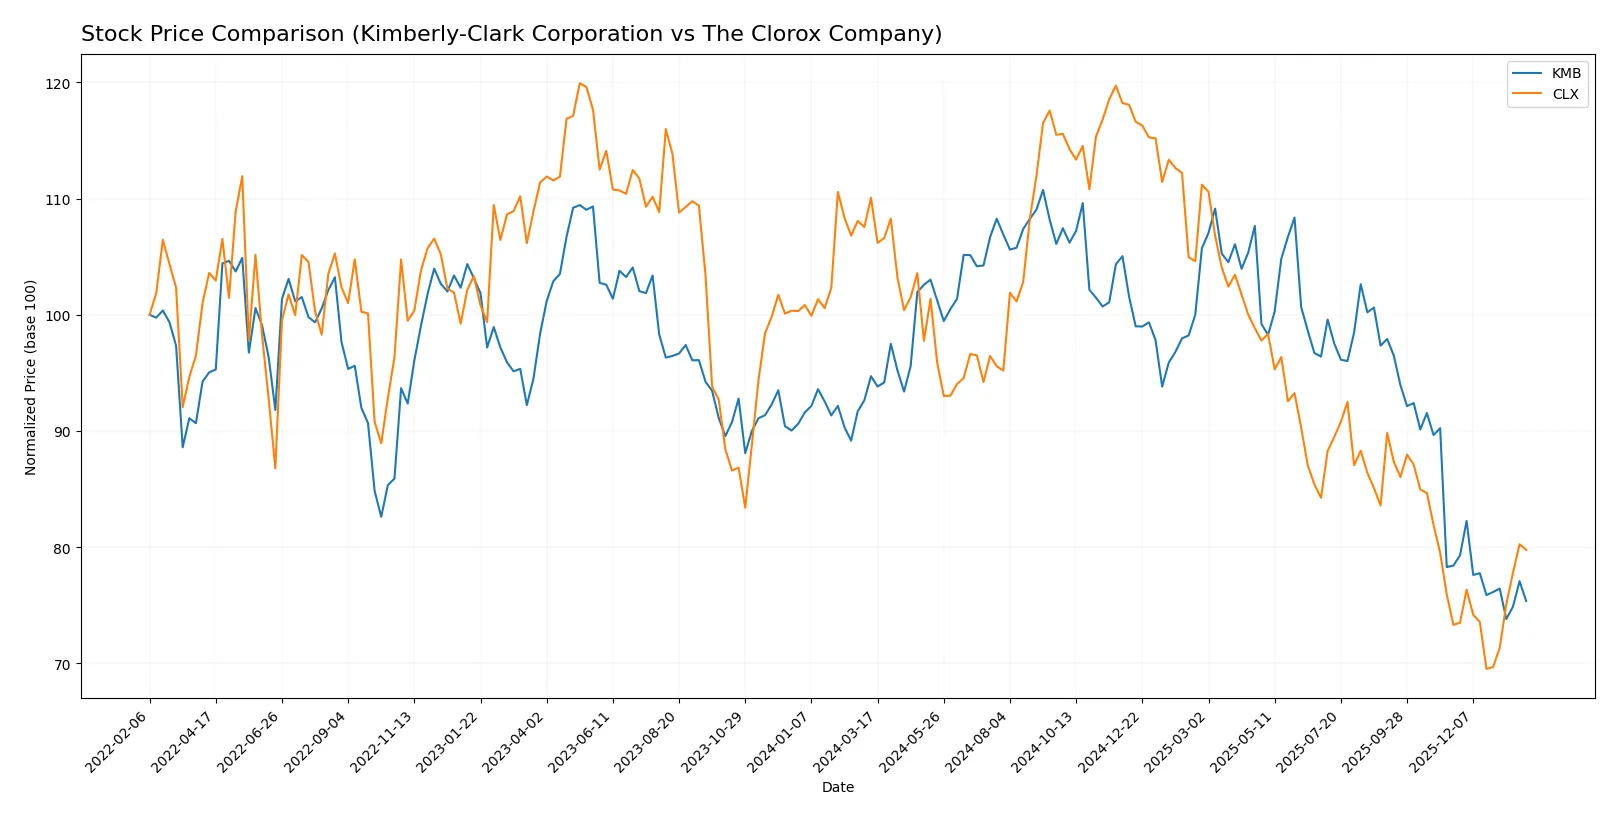
Trend Comparison
Kimberly-Clark’s stock fell 20.42% over the past 12 months, marking a bearish trend with decelerating losses. The price ranged between 97.92 and 146.91, showing moderate volatility (12.48 std dev).
Clorox’s stock declined 27.54% over the same period, also bearish but with accelerating losses and higher volatility (19.27 std dev). Its price fluctuated from 98.31 to 169.3, reflecting more pronounced swings.
Comparing recent trends, Clorox recovered 8.79% since late 2025, while Kimberly-Clark continued to drop 3.87%. Clorox outperformed overall despite larger annual losses.
Target Prices
Analysts provide a cautiously optimistic consensus for Kimberly-Clark and Clorox, suggesting moderate upside from current prices.
| Company | Target Low | Target High | Consensus |
|---|---|---|---|
| Kimberly-Clark Corporation | 102 | 162 | 122.38 |
| The Clorox Company | 94 | 152 | 117.71 |
Both stocks trade below their consensus target prices, indicating potential appreciation. Kimberly-Clark shows a wider target range, reflecting greater analyst uncertainty than Clorox.

Don’t Let Luck Decide Your Entry Point
Optimize your entry points with our advanced ProRealTime indicators. You’ll get efficient buy signals with precise price targets for maximum performance. Start outperforming now!
How do institutions grade them?
This section compares recent institutional grades for Kimberly-Clark Corporation and The Clorox Company:
Kimberly-Clark Corporation Grades
The following table summarizes recent grades from major financial institutions for Kimberly-Clark:
| Grading Company | Action | New Grade | Date |
|---|---|---|---|
| UBS | Maintain | Neutral | 2026-01-28 |
| Citigroup | Maintain | Sell | 2026-01-14 |
| UBS | Maintain | Neutral | 2026-01-14 |
| TD Cowen | Maintain | Hold | 2026-01-08 |
| Wells Fargo | Maintain | Equal Weight | 2026-01-05 |
| Citigroup | Maintain | Sell | 2025-12-17 |
| BNP Paribas Exane | Maintain | Neutral | 2025-12-01 |
| Argus Research | Upgrade | Buy | 2025-11-13 |
| Wells Fargo | Maintain | Equal Weight | 2025-11-04 |
| Evercore ISI Group | Downgrade | In Line | 2025-11-04 |
The Clorox Company Grades
Below is the summary of recent institutional grades for The Clorox Company:
| Grading Company | Action | New Grade | Date |
|---|---|---|---|
| Wells Fargo | Maintain | Equal Weight | 2026-01-23 |
| JP Morgan | Maintain | Neutral | 2026-01-16 |
| UBS | Maintain | Neutral | 2026-01-14 |
| TD Cowen | Maintain | Hold | 2026-01-08 |
| Goldman Sachs | Maintain | Sell | 2026-01-07 |
| Wells Fargo | Maintain | Equal Weight | 2026-01-05 |
| Citigroup | Maintain | Neutral | 2025-12-17 |
| Citigroup | Maintain | Neutral | 2025-11-04 |
| Wells Fargo | Maintain | Equal Weight | 2025-11-04 |
| Morgan Stanley | Maintain | Equal Weight | 2025-11-04 |
Which company has the best grades?
Kimberly-Clark shows a wider grade range, including a Buy upgrade from Argus Research, contrasting with more consistently Neutral and Equal Weight grades for Clorox. This variation may suggest differing confidence levels among analysts, potentially affecting investor sentiment and risk assessment.
Risks specific to each company
In the 2026 market environment, these categories reveal critical pressure points and systemic threats facing Kimberly-Clark Corporation and The Clorox Company:
1. Market & Competition
Kimberly-Clark Corporation
- Faces intense competition in personal care and tissue segments from global and private-label brands, pressuring margins.
The Clorox Company
- Competes across diverse segments including cleaning and wellness, requiring constant innovation to maintain market share.
2. Capital Structure & Debt
Kimberly-Clark Corporation
- Exhibits a favorable debt profile with low leverage, supporting financial flexibility.
The Clorox Company
- Carries high debt-to-equity ratio (51.79%) risking financial strain amid rising interest rates.
3. Stock Volatility
Kimberly-Clark Corporation
- Low beta (0.276) indicates lower volatility and defensive stock characteristics.
The Clorox Company
- Higher beta (0.575) suggests greater sensitivity to market swings and higher risk.
4. Regulatory & Legal
Kimberly-Clark Corporation
- Operates under strict consumer product regulations globally, potentially increasing compliance costs.
The Clorox Company
- Faces regulatory scrutiny especially in chemical and health product segments, adding litigation risk.
5. Supply Chain & Operations
Kimberly-Clark Corporation
- Dependence on global suppliers for raw materials exposes it to supply disruptions and cost inflation.
The Clorox Company
- Diverse product portfolio complicates supply chain, increasing operational risk during global disruptions.
6. ESG & Climate Transition
Kimberly-Clark Corporation
- Increasing pressure to reduce environmental footprint and improve sustainability practices in packaging and sourcing.
The Clorox Company
- Faces similar ESG challenges; must innovate in sustainability to meet investor and regulatory expectations.
7. Geopolitical Exposure
Kimberly-Clark Corporation
- Global operations expose it to currency fluctuations and trade tensions affecting cost and sales.
The Clorox Company
- International segment subject to geopolitical risks impacting supply chains and market access.
Which company shows a better risk-adjusted profile?
Kimberly-Clark’s low leverage, low volatility, and solid dividend yield underpin a more stable risk profile. Clorox’s higher debt and greater market sensitivity elevate risk despite stronger operational returns. The biggest risk for Kimberly-Clark is operational supply chain vulnerability. For Clorox, excessive leverage threatens financial stability. Kimberly-Clark’s defensive beta of 0.276 versus Clorox’s 0.575 confirms its safer positioning in volatile markets.
Final Verdict: Which stock to choose?
Kimberly-Clark’s superpower lies in its status as a reliable cash machine, generating consistent free cash flows and rewarding shareholders with a nearly 5% dividend yield. Its point of vigilance is the declining ROIC trend and weakening operational efficiency, which could challenge long-term value creation. It suits portfolios seeking steady income with moderate growth exposure.
The Clorox Company stands out for its durable competitive moat, demonstrated by a strong and growing ROIC well above its cost of capital. Its strategic advantage is backed by robust profitability and superior operational returns, albeit with higher leverage risk than Kimberly-Clark. Clorox fits well in GARP portfolios that balance growth potential with reasonable valuation.
If you prioritize income stability and a proven cash-generating model, Kimberly-Clark presents a compelling choice due to its reliable dividends and conservative leverage. However, if you seek durable competitive advantage with stronger value creation and are comfortable with elevated risk, Clorox offers better growth stability and operational efficiency. Both stocks require careful risk monitoring given differing balance sheet profiles.
Disclaimer: Investment carries a risk of loss of initial capital. The past performance is not a reliable indicator of future results. Be sure to understand risks before making an investment decision.
Go Further
I encourage you to read the complete analyses of Kimberly-Clark Corporation and The Clorox Company to enhance your investment decisions: