Home > Comparison > Consumer Defensive > KMB vs SPB
The strategic rivalry between Kimberly-Clark Corporation and Spectrum Brands Holdings shapes the competitive landscape of the Consumer Defensive sector. Kimberly-Clark operates as a capital-intensive leader in personal care and tissue products, while Spectrum Brands excels as a diversified branded consumer goods provider focused on home, pet, and garden segments. This analysis evaluates which company’s operational model delivers a superior risk-adjusted return, guiding investors toward the more resilient choice for a balanced portfolio.
Table of contents
Companies Overview
Kimberly-Clark and Spectrum Brands both shape the global household and personal products market with distinct footprints.
Kimberly-Clark Corporation: Global Leader in Personal Care and Tissue Products
Kimberly-Clark stands as a major player in household and personal products. It generates revenue primarily through three segments: Personal Care, Consumer Tissue, and K-C Professional. In 2026, its strategic focus remains on expanding premium brands like Huggies and Kleenex while strengthening distribution across retail and away-from-home channels worldwide.
Spectrum Brands Holdings, Inc.: Diverse Consumer Products Specialist
Spectrum Brands operates as a branded consumer products company with three business segments: Home and Personal Care, Global Pet Care, and Home and Garden. Its 2026 strategy concentrates on broadening pet care offerings and home pest control solutions, leveraging iconic brands such as Black & Decker and 8IN1 to capture market share through retail and e-commerce channels.
Strategic Collision: Similarities & Divergences
Both companies deliver essential consumer goods but differ in approach: Kimberly-Clark focuses on specialized hygiene and tissue products, while Spectrum embraces a diversified product portfolio including pet care and home appliances. Their primary battleground lies in retail shelf space and brand loyalty. Kimberly-Clark’s scale and brand strength contrast with Spectrum’s niche diversity, defining distinct risk and growth profiles for investors.
Income Statement Comparison
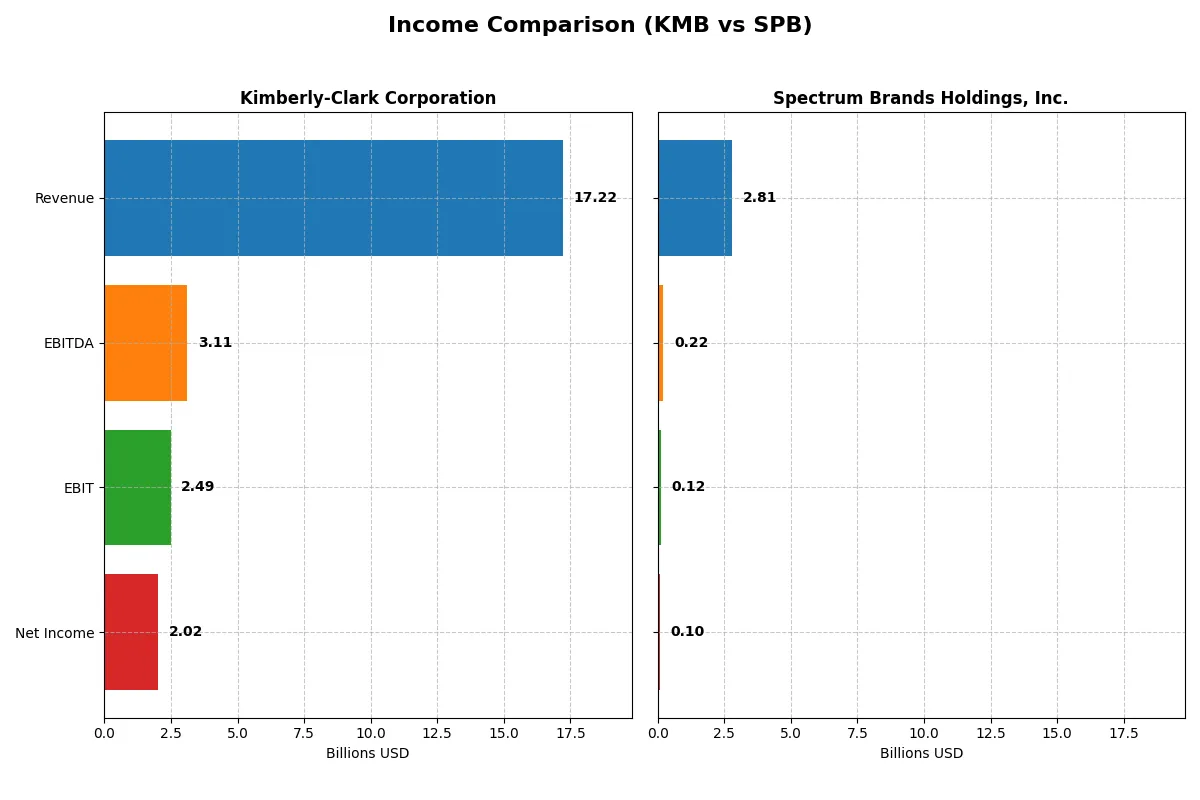
This data dissects the core profitability and scalability of both corporate engines to reveal who dominates the bottom line:
| Metric | Kimberly-Clark Corporation (KMB) | Spectrum Brands Holdings, Inc. (SPB) |
|---|---|---|
| Revenue | 17.2B | 2.81B |
| Cost of Revenue | 11.1B | 1.78B |
| Operating Expenses | 3.64B | 907M |
| Gross Profit | 6.13B | 1.03B |
| EBITDA | 3.11B | 215M |
| EBIT | 2.49B | 117M |
| Interest Expense | 256M | 30M |
| Net Income | 2.02B | 100M |
| EPS | 6.08 | 3.88 |
| Fiscal Year | 2025 | 2025 |
Income Statement Analysis: The Bottom-Line Duel
This income statement comparison exposes which company runs its business engine with superior efficiency and sustainable profitability.
Kimberly-Clark Corporation Analysis
Kimberly-Clark’s revenue declined 14% in 2025 to $17.2B, yet net income remained robust at $2.0B, reflecting solid margin control. Gross margin stayed favorable at 35.6%, and net margin held strong at 11.7%. Despite last year’s top-line pressure, the company maintained operational discipline with a 14.5% EBIT margin, signaling resilient profit momentum.
Spectrum Brands Holdings, Inc. Analysis
Spectrum Brands saw a 5.2% revenue drop to $2.8B in 2025, with net income shrinking to $100M. Its gross margin of 36.7% is commendable, but a modest 4.2% EBIT margin and 3.6% net margin highlight weaker profitability. The company faces challenges improving bottom-line efficiency amid declining revenue and margin contractions.
Margin Power vs. Revenue Scale
Kimberly-Clark commands a clear edge with high single-digit net margins and a multi-billion-dollar profit base, despite recent revenue setbacks. Spectrum Brands shows a tighter margin profile and smaller scale, with less favorable growth trends. Investors prioritizing stable profitability and scale would find Kimberly-Clark’s profile more compelling.
Financial Ratios Comparison
These vital ratios act as a diagnostic tool to expose the underlying fiscal health, valuation premiums, and capital efficiency of the companies compared below:
| Ratios | Kimberly-Clark Corporation (KMB) | Spectrum Brands Holdings, Inc. (SPB) |
|---|---|---|
| ROE | 3.03% (2024) | 5.23% (2025) |
| ROIC | 25.33% (2024) | 4.31% (2025) |
| P/E | 17.35 (2024) | 13.51 (2025) |
| P/B | 52.57 (2024) | 0.71 (2025) |
| Current Ratio | 0.80 (2024) | 2.26 (2025) |
| Quick Ratio | 0.54 (2024) | 1.41 (2025) |
| D/E (Debt-to-Equity) | 9.42 (2024) | 0.34 (2025) |
| Debt-to-Assets | 47.84% (2024) | 19.36% (2025) |
| Interest Coverage | 11.89 (2024) | 4.16 (2025) |
| Asset Turnover | 1.21 (2024) | 0.83 (2025) |
| Fixed Asset Turnover | 2.67 (2024) | 8.55 (2025) |
| Payout ratio | 64.0% (2024) | 48.2% (2025) |
| Dividend yield | 3.69% (2024) | 3.57% (2025) |
| Fiscal Year | 2024 | 2025 |
Efficiency & Valuation Duel: The Vital Signs
Financial ratios serve as a company’s DNA, revealing hidden risks and operational excellence critical for investment decisions.
Kimberly-Clark Corporation
Kimberly-Clark posts a solid net margin of 11.74%, confirming operational efficiency despite a neutral P/E of 16.63. The stock appears fairly valued but shows unfavorable returns on equity and invested capital, signaling weak profitability. A generous 4.94% dividend yield compensates shareholders, highlighting a shareholder-friendly return policy amid reinvestment challenges.
Spectrum Brands Holdings, Inc.
Spectrum Brands presents a modest net margin of 3.56% with a cheaper P/E of 13.51, suggesting better valuation appeal. Although ROE and ROIC remain low, the firm maintains strong liquidity ratios and conservative leverage. A 3.57% dividend yield supports income-seeking investors, reflecting a balanced approach between payout and reinvestment.
Balanced Valuation vs. Operational Resilience
Spectrum offers a more favorable ratio profile with better liquidity and valuation metrics. Kimberly-Clark excels in margin strength but struggles with returns and liquidity. Investors valuing stability and conservative balance sheets may prefer Spectrum, while those prioritizing income might lean toward Kimberly-Clark’s dividend yield.
Which one offers the Superior Shareholder Reward?
I compare Kimberly-Clark (KMB) and Spectrum Brands (SPB) on dividends, payout ratios, and buybacks to identify the better shareholder reward. KMB yields 4.94% with a high 82% payout ratio, supported by strong free cash flow coverage (1.67x). It maintains steady dividends around 4.98/share and modest buybacks, emphasizing reliable income. SPB yields 3.57%, with a lighter 48% payout ratio, balancing dividends with aggressive buybacks and reinvestment, though free cash flow coverage is weaker (~0.81x). KMB’s distribution model is more sustainable given its robust cash flow and conservative leverage. I conclude KMB offers a superior total return profile in 2026 due to dependable dividends and prudent capital allocation.
Comparative Score Analysis: The Strategic Profile
The radar chart reveals the fundamental DNA and trade-offs of Kimberly-Clark Corporation and Spectrum Brands Holdings, Inc., highlighting their core financial strengths and vulnerabilities:
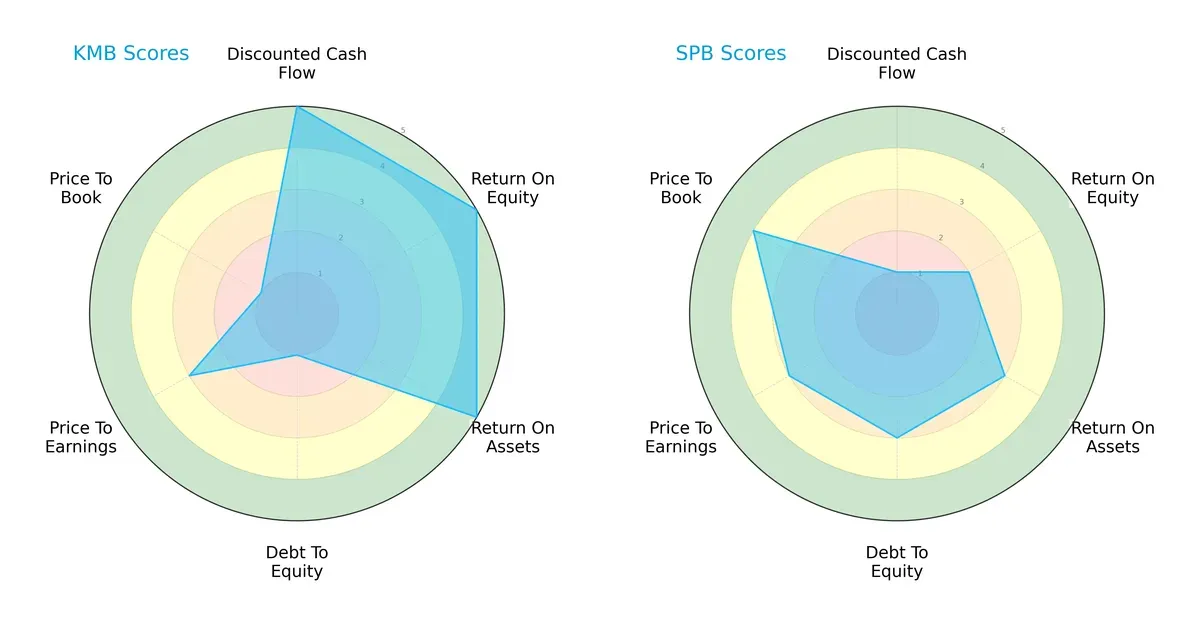
Kimberly-Clark dominates in cash flow generation, returns on equity and assets, showing a well-rounded operational efficiency. However, its balance sheet is stretched with a very unfavorable debt-to-equity and price-to-book score. Spectrum Brands displays moderate operational returns and financial risk but benefits from a more favorable price-to-book valuation. Kimberly-Clark has a more balanced profile in profitability, while Spectrum relies on valuation advantages.
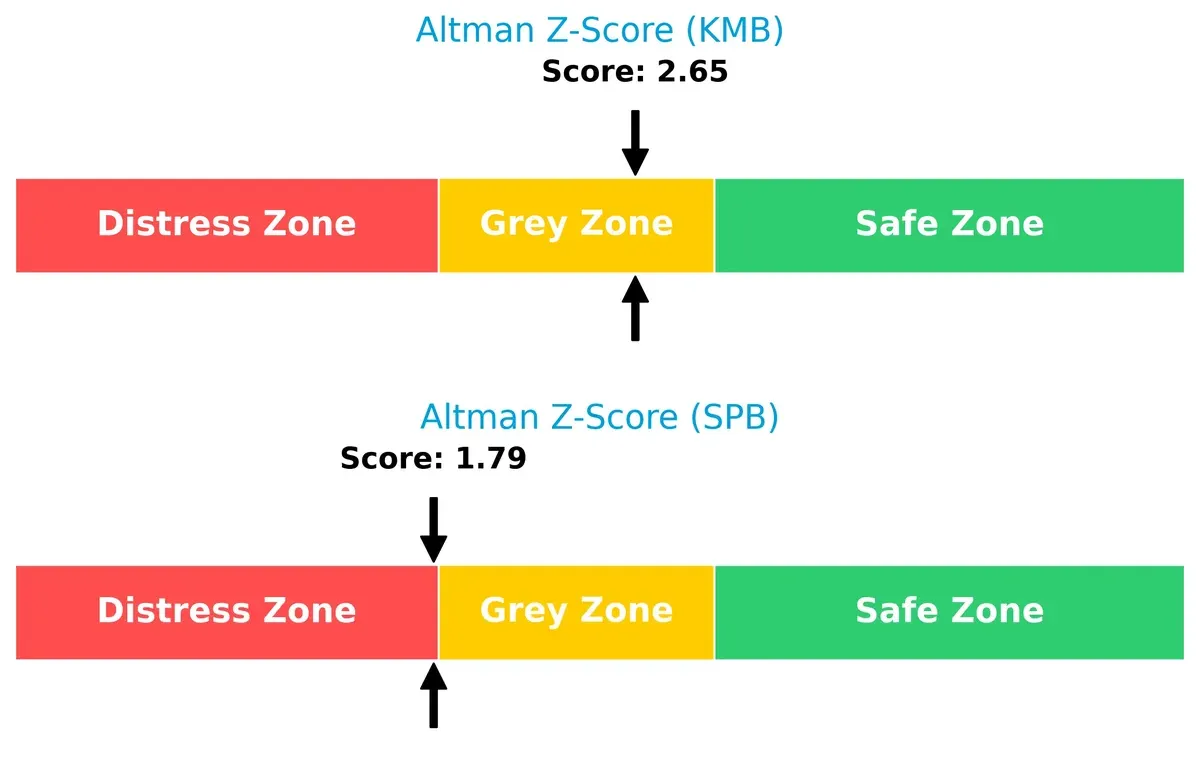
Bankruptcy Risk: Solvency Showdown
Kimberly-Clark’s Altman Z-Score of 2.65 places it in the grey zone, signaling moderate bankruptcy risk. Spectrum Brands scores 1.79, teetering on the distress zone, implying higher long-term solvency concerns in this cycle:
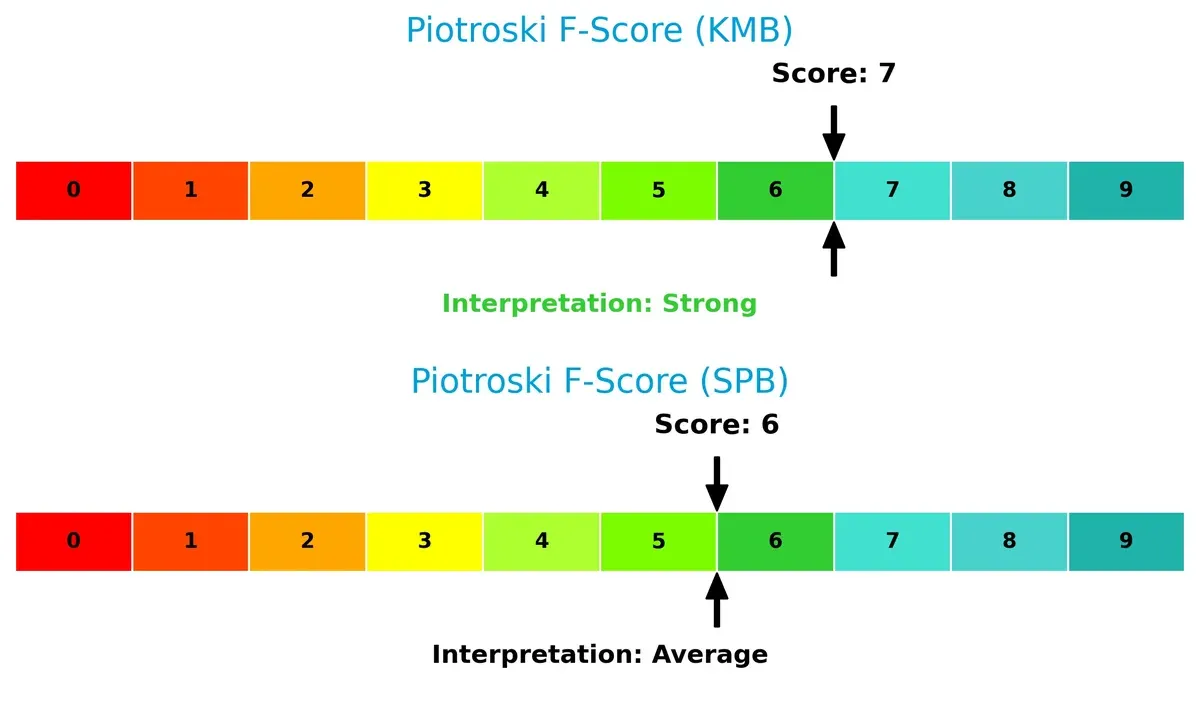
Financial Health: Quality of Operations
Kimberly-Clark’s Piotroski F-Score of 7 indicates strong internal financial health and operational quality. Spectrum Brands’ score of 6 is average, suggesting some caution due to weaker internal metrics compared to Kimberly-Clark:
How are the two companies positioned?
This section dissects the operational DNA of Kimberly-Clark and Spectrum Brands by comparing their revenue distribution and internal dynamics. The goal is to confront their economic moats and identify which model offers the most resilient competitive advantage today.
Revenue Segmentation: The Strategic Mix
This visual comparison dissects how Kimberly-Clark and Spectrum Brands diversify their income streams and where their primary sector bets lie:
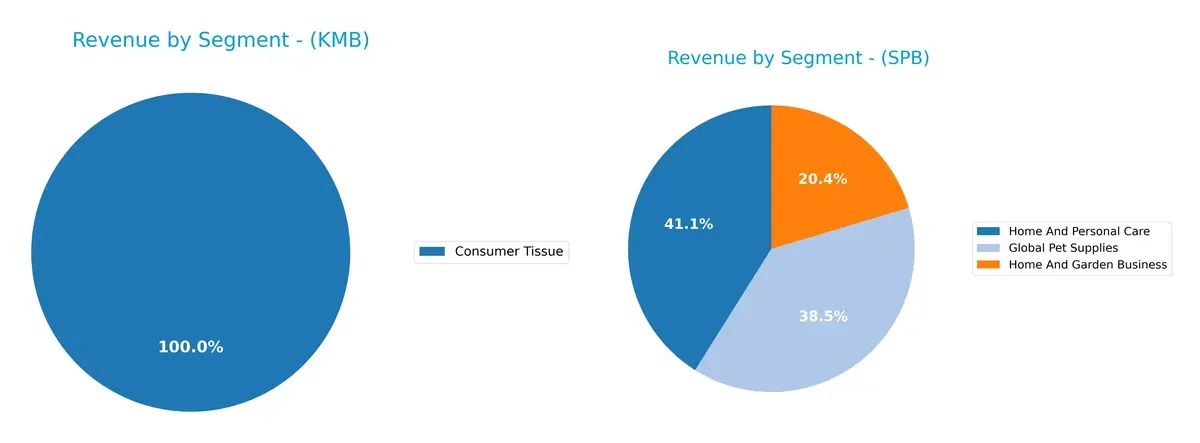
Kimberly-Clark anchors its revenue heavily on Personal Care at over $10B, with Consumer Tissue and K-C Professional trailing at $6.3B and $3.4B respectively. This concentration highlights its dominance in personal hygiene essentials. In contrast, Spectrum Brands shows a more diversified mix across Global Pet Supplies ($1.15B), Home and Personal Care ($1.23B), and Home and Garden Business ($578M). Spectrum’s spread reduces concentration risk, while Kimberly-Clark leverages ecosystem lock-in in consumer staples.
Strengths and Weaknesses Comparison
This table compares the strengths and weaknesses of Kimberly-Clark Corporation and Spectrum Brands Holdings, Inc.:
Kimberly-Clark Strengths
- Strong net margin at 11.74%
- Favorable dividend yield of 4.94%
- Low debt-to-assets ratio
- High interest coverage ratio at 9.73
Spectrum Brands Strengths
- Favorable WACC at 5.48%
- Strong fixed asset turnover at 8.55
- Healthy liquidity ratios (current 2.26, quick 1.41)
- Favorable PE and PB ratios
- Moderate dividend yield at 3.57%
Kimberly-Clark Weaknesses
- Unfavorable ROE and ROIC at 0%
- Poor liquidity ratios (current and quick at 0)
- Unavailable WACC data
- Unfavorable asset and fixed asset turnover
- Neutral PE ratio
Spectrum Brands Weaknesses
- Unfavorable net margin at 3.56%
- Low ROE at 5.23% and ROIC at 4.31%
- Moderate interest coverage ratio at 3.91 (neutral)
- Neutral asset turnover at 0.83
Kimberly-Clark shows strong profitability and conservative leverage but suffers from weak returns and liquidity concerns. Spectrum Brands demonstrates better liquidity and asset efficiency but struggles with profitability and return metrics. Each company’s strengths and weaknesses highlight different strategic priorities.
The Moat Duel: Analyzing Competitive Defensibility
A structural moat is the only shield protecting long-term profits from relentless competitive erosion. Let’s dissect how Kimberly-Clark and Spectrum Brands defend their turf:
Kimberly-Clark Corporation: Intangible Assets and Brand Loyalty
Kimberly-Clark’s moat stems from its iconic brands like Kleenex and Huggies. This translates into stable margins and a solid 14.5% EBIT margin despite recent revenue declines. In 2026, innovation in personal care could deepen its entrenched market presence.
Spectrum Brands Holdings, Inc.: Diversified Product Portfolio
Spectrum Brands relies on a broad product mix spanning pet care to home appliances, contrasting Kimberly-Clark’s focused brand strength. Its EBIT margin lags at 4.2%, but improving ROIC hints at operational turnaround. Expansion in pet care could spur growth and fortify its moat.
Brand Loyalty vs. Diversification: Who Holds the Stronger Moat?
Kimberly-Clark’s intangible asset moat is deeper, powered by high profitability and brand trust. Spectrum Brands shows promise with rising ROIC but remains a value destroyer overall. Kimberly-Clark is better positioned to defend market share amid competitive pressures.
Which stock offers better returns?
The past year shows divergent trading dynamics: Kimberly-Clark’s shares declined steadily, while Spectrum Brands reversed its downward trend with recent gains. Volumes shifted accordingly, reflecting changing investor sentiment.
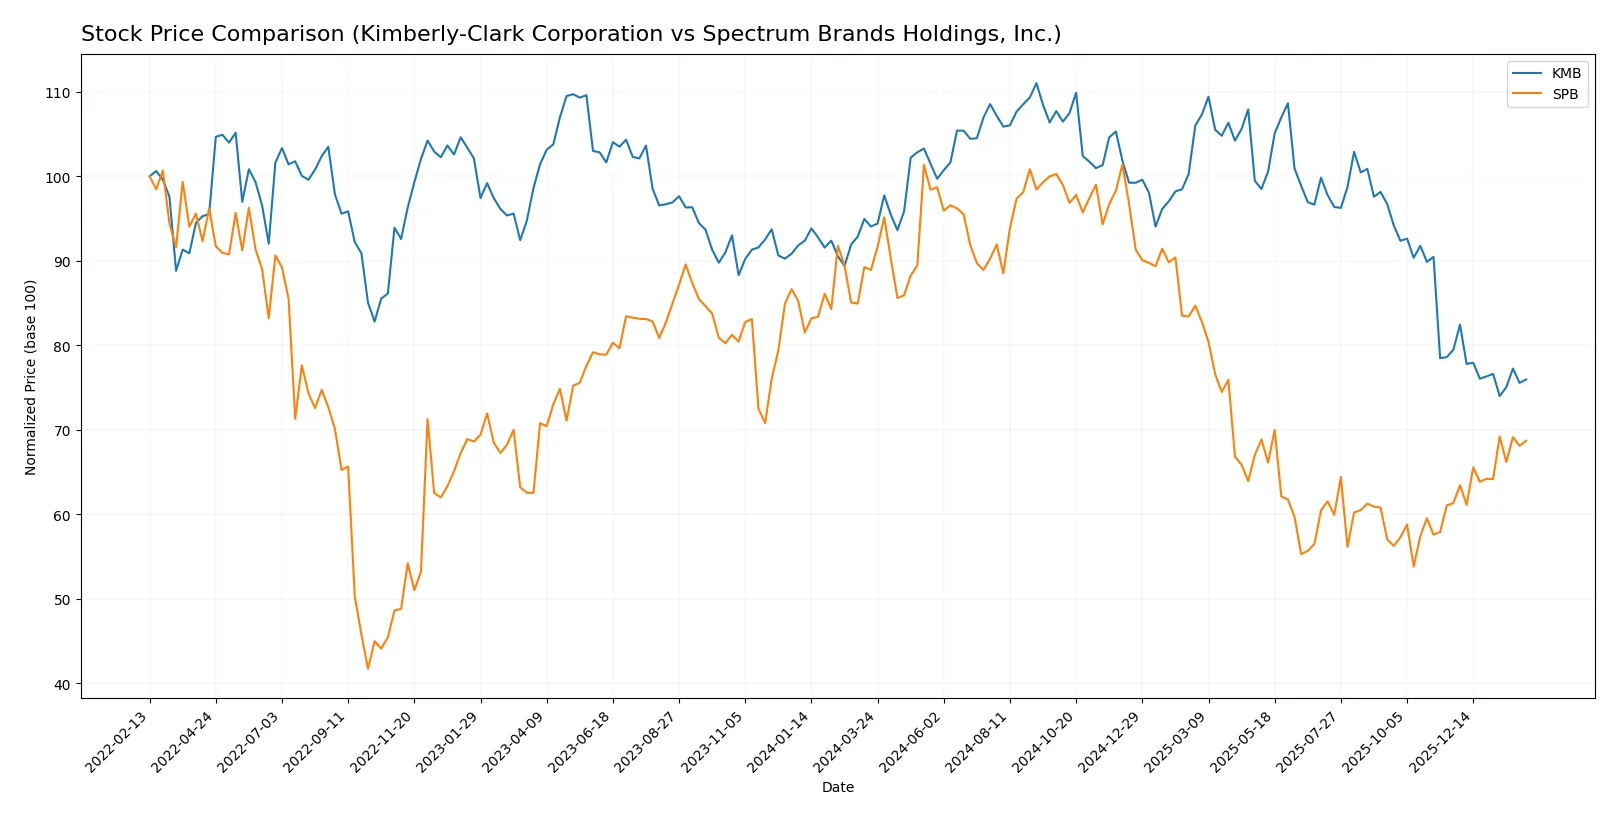
Trend Comparison
Kimberly-Clark’s stock fell 19.24% over the past year, marking a bearish trend with decelerating losses. The price ranged from a high of 146.91 to a low near 97.92, reflecting significant volatility (12.81 std dev).
Spectrum Brands dropped 22.72% over the year, also bearish but with accelerating losses. Its price fluctuated between 94.88 and 50.35, showing higher volatility (15.07 std dev). Recently, it gained 12.03%, indicating a bullish short-term reversal.
Spectrum Brands delivered the highest recent market performance with a 12.03% gain versus Kimberly-Clark’s 4.43% loss in the same period. Overall, both stocks faced yearly declines, but Spectrum shows stronger recovery signs.
Target Prices
Analysts offer a clear consensus on target prices for Kimberly-Clark Corporation and Spectrum Brands Holdings.
| Company | Target Low | Target High | Consensus |
|---|---|---|---|
| Kimberly-Clark Corporation | 102 | 162 | 122.38 |
| Spectrum Brands Holdings, Inc. | 75 | 75 | 75 |
Kimberly-Clark’s consensus target sits 22% above its current price of 99.99, signaling moderate upside potential. Spectrum Brands’ fixed target of 75 suggests a 17.7% premium to the current price of 63.71.

Don’t Let Luck Decide Your Entry Point
Optimize your entry points with our advanced ProRealTime indicators. You’ll get efficient buy signals with precise price targets for maximum performance. Start outperforming now!
How do institutions grade them?
Kimberly-Clark Corporation Grades
The following table lists recent grades from established financial institutions for Kimberly-Clark Corporation.
| Grading Company | Action | New Grade | Date |
|---|---|---|---|
| UBS | Maintain | Neutral | 2026-01-28 |
| Citigroup | Maintain | Sell | 2026-01-14 |
| UBS | Maintain | Neutral | 2026-01-14 |
| TD Cowen | Maintain | Hold | 2026-01-08 |
| Wells Fargo | Maintain | Equal Weight | 2026-01-05 |
| Citigroup | Maintain | Sell | 2025-12-17 |
| BNP Paribas Exane | Maintain | Neutral | 2025-12-01 |
| Argus Research | Upgrade | Buy | 2025-11-13 |
| Wells Fargo | Maintain | Equal Weight | 2025-11-04 |
| Evercore ISI Group | Downgrade | In Line | 2025-11-04 |
Spectrum Brands Holdings, Inc. Grades
Below is a summary of recent reliable grades for Spectrum Brands Holdings, Inc.
| Grading Company | Action | New Grade | Date |
|---|---|---|---|
| Canaccord Genuity | Maintain | Buy | 2025-11-17 |
| Wells Fargo | Maintain | Equal Weight | 2025-11-14 |
| Wells Fargo | Maintain | Equal Weight | 2025-09-25 |
| Canaccord Genuity | Maintain | Buy | 2025-08-08 |
| Wells Fargo | Maintain | Equal Weight | 2025-07-09 |
| Canaccord Genuity | Maintain | Buy | 2025-06-25 |
| UBS | Maintain | Buy | 2025-05-09 |
| UBS | Maintain | Buy | 2025-04-17 |
| Wells Fargo | Maintain | Equal Weight | 2025-04-16 |
| Wells Fargo | Maintain | Equal Weight | 2025-04-02 |
Which company has the best grades?
Spectrum Brands Holdings, Inc. consistently earns “Buy” and “Equal Weight” ratings, showing more positive sentiment than Kimberly-Clark. Kimberly-Clark’s grades lean toward “Neutral” and “Sell,” which may signal caution for investors.
Risks specific to each company
The following categories identify the critical pressure points and systemic threats facing both firms in the 2026 market environment:
1. Market & Competition
Kimberly-Clark Corporation
- Strong brand portfolio in personal care and tissue products; faces stiff competition in consumer staples.
Spectrum Brands Holdings, Inc.
- Diverse product segments dilute focus; competes in highly fragmented markets with numerous niche players.
2. Capital Structure & Debt
Kimberly-Clark Corporation
- Very low debt levels, strong interest coverage at 9.73, but unfavorable current and quick ratios signal liquidity concerns.
Spectrum Brands Holdings, Inc.
- Moderate leverage with debt-to-assets at 19.36%, solid current and quick ratios indicate healthy liquidity position.
3. Stock Volatility
Kimberly-Clark Corporation
- Beta of 0.277 reflects low volatility, appealing for risk-averse investors.
Spectrum Brands Holdings, Inc.
- Higher beta of 0.681 indicates moderate stock price volatility relative to the market.
4. Regulatory & Legal
Kimberly-Clark Corporation
- Subject to consumer product safety and environmental regulations globally, potentially costly compliance.
Spectrum Brands Holdings, Inc.
- Faces regulatory scrutiny across multiple product categories including pesticides and pet care, increasing legal complexity.
5. Supply Chain & Operations
Kimberly-Clark Corporation
- Extensive global supply chain vulnerable to raw material price fluctuations and logistics disruptions.
Spectrum Brands Holdings, Inc.
- Supply chain complexity due to diversified product lines increases operational risks and cost pressures.
6. ESG & Climate Transition
Kimberly-Clark Corporation
- Increasing pressure to improve sustainability in product sourcing and manufacturing processes.
Spectrum Brands Holdings, Inc.
- ESG risks amplified by pesticide products and environmental impact of pet care segment.
7. Geopolitical Exposure
Kimberly-Clark Corporation
- Global footprint exposes company to trade tensions and currency risks, especially in emerging markets.
Spectrum Brands Holdings, Inc.
- Primarily US-based but some exposure to international markets that may face geopolitical uncertainties.
Which company shows a better risk-adjusted profile?
Kimberly-Clark’s primary risk lies in liquidity and operational exposure despite its stable market position. Spectrum Brands faces higher financial distress risks indicated by its Altman Z-score in the distress zone but benefits from better liquidity and diversification. Kimberly-Clark’s low stock volatility and stronger cash flow metrics support a more stable risk profile. However, Spectrum’s broader product mix and favorable capital structure ratios offer upside if operational risks are managed. Recent financial evaluations highlight Kimberly-Clark’s liquidity gaps as a red flag, whereas Spectrum’s bankruptcy risk remains a critical concern. Overall, Kimberly-Clark shows a better risk-adjusted profile for conservative investors focused on stability.
Final Verdict: Which stock to choose?
Kimberly-Clark’s superpower lies in its resilient cash generation and solid dividend yield, making it a dependable cash machine. Its point of vigilance is the declining revenue trend and stretched liquidity ratios, which could pressure near-term flexibility. It suits portfolios seeking steady income with moderate growth exposure.
Spectrum Brands commands a strategic moat through its diversified product portfolio and stronger liquidity position, offering more safety relative to Kimberly-Clark. While profitability metrics lag, its improving ROIC trend signals operational recovery. It fits growth-at-a-reasonable-price (GARP) portfolios looking for value with upside potential.
If you prioritize reliable cash flow and dividend income, Kimberly-Clark is the compelling choice due to its consistent free cash flow and shareholder returns. However, if you seek improving operational efficiency and better financial stability, Spectrum Brands offers superior risk management and rebound potential. Both carry risks; your decision hinges on your investment horizon and risk tolerance.
Disclaimer: Investment carries a risk of loss of initial capital. The past performance is not a reliable indicator of future results. Be sure to understand risks before making an investment decision.
Go Further
I encourage you to read the complete analyses of Kimberly-Clark Corporation and Spectrum Brands Holdings, Inc. to enhance your investment decisions: