Home > Comparison > Consumer Defensive > KMB vs NUS
The competitive dynamic between Kimberly-Clark Corporation and Nu Skin Enterprises shapes the consumer defensive sector’s evolution. Kimberly-Clark operates as a capital-intensive household products giant, while Nu Skin focuses on high-margin beauty and wellness solutions. This analysis explores their contrasting operational models and growth trajectories. I aim to identify which company offers a superior risk-adjusted return, informing portfolio decisions amid shifting consumer trends and economic cycles.
Table of contents
Companies Overview
Kimberly-Clark and Nu Skin stand as key players in the global household and personal products space, each targeting distinct market segments.
Kimberly-Clark Corporation: Global Consumer Tissue and Personal Care Leader
Kimberly-Clark dominates with a diversified product portfolio spanning personal care, consumer tissue, and professional segments. It generates revenue primarily by selling trusted brands like Huggies, Kleenex, and Kotex through retail and away-from-home channels worldwide. In 2026, its strategic focus remains on expanding market penetration and innovation in personal hygiene and professional hygiene products.
Nu Skin Enterprises, Inc.: Innovative Beauty and Wellness Specialist
Nu Skin specializes in premium beauty and wellness products, including anti-aging skin care and nutritional supplements. Its core revenue stems from direct sales and distributors promoting brands like ageLOC and Pharmanex globally, with retail presence in Mainland China. The company’s 2026 strategy prioritizes product development and expanding its footprint in emerging wellness markets.
Strategic Collision: Similarities & Divergences
Both companies operate in consumer defensives but diverge sharply in business models—Kimberly-Clark favors a mass-market, multi-channel distribution system, while Nu Skin pursues a direct-to-consumer, network-driven approach. Their battle for market share centers on consumer loyalty and innovation in personal care products. Investors face contrasting profiles: Kimberly-Clark offers stability and scale, whereas Nu Skin presents higher growth potential paired with elevated volatility.
Income Statement Comparison
This comparison dissects the core profitability and scalability of both corporate engines to reveal who dominates the bottom line:
| Metric | Kimberly-Clark Corporation (KMB) | Nu Skin Enterprises, Inc. (NUS) |
|---|---|---|
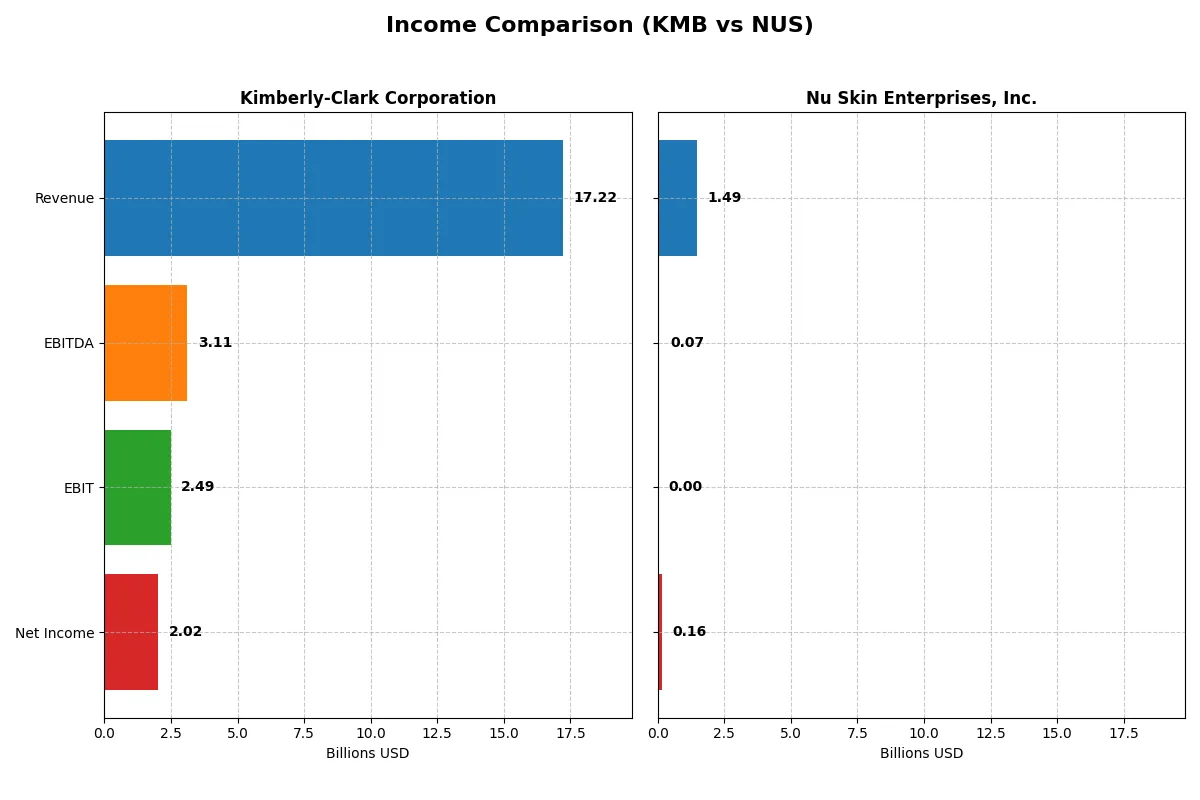
| Revenue | 17.2B | 1.49B |
| Cost of Revenue | 11.1B | 454M |
| Operating Expenses | 3.64B | 941M |
| Gross Profit | 6.13B | 1.03B |
| EBITDA | 3.11B | 66M |
| EBIT | 2.49B | 0 |
| Interest Expense | 256M | 14M |
| Net Income | 2.02B | 160M |
| EPS | 6.08 | 3.25 |
| Fiscal Year | 2025 | 2025 |
Income Statement Analysis: The Bottom-Line Duel
This income statement comparison reveals which company runs a more efficient and profitable operating engine in the current corporate landscape.
Kimberly-Clark Corporation Analysis
Kimberly-Clark’s revenue declined by 14% in 2025 to $17.2B, reflecting weaker top-line momentum. Despite this, net income rose modestly to $2.02B, supported by a solid 35.6% gross margin and a healthy 11.7% net margin. Margin contraction and lower EBIT highlight operational challenges, though overall profit growth over five years remains positive.
Nu Skin Enterprises, Inc. Analysis
Nu Skin posted a 14% revenue drop to $1.49B in 2025, continuing a longer-term downward trend. Yet it bounced back from prior losses, generating $160M net income and maintaining an impressive 69.5% gross margin. The firm’s net margin improved sharply, signaling better cost control and operating leverage despite revenue headwinds.
Margin Resilience vs. Revenue Scale
Kimberly-Clark offers scale with stable profitability, but its recent margin compression signals operational pressures. Nu Skin, though smaller, demonstrates striking margin resilience and a strong net income rebound. Investors seeking steady profit generation may lean toward Kimberly-Clark, while those favoring margin recovery and growth potential might find Nu Skin’s profile more compelling.
Financial Ratios Comparison
These vital ratios act as a diagnostic tool to expose the underlying fiscal health, valuation premiums, and capital efficiency of the companies compared below:
| Ratios | Kimberly-Clark Corporation (KMB) | Nu Skin Enterprises, Inc. (NUS) |
|---|---|---|
| ROE | 1.35 | 0.20 |
| ROIC | 0.18 | 0.05 |
| P/E | 16.63 | 2.96 |
| P/B | 22.37 | 0.59 |
| Current Ratio | 0.75 | 2.08 |
| Quick Ratio | 0.54 | 1.40 |
| D/E | 4.77 | 0.35 |
| Debt-to-Assets | 0.42 | 0.20 |
| Interest Coverage | 9.72 | 4.71 |
| Asset Turnover | 1.00 | 1.06 |
| Fixed Asset Turnover | 2.54 | 3.29 |
| Payout Ratio | 0.82 | 0.07 |
| Dividend Yield | 4.94% | 2.50% |
| Fiscal Year | 2025 | 2025 |
Efficiency & Valuation Duel: The Vital Signs
Ratios serve as a company’s DNA, unveiling hidden risks and operational strengths that shape investor decisions in nuanced ways.
Kimberly-Clark Corporation
Kimberly-Clark displays robust profitability with a stellar 135% ROE and solid 11.7% net margin. Its P/E of 16.6 suggests a fairly valued stock, yet a high P/B of 22.4 signals stretched equity valuation. The company rewards shareholders with a healthy 4.9% dividend yield, reflecting stable cash generation despite some liquidity concerns.
Nu Skin Enterprises, Inc.
Nu Skin posts a moderate 19.9% ROE and a 10.8% net margin, indicating operational efficiency. Its valuation is compelling, with a low P/E of 3.0 and P/B of 0.6, marking the stock as attractively priced. The firm maintains a 2.5% dividend yield and reinvests in growth, although interest coverage reveals potential financial strain.
Balanced Profitability vs. Attractive Valuation
Kimberly-Clark offers superior returns with a premium valuation, balancing risk through dividend income. Nu Skin presents a value-oriented profile with solid operational metrics but some financial risks. Investors prioritizing steady income may prefer Kimberly-Clark; those seeking value with growth potential might lean toward Nu Skin.
Which one offers the Superior Shareholder Reward?
Kimberly-Clark (KMB) delivers a robust 4.94% dividend yield with a high payout ratio near 82%, supported by solid free cash flow coverage around 59%. Its buyback activity is steady but moderate, enhancing shareholder value without overstretching leverage. Nu Skin (NUS) yields 2.50% with a low payout ratio under 8%, favoring reinvestment in growth and acquisitions. NUS aggressively repurchases shares, boosting total returns but carries higher debt leverage risks. I see KMB’s distribution as more sustainable, balancing income and capital return. For 2026, KMB offers a superior total return profile due to its reliable dividends and prudent buybacks, ideal for risk-conscious investors.
Comparative Score Analysis: The Strategic Profile
The radar chart reveals the fundamental DNA and trade-offs of Kimberly-Clark Corporation and Nu Skin Enterprises, Inc.:
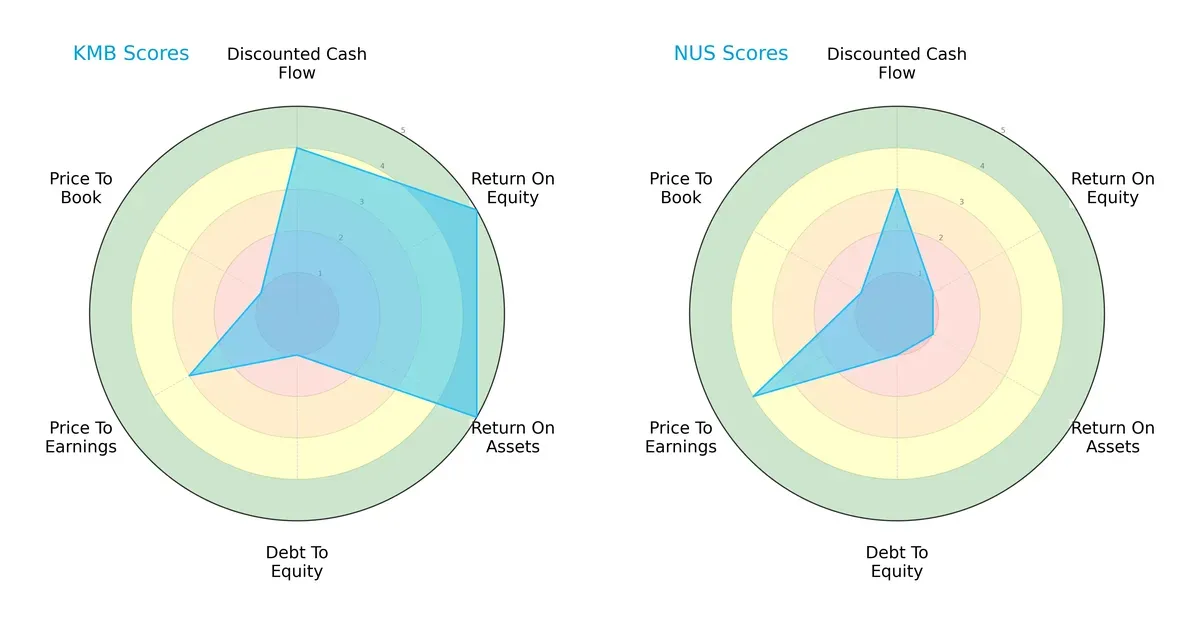
Kimberly-Clark shows strength in ROE and ROA with scores of 5 each, outperforming Nu Skin’s very low scores of 1 in both. KMB also leads in discounted cash flow with a score of 4 versus 3 for NUS. Both firms score poorly on debt-to-equity (1), signaling leverage concerns. Nu Skin’s valuation metrics are slightly better with a P/E score of 4 compared to KMB’s 3, but both share a very unfavorable price-to-book score of 1. Overall, Kimberly-Clark presents a more balanced, operationally efficient profile, while Nu Skin relies on valuation appeal amid weaker profitability.
—
Bankruptcy Risk: Solvency Showdown
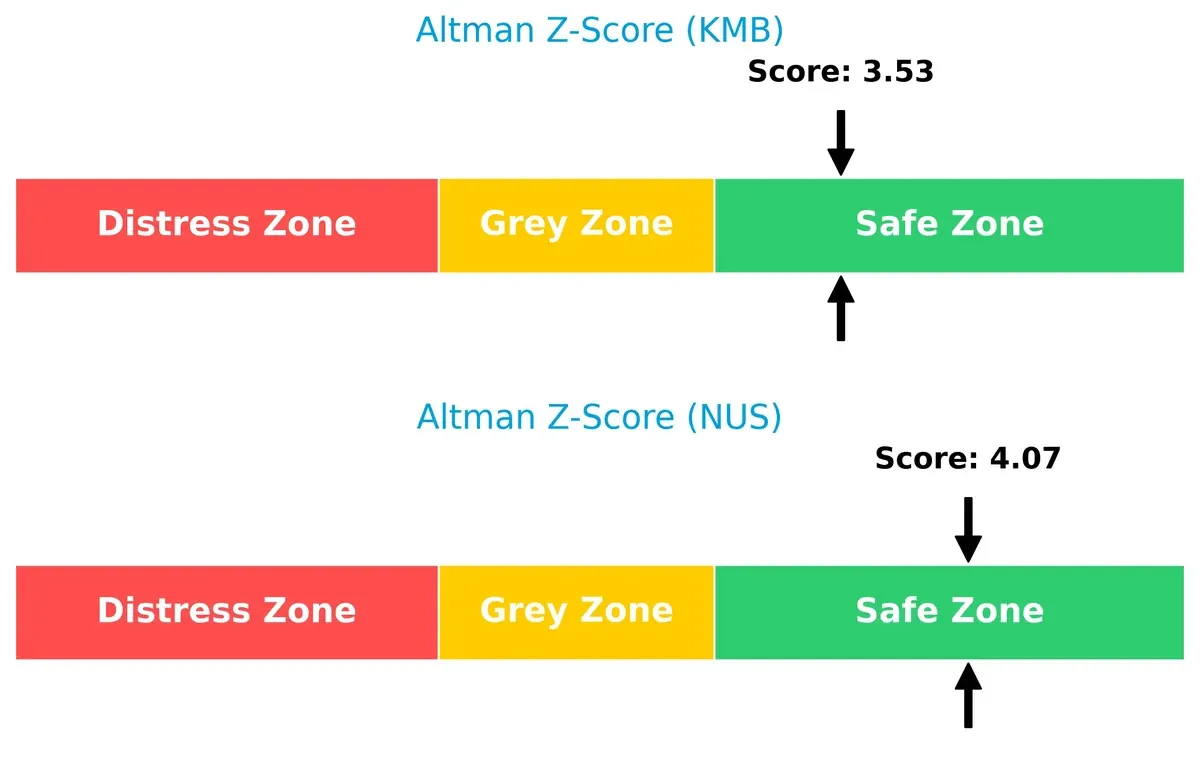
Kimberly-Clark and Nu Skin both reside in the safe zone, with Altman Z-Scores of 3.53 and 4.07 respectively, indicating strong long-term solvency and low bankruptcy risk in the current cycle:
—
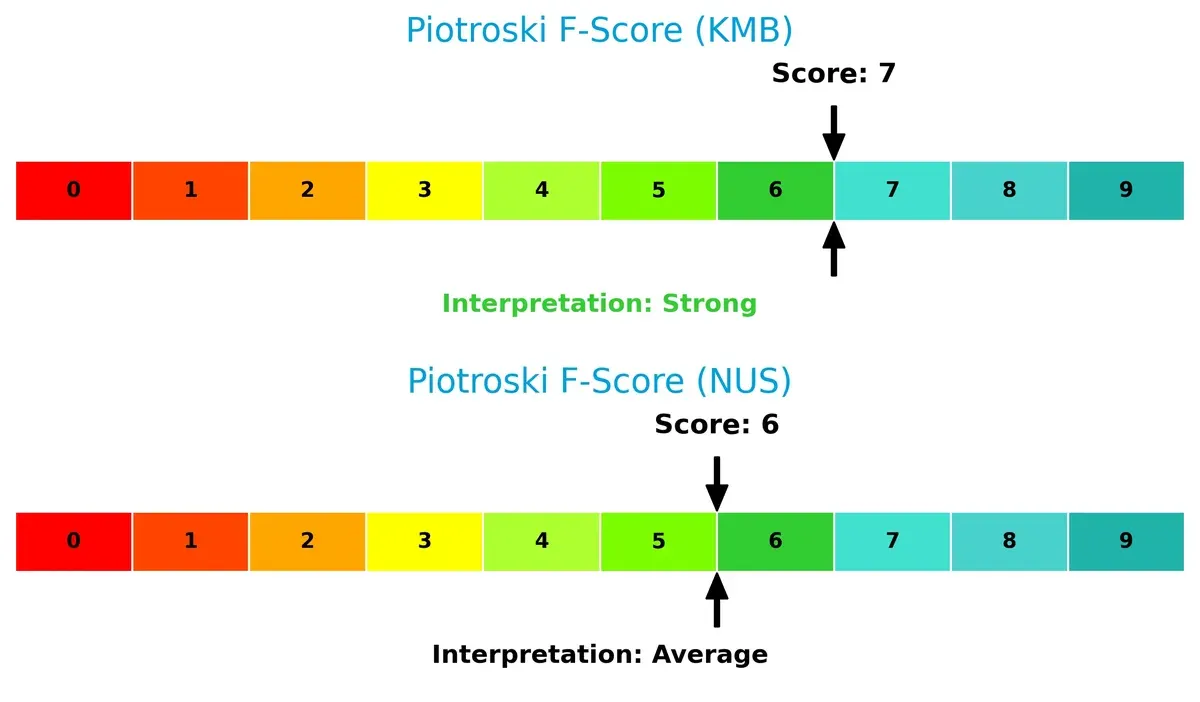
Financial Health: Quality of Operations
Kimberly-Clark scores 7 on the Piotroski F-Score, signaling strong financial health and solid internal metrics. Nu Skin’s score of 6, while decent, suggests average operational quality with potential red flags compared to KMB:
How are the two companies positioned?
This section dissects Kimberly-Clark and Nu Skin’s operational DNA by comparing revenue distribution and internal dynamics. It confronts their economic moats to reveal which model offers the most resilient, sustainable advantage today.
Revenue Segmentation: The Strategic Mix
This visual comparison dissects how Kimberly-Clark Corporation and Nu Skin Enterprises diversify income streams and reveals their primary sector bets:
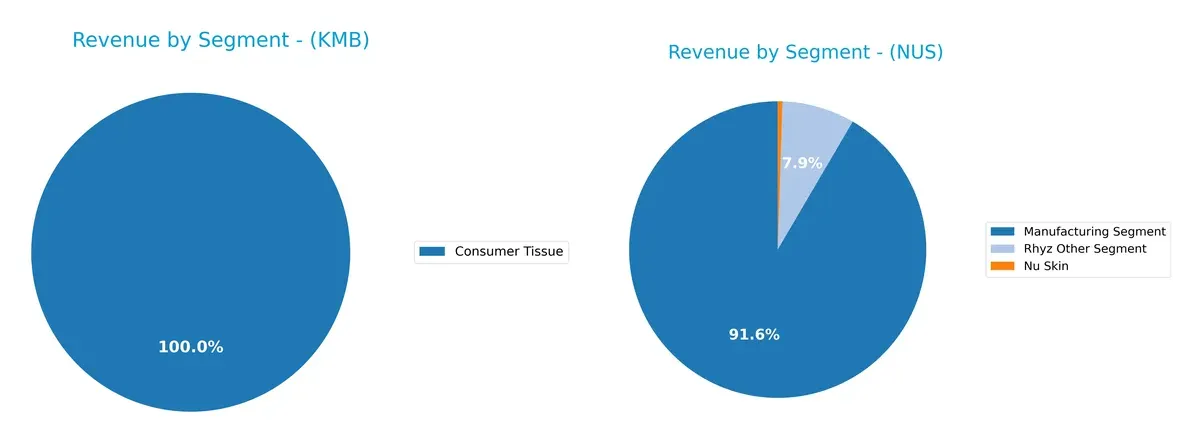
Kimberly-Clark anchors revenue in Personal Care (~$10.7B in 2023), with Consumer Tissue and K-C Professional adding diversification. Nu Skin pivots heavily on its Nu Skin segment (~$1.75B in 2023), dwarfing Manufacturing and smaller segments. Kimberly-Clark’s broader mix suggests stable consumer ecosystem lock-in, while Nu Skin’s reliance on a dominant segment exposes higher concentration risk but benefits from focused brand strength.
Strengths and Weaknesses Comparison
This table compares the strengths and weaknesses of Kimberly-Clark Corporation and Nu Skin Enterprises, Inc.:
Kimberly-Clark Strengths
- Diverse product segments including Consumer Tissue, K-C Professional, and Personal Care
- Strong profitability with ROE of 134.55% and ROIC 17.62% above WACC
- Large U.S. market presence with over 10B USD revenue
- Favorable dividend yield at 4.94%
- Solid interest coverage at 9.73
Nu Skin Strengths
- Strong balance sheet with low debt-to-equity of 0.35 and high current ratio of 2.08
- Favorable valuation with PE 2.96 and PB 0.59
- Global geographic diversification across Americas, Europe, Asia
- High asset turnover at 1.06 and fixed asset turnover at 3.29
- Favorable net margin and ROE at 10.79% and 19.9%
Kimberly-Clark Weaknesses
- Weak liquidity ratios: current ratio 0.75, quick ratio 0.54 below 1.0 standard
- High debt-to-equity at 4.77 raises financial risk
- Unfavorable PB at 22.37 suggests overvaluation
- Limited geographic diversification, heavily U.S.-centric revenues
Nu Skin Weaknesses
- Low ROIC at 4.62% below WACC of 6.46%, indicating inefficient capital use
- Zero interest coverage signals potential stress on debt servicing
- Smaller scale with revenues in hundreds of millions compared to KMB’s multibillion
- Relatively lower dividend yield at 2.5%
Overall, Kimberly-Clark dominates in scale, profitability, and U.S. market share but faces liquidity and leverage challenges. Nu Skin shows a stronger balance sheet and global diversification but must improve capital efficiency and debt coverage. These contrasts highlight differing strategic priorities and risk profiles.
The Moat Duel: Analyzing Competitive Defensibility
A structural moat is the only thing protecting long-term profits from the erosion of competition. Here’s how Kimberly-Clark and Nu Skin stack up:
Kimberly-Clark Corporation: Intangible Assets Moat
Kimberly-Clark’s moat stems from powerful brands and patents, driving steady 14.5% EBIT margins and 13% ROIC above WACC. In 2026, innovation in personal care products could deepen this moat.
Nu Skin Enterprises, Inc.: Cost and Brand Differentiation Moat
Nu Skin relies on premium skin care and direct sales, but its ROIC trails WACC, signaling value destruction. Growth hinges on expanding in Asia-Pacific, yet declining profitability threatens its moat’s durability.
Brand Power vs. Operational Efficiency: The Moat Verdict
Kimberly-Clark’s intangible asset moat is wider and more defensible, supported by consistent value creation and margin stability. Nu Skin’s shrinking ROIC and volatile margins leave it poorly positioned to defend market share.
Which stock offers better returns?
Over the past year, Kimberly-Clark and Nu Skin stocks both trended downward, with notable price volatility and shifts in buyer-seller dynamics influencing their trading patterns.
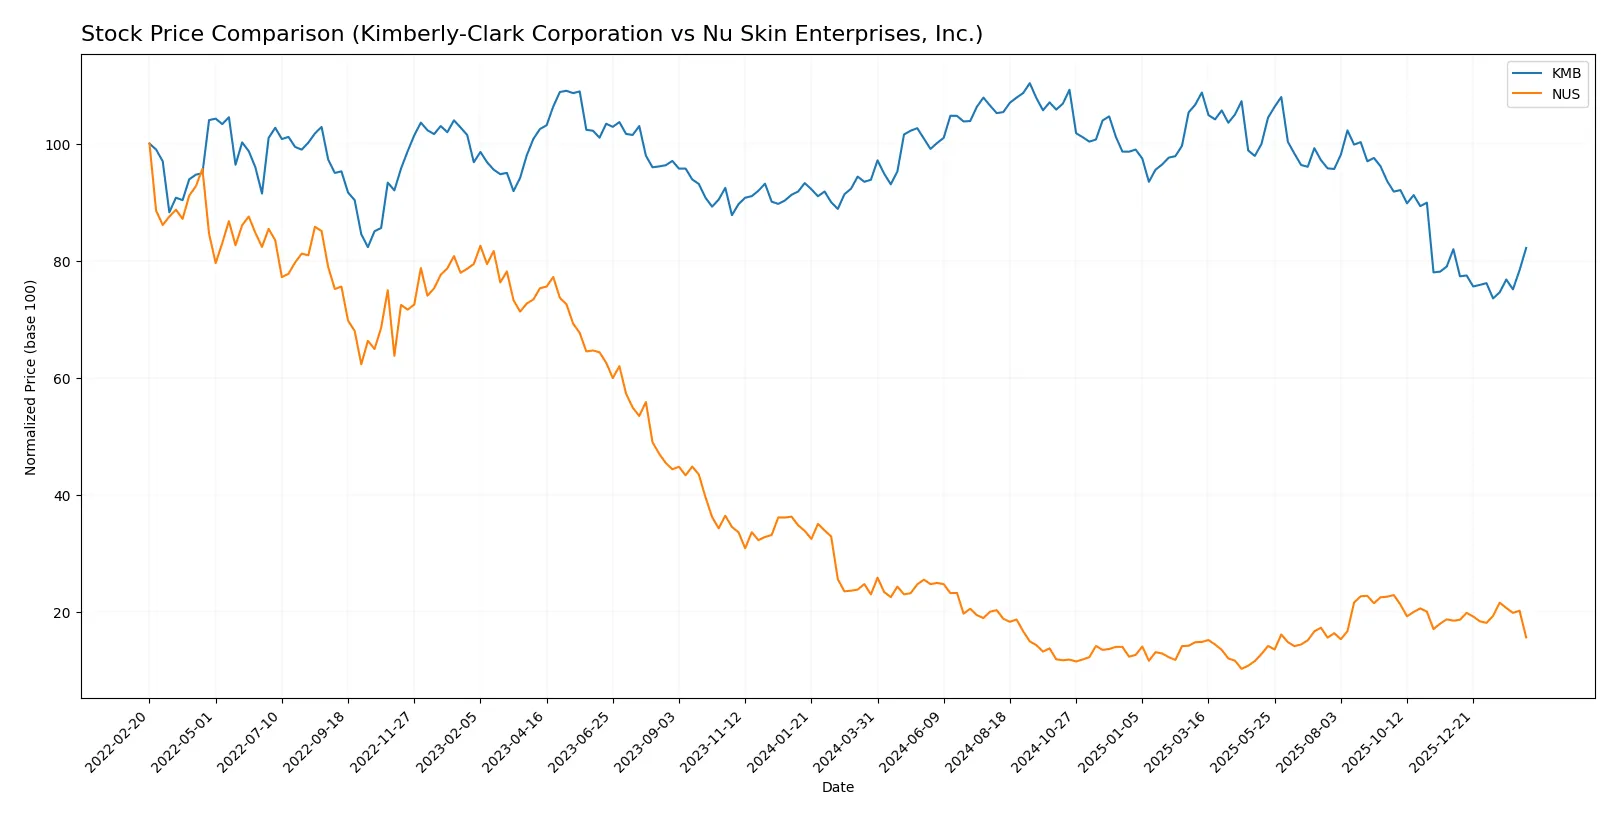
Trend Comparison
Kimberly-Clark’s stock fell 12.42% over 12 months, marking a bearish trend with accelerating decline. It fluctuated widely, hitting a high of 146.91 and a low of 97.92.
Nu Skin’s stock dropped 32.03% across the same period, also bearish with accelerating loss. Its price ranged between 13.83 and 5.48, showing less volatility than Kimberly-Clark.
Kimberly-Clark outperformed Nu Skin with a smaller decline and higher price volatility, delivering relatively better market performance over the past year.
Target Prices
Analysts provide a mixed but constructive outlook for Kimberly-Clark and Nu Skin Enterprises.
| Company | Target Low | Target High | Consensus |
|---|---|---|---|
| Kimberly-Clark Corporation | 102 | 162 | 122.38 |
| Nu Skin Enterprises, Inc. | 11 | 11 | 11 |
Kimberly-Clark’s consensus target of 122.38 suggests upside from its current 109.41 price, reflecting confidence in its stable consumer products moat. Nu Skin’s target at 11 implies a 32% premium over the 8.36 current price, signaling expected recovery despite recent volatility.

Don’t Let Luck Decide Your Entry Point
Optimize your entry points with our advanced ProRealTime indicators. You’ll get efficient buy signals with precise price targets for maximum performance. Start outperforming now!
How do institutions grade them?
Kimberly-Clark Corporation Grades
Below is a summary of recent grades issued by reputable institutions for Kimberly-Clark Corporation.
| Grading Company | Action | New Grade | Date |
|---|---|---|---|
| UBS | Maintain | Neutral | 2026-01-28 |
| UBS | Maintain | Neutral | 2026-01-14 |
| Citigroup | Maintain | Sell | 2026-01-14 |
| TD Cowen | Maintain | Hold | 2026-01-08 |
| Wells Fargo | Maintain | Equal Weight | 2026-01-05 |
| Citigroup | Maintain | Sell | 2025-12-17 |
| BNP Paribas Exane | Maintain | Neutral | 2025-12-01 |
| Argus Research | Upgrade | Buy | 2025-11-13 |
| Morgan Stanley | Maintain | Equal Weight | 2025-11-04 |
| Wells Fargo | Maintain | Equal Weight | 2025-11-04 |
Nu Skin Enterprises, Inc. Grades
The following table shows recent reliable grades for Nu Skin Enterprises, Inc. from established grading companies.
| Grading Company | Action | New Grade | Date |
|---|---|---|---|
| DA Davidson | Maintain | Neutral | 2024-12-20 |
| Citigroup | Maintain | Neutral | 2024-10-22 |
| DA Davidson | Maintain | Neutral | 2024-08-12 |
| Citigroup | Maintain | Neutral | 2024-08-09 |
| DA Davidson | Maintain | Neutral | 2024-05-09 |
| DA Davidson | Maintain | Neutral | 2024-01-05 |
| Stifel | Maintain | Hold | 2023-10-16 |
| Stifel | Maintain | Hold | 2023-10-15 |
| Citigroup | Maintain | Neutral | 2023-09-29 |
| Citigroup | Maintain | Neutral | 2023-09-28 |
Which company has the best grades?
Kimberly-Clark shows a wider range of ratings, including a recent Buy upgrade, while Nu Skin consistently receives Neutral or Hold grades. Kimberly-Clark’s mixed but occasionally positive outlook may attract investors seeking potential upside.
Risks specific to each company
The following categories identify the critical pressure points and systemic threats facing both firms in the 2026 market environment:
1. Market & Competition
Kimberly-Clark Corporation
- Operates in a mature, highly competitive household products sector with strong brand loyalty but limited growth.
Nu Skin Enterprises, Inc.
- Faces intense competition in beauty and wellness, with pressure from innovation cycles and direct sales model challenges.
2. Capital Structure & Debt
Kimberly-Clark Corporation
- High debt-to-equity ratio (4.77) signals elevated financial leverage and risk.
Nu Skin Enterprises, Inc.
- Low debt-to-equity (0.35) indicates conservative leverage and stronger balance sheet stability.
3. Stock Volatility
Kimberly-Clark Corporation
- Low beta (0.277) suggests stock is less volatile than the market, offering defensive stability.
Nu Skin Enterprises, Inc.
- Beta near 1 (1.014) implies stock moves roughly with market, reflecting higher volatility risk.
4. Regulatory & Legal
Kimberly-Clark Corporation
- Subject to consumer product safety and environmental regulations with moderate litigation risk.
Nu Skin Enterprises, Inc.
- Faces regulatory scrutiny on product claims and international compliance, increasing legal exposure.
5. Supply Chain & Operations
Kimberly-Clark Corporation
- Global supply chain complexity heightens risk of disruptions and cost inflation.
Nu Skin Enterprises, Inc.
- Smaller scale operations and reliance on direct sales may limit supply chain risks but constrain scalability.
6. ESG & Climate Transition
Kimberly-Clark Corporation
- Pressure to reduce environmental footprint in packaging and manufacturing amid rising ESG investor focus.
Nu Skin Enterprises, Inc.
- Emerging ESG initiatives but less comprehensive, posing potential reputational and compliance risks.
7. Geopolitical Exposure
Kimberly-Clark Corporation
- Diversified global presence exposes it to trade tensions and currency fluctuations.
Nu Skin Enterprises, Inc.
- Significant China operations increase vulnerability to geopolitical tensions and regulatory shifts.
Which company shows a better risk-adjusted profile?
Kimberly-Clark’s greatest risk lies in its high financial leverage, which could strain resilience in economic downturns. Nu Skin faces its largest risk from volatile market performance and geopolitical exposure in China. Despite Kimberly-Clark’s leverage concerns, its defensive stock volatility and strong profitability metrics suggest a more balanced risk-adjusted profile. Nu Skin’s higher volatility and regulatory complexities, combined with weaker coverage ratios, justify heightened caution. The sharp 18% share price drop for Nu Skin highlights immediate market concerns.
Final Verdict: Which stock to choose?
Kimberly-Clark’s superpower lies in its robust capital efficiency and consistent value creation, reflected by strong ROIC well above its WACC. Its point of vigilance is the stretched liquidity ratios, indicating potential short-term cash flow pressure. This stock suits portfolios targeting steady income with moderate growth in defensive sectors.
Nu Skin’s strategic moat centers on its attractive valuation and a conservative balance sheet, offering a safety cushion relative to Kimberly-Clark. However, its declining ROIC and weaker profitability trends suggest caution. It fits growth-oriented portfolios willing to embrace volatility for deep value opportunities.
If you prioritize durable capital efficiency and a stable dividend, Kimberly-Clark outshines with proven value creation but requires tolerance for liquidity constraints. However, if you seek undervalued growth with a strong balance sheet, Nu Skin offers better stability despite its current profitability headwinds. Each represents a distinct risk-reward profile aligned with different investor strategies.
Disclaimer: Investment carries a risk of loss of initial capital. The past performance is not a reliable indicator of future results. Be sure to understand risks before making an investment decision.
Go Further
I encourage you to read the complete analyses of Kimberly-Clark Corporation and Nu Skin Enterprises, Inc. to enhance your investment decisions: