Home > Comparison > Consumer Defensive > KMB vs NWL
The strategic rivalry between Kimberly-Clark Corporation and Newell Brands Inc. shapes the competitive landscape of the Consumer Defensive sector. Kimberly-Clark operates as a capital-intensive manufacturer specializing in personal care and consumer tissue products. In contrast, Newell Brands focuses on a diversified portfolio spanning commercial solutions, home appliances, and outdoor products. This analysis will assess which company’s operational model offers a superior risk-adjusted outlook for a diversified portfolio in this evolving industry.
Table of contents
Companies Overview
Kimberly-Clark and Newell Brands shape the consumer products landscape with distinct footprints and strategic ambitions.
Kimberly-Clark Corporation: Leader in Personal Care & Tissue Products
Kimberly-Clark dominates the household and personal products sector with a focus on personal care, consumer tissue, and professional segments. Its revenue relies heavily on trusted brands like Huggies and Kleenex, driving sales through retail and away-from-home channels. In 2026, it prioritizes innovation and global brand penetration to maintain its competitive edge and steady cash flow.
Newell Brands Inc.: Diverse Consumer Goods Powerhouse
Newell Brands operates across five segments, offering a broad portfolio from commercial cleaning to outdoor gear. Its revenue engine depends on a mix of household, commercial, and recreational products under brands like Rubbermaid and Coleman. The company’s 2026 strategy revolves around streamlining operations and expanding digital sales channels to regain market traction and improve margins.
Strategic Collision: Similarities & Divergences
Both companies compete in the consumer defensive sector but differ markedly in scope and focus. Kimberly-Clark leans toward a concentrated product set with deep penetration, while Newell favors diversification across multiple consumer categories. Their primary battleground lies in retail and e-commerce channels, where brand loyalty and distribution efficiency dictate market share. This contrast creates distinct risk and growth profiles for investors evaluating steady cash flow versus turnaround potential.
Income Statement Comparison
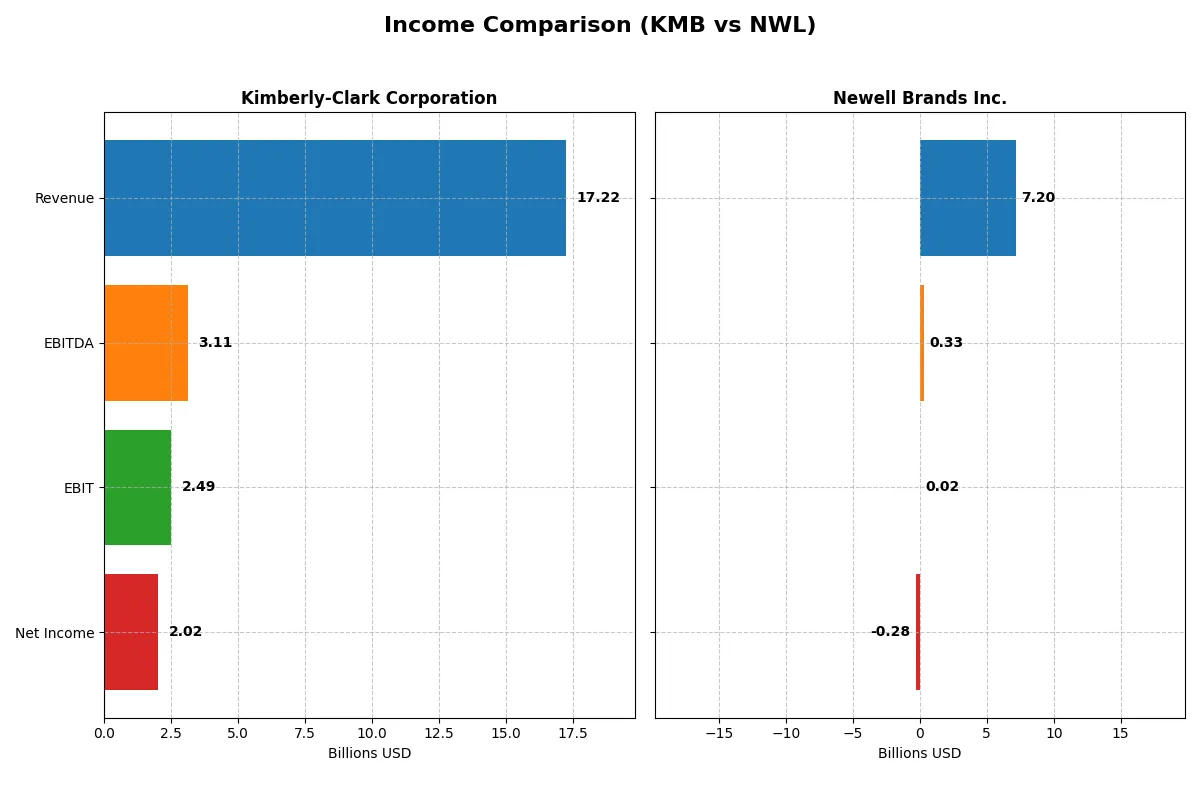
The following data dissects the core profitability and scalability of both corporate engines to reveal who dominates the bottom line:
| Metric | Kimberly-Clark Corporation (KMB) | Newell Brands Inc. (NWL) |
|---|---|---|
| Revenue | 17.2B | 7.2B |
| Cost of Revenue | 11.1B | 4.8B |
| Operating Expenses | 3.6B | 2.0B |
| Gross Profit | 6.1B | 2.4B |
| EBITDA | 3.1B | 331M |
| EBIT | 2.5B | 20M |
| Interest Expense | 256M | 321M |
| Net Income | 2.0B | -285M |
| EPS | 6.08 | -0.68 |
| Fiscal Year | 2025 | 2025 |
Income Statement Analysis: The Bottom-Line Duel
This income statement comparison reveals which company operates with stronger profitability and operational efficiency over recent years.
Kimberly-Clark Corporation Analysis
Kimberly-Clark’s revenue declined 14% in 2025 to $17.2B, yet net income rose to $2.02B, showing resilient profitability. Gross margin stands at a healthy 35.6%, and net margin at 11.7%, both favorable. Despite recent revenue pressure, margin stability and a 13% EPS growth over five years highlight operational efficiency and earnings momentum.
Newell Brands Inc. Analysis
Newell’s revenue fell nearly 5% in 2025 to $7.2B, with a net loss of $285M reflecting ongoing struggles. Its gross margin of 33.8% remains decent, but net margin at -4% signals profitability issues. EBIT margin of 0.3% highlights weak operating leverage. Overall, Newell shows deteriorating earnings and margin contraction over the period, lacking positive momentum.
Margin Strength vs. Earnings Durability
Kimberly-Clark clearly outperforms Newell with consistent positive net income and superior margin profiles. Kimberly-Clark’s ability to maintain profitability amid revenue declines contrasts sharply with Newell’s ongoing losses and shrinking margins. For investors prioritizing financial resilience and margin durability, Kimberly-Clark offers a fundamentally stronger profile.
Financial Ratios Comparison
These vital ratios act as a diagnostic tool to expose the underlying fiscal health, valuation premiums, and capital efficiency of the companies compared below:
| Ratios | Kimberly-Clark Corporation (KMB) | Newell Brands Inc. (NWL) |
|---|---|---|
| ROE | 134.6% | -11.9% |
| ROIC | 17.6% | 5.1% |
| P/E | 16.6 | -5.5 |
| P/B | 22.4 | 0.65 |
| Current Ratio | 0.75 | 1.07 |
| Quick Ratio | 0.54 | 0.57 |
| D/E (Debt-to-Equity) | 4.77 | 2.32 |
| Debt-to-Assets | 41.6% | 51.7% |
| Interest Coverage | 9.7x | 1.39x |
| Asset Turnover | 1.00 | 0.67 |
| Fixed Asset Turnover | 2.54 | 4.33 |
| Payout Ratio | 82.1% | -42.1% |
| Dividend Yield | 4.94% | 7.71% |
| Fiscal Year | 2025 | 2025 |
Efficiency & Valuation Duel: The Vital Signs
Ratios act as a company’s DNA, uncovering hidden risks and operational strengths that shape investor confidence and valuation.
Kimberly-Clark Corporation
Kimberly-Clark displays robust profitability with a stellar 135% ROE and a strong 11.74% net margin, signaling operational excellence. The P/E ratio at 16.63 suggests a fairly valued stock, though its high P/B ratio at 22.37 appears stretched. The firm rewards shareholders with a healthy 4.94% dividend yield, reflecting steady cash returns.
Newell Brands Inc.
Newell struggles with negative profitability metrics, including a -11.92% ROE and -3.96% net margin, indicating operational challenges. Valuation metrics appear attractive: a negative P/E and low P/B of 0.65 suggest undervaluation. Despite weak earnings, it offers a respectable 7.71% dividend yield, though its high debt raises caution.
Premium Valuation vs. Operational Strain
Kimberly-Clark balances strong returns and reasonable valuation, managing risk better than Newell’s undervalued but financially troubled profile. Investors seeking stability lean toward Kimberly-Clark, while risk-tolerant profiles might consider Newell’s deep value with caution.
Which one offers the Superior Shareholder Reward?
I observe Kimberly-Clark (KMB) pays a solid 3.7%-4.9% dividend yield with a 64%-82% payout ratio, supported by strong free cash flow (FCF) coverage around 59%-78%. Newell Brands (NWL) shows higher dividend yields up to 7.7%, but suffers negative net margins and weak FCF coverage under 7%. KMB’s buybacks are implicit in steady payout ratios, while NWL’s balance sheet strain limits buyback capacity. I find KMB’s disciplined dividends and healthier cash flow profile more sustainable for long-term value. NWL’s high yield masks profitability risks and constrained capital returns. In 2026, Kimberly-Clark offers a superior total return profile with balanced income and capital preservation.
Comparative Score Analysis: The Strategic Profile
The radar chart reveals the fundamental DNA and trade-offs of Kimberly-Clark Corporation and Newell Brands Inc., highlighting their distinct financial strengths and vulnerabilities:
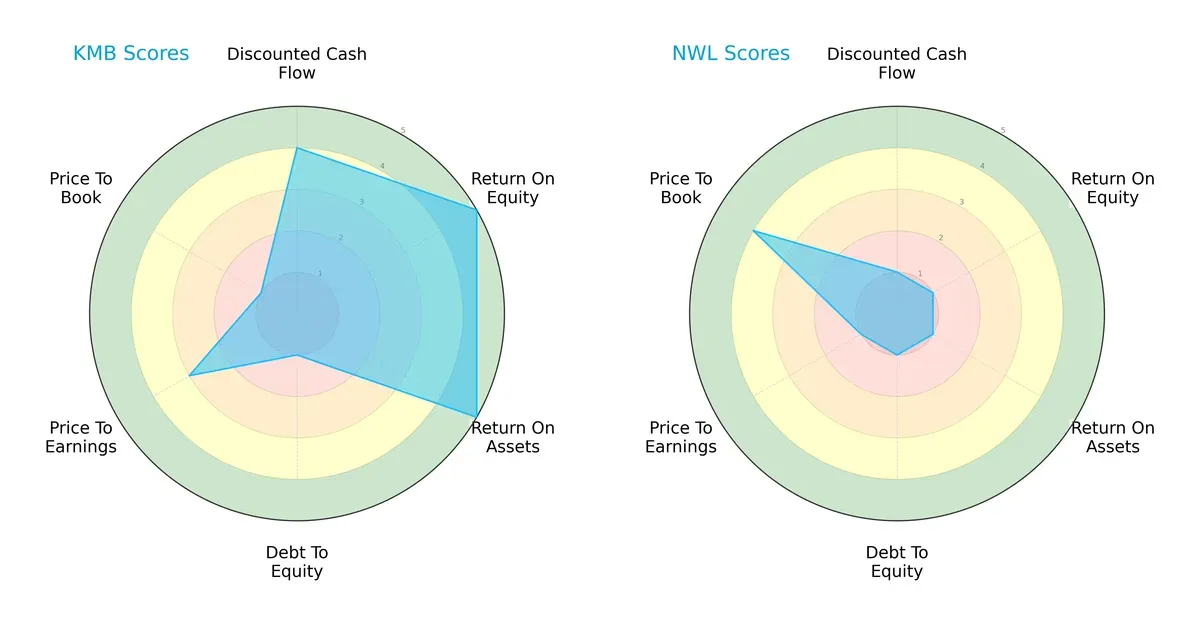
Kimberly-Clark dominates in profitability metrics with very favorable ROE and ROA scores of 5 each, compared to Newell’s weak scores of 1. Its DCF score of 4 also signals better cash flow prospects. However, Kimberly-Clark’s debt-to-equity and price-to-book scores are very unfavorable at 1, indicating balance sheet risks and potential overvaluation in book value terms. Newell relies on a relatively better price-to-book score of 4 but struggles across almost all other metrics, showing a highly unbalanced profile. Kimberly-Clark presents a more balanced and robust investment case.
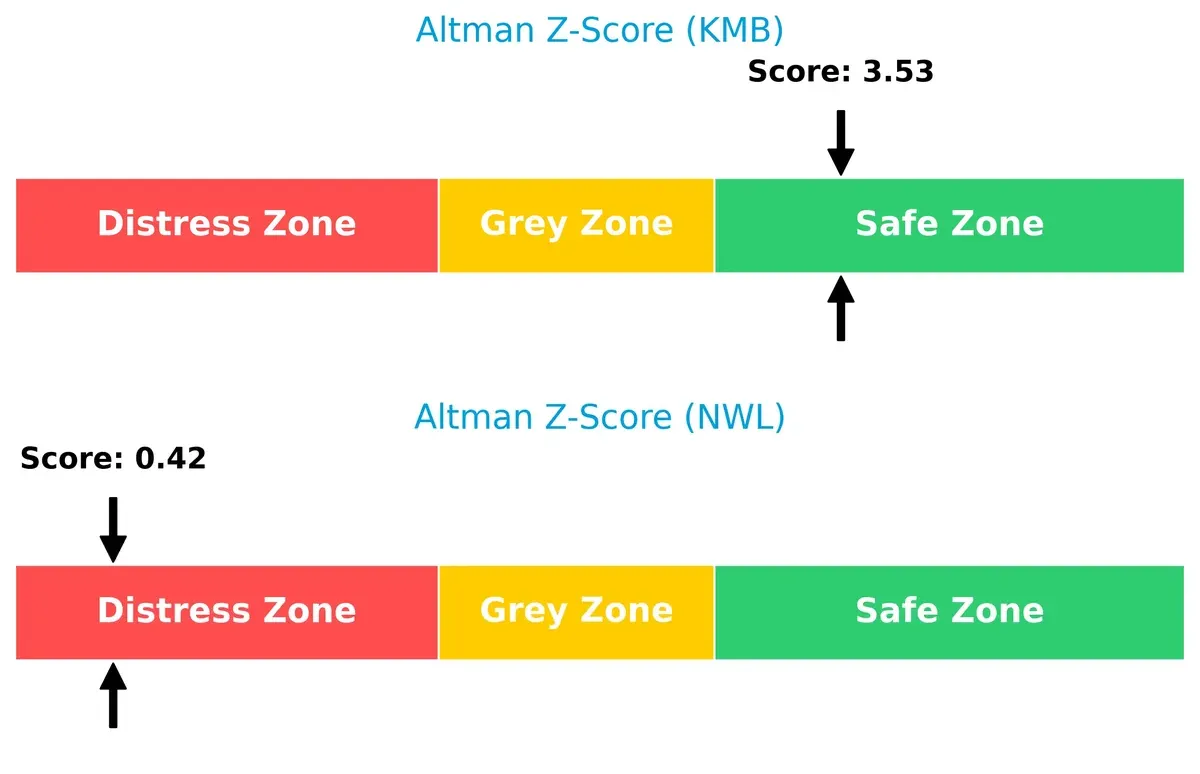
Bankruptcy Risk: Solvency Showdown
Kimberly-Clark’s Altman Z-Score of 3.53 places it safely in the safe zone, while Newell’s 0.42 signals distress. This gap implies a stark contrast in long-term survival prospects amid economic cycles:
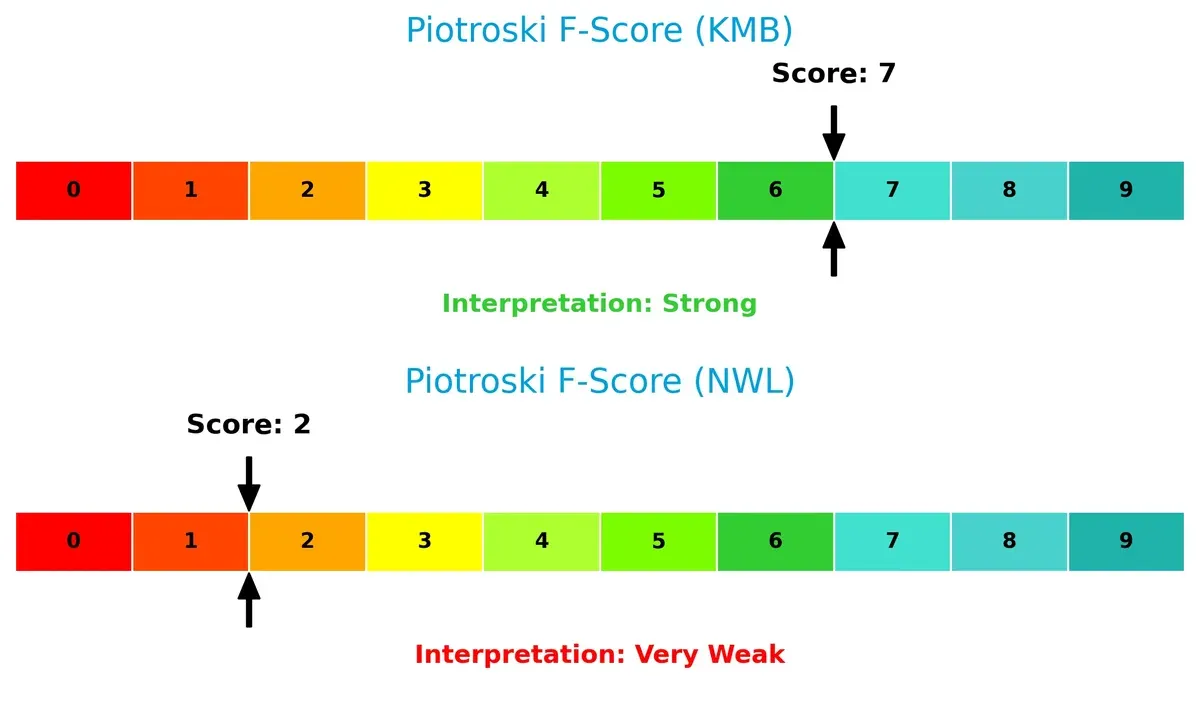
Financial Health: Quality of Operations
Kimberly-Clark’s Piotroski F-Score of 7 reflects strong financial health, suggesting solid profitability, liquidity, and operational efficiency. Newell’s score of 2 raises red flags, indicating weak internal metrics and financial distress:
How are the two companies positioned?
This section dissects Kimberly-Clark and Newell Brands’ operational DNA by comparing revenue distribution and internal strengths and weaknesses. The goal is to confront their economic moats and identify which model offers a more resilient, sustainable advantage today.
Revenue Segmentation: The Strategic Mix
This visual comparison dissects how Kimberly-Clark and Newell Brands diversify their income streams and where their primary sector bets lie:
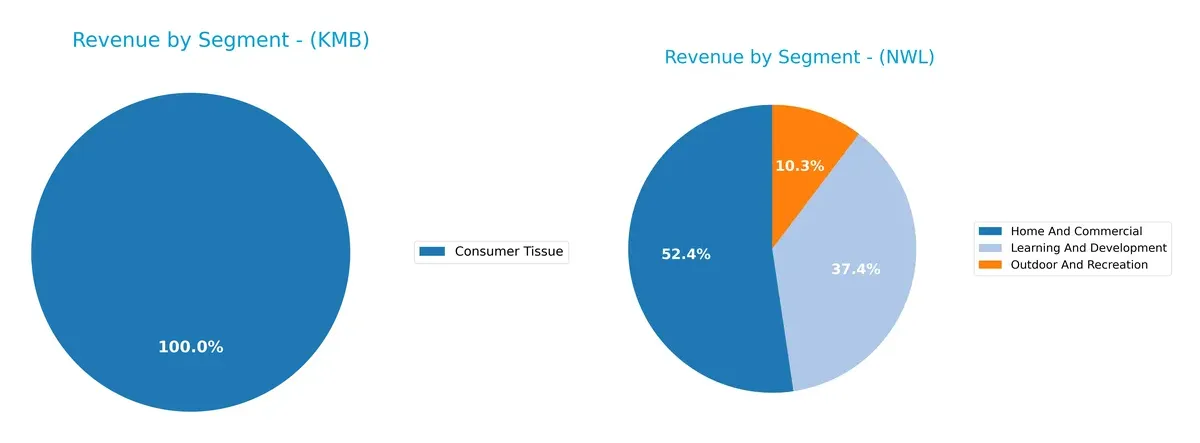
Kimberly-Clark pivots heavily on Personal Care, generating over $10B annually, with Consumer Tissue and K-C Professional anchoring the rest. This concentration signals strong ecosystem lock-in in hygiene and care markets. In contrast, Newell Brands displays more diversification, spreading revenues across Home & Commercial, Learning & Development, and Outdoor & Recreation segments. Newell’s mix reduces concentration risk but may face challenges in building deep moats compared to Kimberly-Clark’s focused dominance.
Strengths and Weaknesses Comparison
This table compares the Strengths and Weaknesses of Kimberly-Clark Corporation and Newell Brands Inc.:
Kimberly-Clark Corporation Strengths
- Strong profitability with 11.74% net margin and 134.55% ROE
- Efficient capital use with 17.62% ROIC below 4.59% WACC
- Stable dividend yield at 4.94%
- Solid innovation seen in consistent product segments
- Significant US revenue dominance at $10.1B
- Balanced asset turnover and interest coverage ratios
Newell Brands Inc. Strengths
- Diverse product range across multiple segments
- Favorable PE and PB ratios indicating undervaluation
- Global presence with $4.7B North America and $2.5B foreign revenues
- High fixed asset turnover at 4.33 signals efficient asset use
- Neutral current ratio implies reasonable short-term liquidity
- Exposure across home, learning, and outdoor markets
Kimberly-Clark Corporation Weaknesses
- Limited diversification with heavy reliance on consumer tissue and personal care
- Weak liquidity with low current (0.75) and quick ratios (0.54)
- High debt-to-equity ratio at 4.77 raises financial risk
- High price-to-book ratio at 22.37 signals possible overvaluation
- Moderate global diversification, mainly US-centric revenue
Newell Brands Inc. Weaknesses
- Negative profitability with -3.96% net margin and -11.92% ROE
- Poor interest coverage at 0.06 indicates high risk of financial distress
- Elevated debt-to-assets at 51.69% burdens financial flexibility
- Quick ratio of 0.57 and unfavorable debt-to-equity at 2.32
- Lower asset turnover of 0.67 limits operational efficiency
Overall, Kimberly-Clark excels in profitability and capital efficiency but faces liquidity and valuation challenges. Newell Brands shows strong product diversity and asset efficiency but struggles with profitability and financial stability. Both companies have distinct strategic priorities based on their strengths and weaknesses.
The Moat Duel: Analyzing Competitive Defensibility
A structural moat is the only barrier protecting long-term profits from relentless competitive erosion. Let’s examine the core moats of two industry players:
Kimberly-Clark Corporation: Intangible Assets and Brand Loyalty
Kimberly-Clark’s moat stems from powerful brand recognition and trusted consumer products. This manifests in stable margins and ROIC well above WACC, signaling efficient capital use. New product innovation and geographic expansion in 2026 may deepen this moat but requires vigilance against market shifts.
Newell Brands Inc.: Diversified Product Portfolio with Cost Pressures
Newell’s moat relies on product diversification across consumer and commercial segments, contrasting Kimberly-Clark’s focused brand strength. However, declining ROIC below WACC and margin compression weaken its competitive edge. Expansion into emerging markets offers opportunities but faces rising operational challenges in 2026.
Moat Strength Showdown: Brand Loyalty vs. Diversification Under Pressure
Kimberly-Clark’s wider and deeper moat, supported by consistent value creation and margin stability, outmatches Newell’s weakening competitive position. Kimberly-Clark is better equipped to defend market share amid evolving consumer preferences and competitive intensity.
Which stock offers better returns?
The past year shows distinct price dynamics for Kimberly-Clark and Newell Brands, with both stocks experiencing overall declines but differing recent momentum and trading volumes.
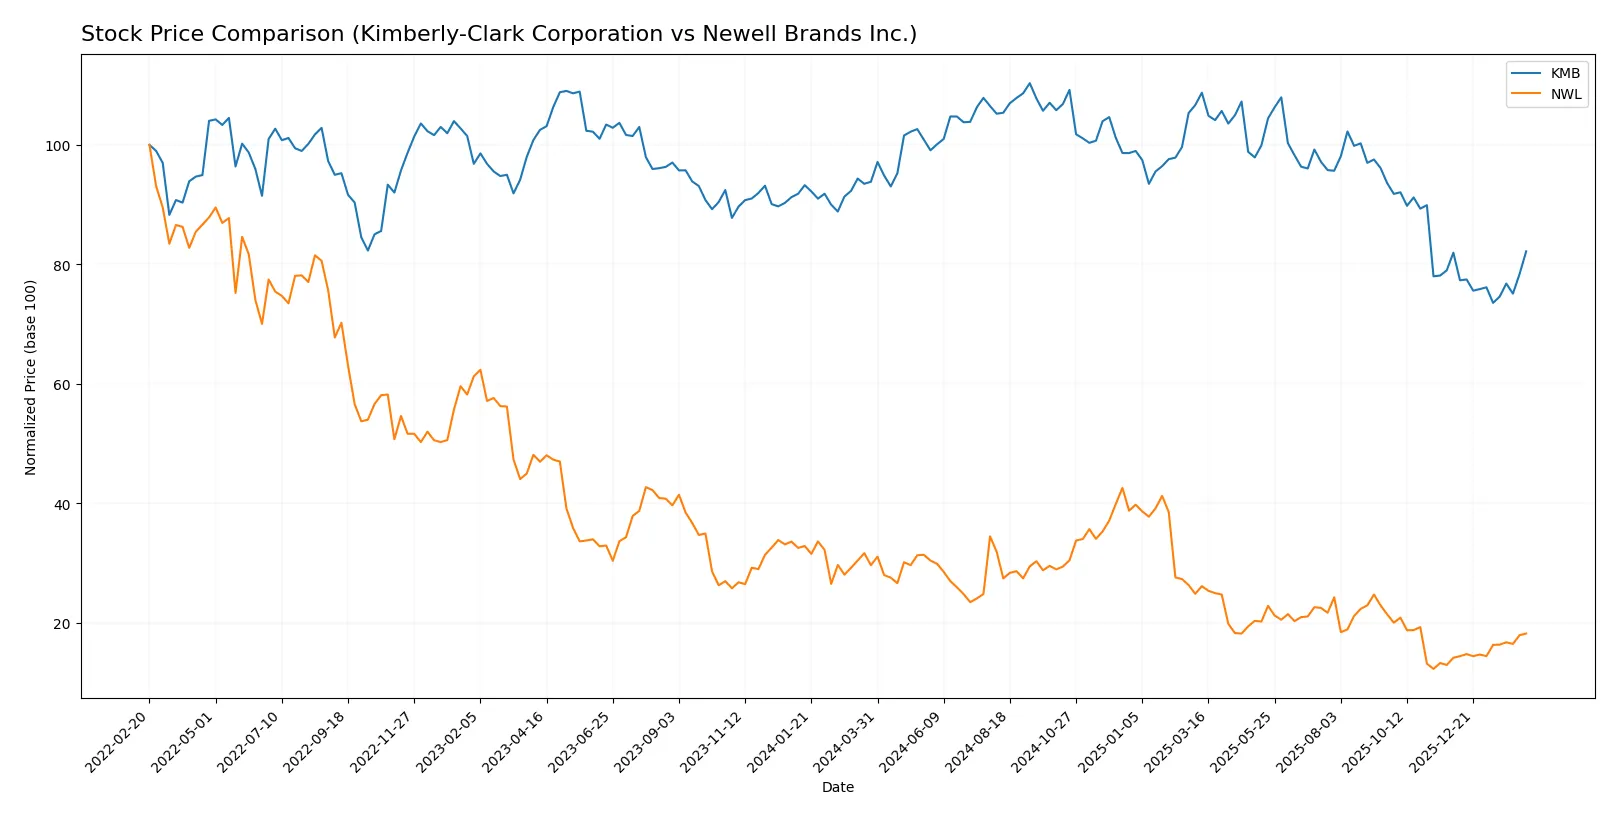
Trend Comparison
Kimberly-Clark’s stock fell 12.42% over the last 12 months, marking a bearish trend with accelerating decline. It hit a high of 146.91 and a low of 97.92, showing significant volatility.
Newell Brands declined 38.64% over the same period, also bearish with accelerating losses. Recent recovery of 28.77% signals a strong short-term reversal amid lower volatility.
Newell Brands delivered the weakest annual performance but shows stronger recent momentum. Kimberly-Clark’s loss is less severe, yet its short-term trend is neutral to slightly negative.
Target Prices
Analysts present a cautiously optimistic consensus for Kimberly-Clark and Newell Brands.
| Company | Target Low | Target High | Consensus |
|---|---|---|---|
| Kimberly-Clark Corporation | 102 | 162 | 122.38 |
| Newell Brands Inc. | 4.5 | 8 | 5.83 |
The consensus target for Kimberly-Clark exceeds its current price of 109.41, suggesting moderate upside. Newell Brands’ consensus target slightly surpasses its price of 4.7, indicating modest appreciation potential.

Don’t Let Luck Decide Your Entry Point
Optimize your entry points with our advanced ProRealTime indicators. You’ll get efficient buy signals with precise price targets for maximum performance. Start outperforming now!
How do institutions grade them?
Here is a summary of recent institutional grades for Kimberly-Clark Corporation and Newell Brands Inc.:
Kimberly-Clark Corporation Grades
The table below shows recent grades assigned by reputable financial institutions to Kimberly-Clark Corporation.
| Grading Company | Action | New Grade | Date |
|---|---|---|---|
| UBS | Maintain | Neutral | 2026-01-28 |
| UBS | Maintain | Neutral | 2026-01-14 |
| Citigroup | Maintain | Sell | 2026-01-14 |
| TD Cowen | Maintain | Hold | 2026-01-08 |
| Wells Fargo | Maintain | Equal Weight | 2026-01-05 |
| Citigroup | Maintain | Sell | 2025-12-17 |
| BNP Paribas Exane | Maintain | Neutral | 2025-12-01 |
| Argus Research | Upgrade | Buy | 2025-11-13 |
| Morgan Stanley | Maintain | Equal Weight | 2025-11-04 |
| Wells Fargo | Maintain | Equal Weight | 2025-11-04 |
Newell Brands Inc. Grades
Below are the most recent grades from established grading firms for Newell Brands Inc.
| Grading Company | Action | New Grade | Date |
|---|---|---|---|
| Morgan Stanley | Maintain | Equal Weight | 2026-02-10 |
| Citigroup | Maintain | Neutral | 2026-02-09 |
| Canaccord Genuity | Maintain | Buy | 2026-01-26 |
| UBS | Maintain | Neutral | 2026-01-14 |
| Citigroup | Maintain | Neutral | 2026-01-14 |
| Citigroup | Maintain | Neutral | 2025-12-17 |
| UBS | Maintain | Neutral | 2025-12-02 |
| JP Morgan | Maintain | Overweight | 2025-11-03 |
| RBC Capital | Maintain | Sector Perform | 2025-11-03 |
| Citigroup | Maintain | Neutral | 2025-11-03 |
Which company has the best grades?
Newell Brands generally receives more favorable grades, including Buy and Overweight ratings, compared to Kimberly-Clark’s Neutral and Sell-heavy mix. Investors might view Newell as having stronger institutional support, potentially influencing demand and valuation.
Risks specific to each company
The following categories identify critical pressure points and systemic threats facing Kimberly-Clark Corporation and Newell Brands Inc. in the 2026 market environment:
1. Market & Competition
Kimberly-Clark Corporation
- Established leader with strong brand portfolio in personal care and consumer tissue markets.
Newell Brands Inc.
- Diversified segments but struggles with profitability and brand cohesion amid fierce competition.
2. Capital Structure & Debt
Kimberly-Clark Corporation
- High debt-to-equity ratio (4.77) raises financial risk despite solid interest coverage (9.73).
Newell Brands Inc.
- Elevated debt-to-assets (51.7%) and very weak interest coverage (0.06) signal distress and refinancing risk.
3. Stock Volatility
Kimberly-Clark Corporation
- Low beta (0.28) indicates defensive, stable stock with limited price swings.
Newell Brands Inc.
- Higher beta (0.93) reflects greater volatility and sensitivity to market fluctuations.
4. Regulatory & Legal
Kimberly-Clark Corporation
- Operates globally in regulated personal care and hygiene sectors, facing evolving compliance costs.
Newell Brands Inc.
- Diverse product lines expose it to multiple regulatory regimes, increasing legal complexity and risk.
5. Supply Chain & Operations
Kimberly-Clark Corporation
- Robust supply chain supporting global consumer products, but vulnerable to raw material cost inflation.
Newell Brands Inc.
- Multiple segments and product categories complicate supply chain management, risking operational inefficiencies.
6. ESG & Climate Transition
Kimberly-Clark Corporation
- Increasing focus on sustainable packaging and reducing carbon footprint aligns with investor ESG expectations.
Newell Brands Inc.
- ESG initiatives less mature, potentially lagging peers amid rising investor scrutiny on climate risks.
7. Geopolitical Exposure
Kimberly-Clark Corporation
- Moderate exposure to international markets, with some risk from trade tensions and currency fluctuations.
Newell Brands Inc.
- Similar international footprint but higher sensitivity due to weaker financial resilience and operational complexity.
Which company shows a better risk-adjusted profile?
Kimberly-Clark’s strongest risk lies in its heavy leverage, which could pressure liquidity if market conditions worsen. Newell’s critical risk stems from poor financial health, marked by negative margins and distress-level bankruptcy scores. Overall, Kimberly-Clark’s robust profitability, stable stock, and safer Altman Z-score create a superior risk-adjusted profile. Newell’s weak interest coverage and Altman Z-score in the distress zone raise significant red flags. Recent financial data showing Kimberly-Clark’s solid ROIC (17.6%) versus Newell’s negative net margin confirms my concern about Newell’s operational and financial risks.
Final Verdict: Which stock to choose?
Kimberly-Clark’s superpower lies in its robust value creation and operational efficiency, delivering strong returns on invested capital well above its cost of capital. Its main point of vigilance is a stretched liquidity position, which could pressure short-term flexibility. It fits well within a portfolio targeting steady income and moderate growth.
Newell Brands’ strategic moat is its potential for asset optimization, reflected in a lower valuation multiple and a meaningful price-to-book discount. However, it carries elevated financial risk and persistent profitability challenges, making it a less stable option than Kimberly-Clark. It might appeal to investors favoring deep value or turnaround scenarios.
If you prioritize durable competitive advantages and reliable profitability, Kimberly-Clark outshines as the compelling choice due to its consistent value creation and financial strength. However, if you seek a contrarian, deeply discounted play with turnaround potential, Newell Brands offers superior upside but demands tolerance for risk and operational uncertainty.
Disclaimer: Investment carries a risk of loss of initial capital. The past performance is not a reliable indicator of future results. Be sure to understand risks before making an investment decision.
Go Further
I encourage you to read the complete analyses of Kimberly-Clark Corporation and Newell Brands Inc. to enhance your investment decisions: