Home > Comparison > Consumer Defensive > KMB vs ELF
The strategic rivalry between Kimberly-Clark Corporation and e.l.f. Beauty, Inc. shapes the competitive landscape of the Household & Personal Products industry. Kimberly-Clark operates as a capital-intensive consumer staples leader with a broad portfolio of essential hygiene products. In contrast, e.l.f. Beauty pursues a high-growth model focused on innovative cosmetics and direct-to-consumer sales. This analysis will assess which company’s strategy offers superior risk-adjusted returns for a diversified portfolio in 2026.
Table of contents
Companies Overview
Kimberly-Clark and e.l.f. Beauty stand as key players in the evolving Household & Personal Products market.
Kimberly-Clark Corporation: Legacy Consumer Care Leader
Kimberly-Clark dominates the personal care and consumer tissue market with trusted brands like Huggies and Kleenex. Its revenue streams flow from three segments: Personal Care, Consumer Tissue, and K-C Professional. In 2026, the company focuses on sustaining brand leadership and expanding professional product lines globally.
e.l.f. Beauty, Inc.: Innovative Cosmetics Challenger
e.l.f. Beauty targets the cosmetics and skincare sector with affordable, trendy products under e.l.f. Cosmetics and Well People brands. It drives growth through retail partnerships and direct-to-consumer e-commerce channels. The 2026 strategy concentrates on expanding international presence and enhancing digital sales platforms.
Strategic Collision: Similarities & Divergences
Both companies operate in consumer essentials but diverge sharply in focus—Kimberly-Clark emphasizes durable household staples, while e.l.f. pursues fast-moving beauty trends. Their primary battleground is brand loyalty within health and personal care categories. Kimberly-Clark offers stability with a low-beta profile; e.l.f. presents higher growth potential paired with greater volatility.
Income Statement Comparison
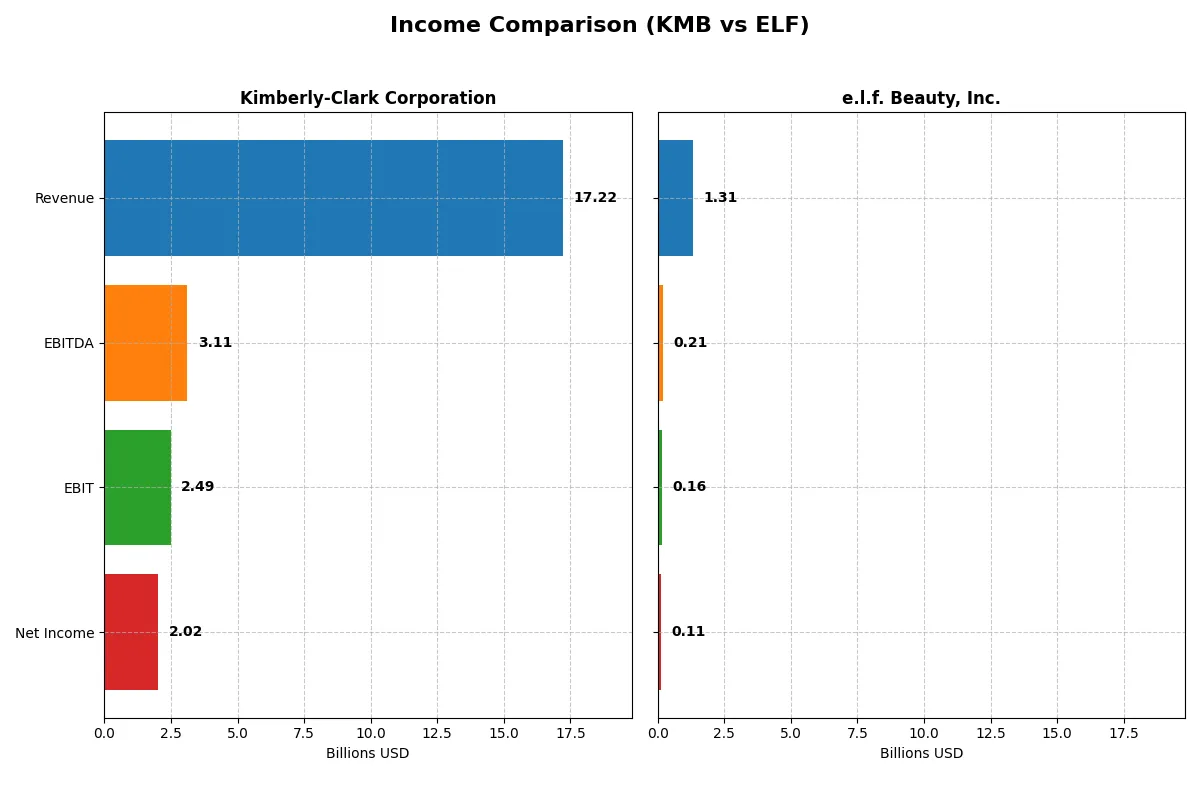
This data dissects the core profitability and scalability of both corporate engines to reveal who dominates the bottom line:
| Metric | Kimberly-Clark Corporation (KMB) | e.l.f. Beauty, Inc. (ELF) |
|---|---|---|
| Revenue | 17.2B | 1.31B |
| Cost of Revenue | 11.1B | 378M |
| Operating Expenses | 3.64B | 778M |
| Gross Profit | 6.13B | 936M |
| EBITDA | 3.11B | 206M |
| EBIT | 2.49B | 162M |
| Interest Expense | 256M | 17.2M |
| Net Income | 2.02B | 112M |
| EPS | 6.08 | 1.99 |
| Fiscal Year | 2025 | 2025 |
Income Statement Analysis: The Bottom-Line Duel
This income statement comparison reveals the operational efficiency and growth momentum driving each company’s profitability engine.
Kimberly-Clark Corporation Analysis
Kimberly-Clark’s revenue declined 14% to $17.2B in 2025, reflecting a contraction phase. Despite this, net income remained robust at $2.0B with a solid 11.7% net margin. The gross margin held steady near 35.6%, but a 22% EBIT drop signals margin pressure. The 2025 results show efficiency challenges amid top-line weakness.
e.l.f. Beauty, Inc. Analysis
e.l.f. Beauty’s revenue surged 28% to $1.3B in 2025, highlighting strong growth momentum. Net income hit $112M, supported by a favorable 71.2% gross margin, though net margin at 8.5% lags behind Kimberly-Clark. EBIT grew 6%, but net margin contracted, indicating rising costs. The company demonstrates rapid expansion with margin volatility.
Growth Momentum vs. Margin Stability
Kimberly-Clark offers margin stability with solid profitability despite recent revenue declines. e.l.f. Beauty impresses with rapid revenue and net income growth but faces margin compression risks. For investors, Kimberly-Clark’s profile suits those valuing steady profits, while e.l.f. appeals to growth-focused investors tolerating margin swings.
Financial Ratios Comparison
These vital ratios act as a diagnostic tool to expose the underlying fiscal health, valuation premiums, and capital efficiency of the companies compared below:
| Ratios | Kimberly-Clark Corporation (KMB) | e.l.f. Beauty, Inc. (ELF) |
|---|---|---|
| ROE | 3.03% (2024) | 14.73% (2025) |
| ROIC | 25.33% (2024) | 11.21% (2025) |
| P/E | 17.35 (2024) | 31.49 (2025) |
| P/B | 52.57 (2024) | 4.64 (2025) |
| Current Ratio | 0.80 (2024) | 3.05 (2025) |
| Quick Ratio | 0.54 (2024) | 2.00 (2025) |
| D/E (Debt-to-Equity) | 9.42 (2024) | 0.41 (2025) |
| Debt-to-Assets | 48% (2024) | 25% (2025) |
| Interest Coverage | 11.89 (2024) | 9.20 (2025) |
| Asset Turnover | 1.21 (2024) | 1.05 (2025) |
| Fixed Asset Turnover | 2.67 (2024) | 45.63 (2025) |
| Payout Ratio | 64.0% (2024) | 0% (2025) |
| Dividend Yield | 3.69% (2024) | 0% (2025) |
| Fiscal Year | 2024 | 2025 |
Efficiency & Valuation Duel: The Vital Signs
Ratios act as a company’s DNA, revealing hidden risks and operational excellence critical for informed investment decisions.
Kimberly-Clark Corporation
Kimberly-Clark shows a favorable net margin of 11.74%, but its ROE and ROIC stand at zero, signaling weak profitability efficiency. Its P/E ratio at 16.63 is neutral, indicating fair valuation. With a 4.94% dividend yield, Kimberly-Clark rewards shareholders through steady income rather than aggressive growth or buybacks.
e.l.f. Beauty, Inc.
e.l.f. Beauty posts an 8.53% net margin and a 14.73% ROE, reflecting moderate profitability. However, its P/E at 31.49 is stretched, suggesting premium valuation. The company lacks dividends, reinvesting in growth and maintaining strong asset turnover ratios. Its quick ratio of 2.0 supports operational liquidity despite a high current ratio flagged as unfavorable.
Premium Valuation vs. Income Stability
Kimberly-Clark offers income-focused returns with a balanced valuation but lacks profitability efficiency. e.l.f. Beauty commands a premium price for growth prospects but shows mixed profitability and liquidity signals. Investors prioritizing income may prefer Kimberly-Clark; growth seekers might lean toward e.l.f. Beauty’s expansion profile.
Which one offers the Superior Shareholder Reward?
Kimberly-Clark (KMB) offers a 4.9% dividend yield with a high payout ratio near 82%, supported by strong free cash flow coverage above 1.6x. Its steady dividend and moderate buybacks provide reliable income. In contrast, e.l.f. Beauty (ELF) pays no dividend but aggressively reinvests in growth, with a robust free cash flow margin and minimal debt. ELF’s buybacks are negligible, focusing on scaling operations. Historically, I’ve seen mature consumer staples like KMB deliver consistent shareholder returns through dividends plus steady buybacks. ELF’s growth model offers upside but with elevated valuation multiples and no income. For 2026, I favor KMB’s sustainable yield and balanced capital allocation for superior total return.
Comparative Score Analysis: The Strategic Profile
The radar chart reveals the fundamental DNA and trade-offs of Kimberly-Clark Corporation and e.l.f. Beauty, highlighting their core financial strengths and vulnerabilities:
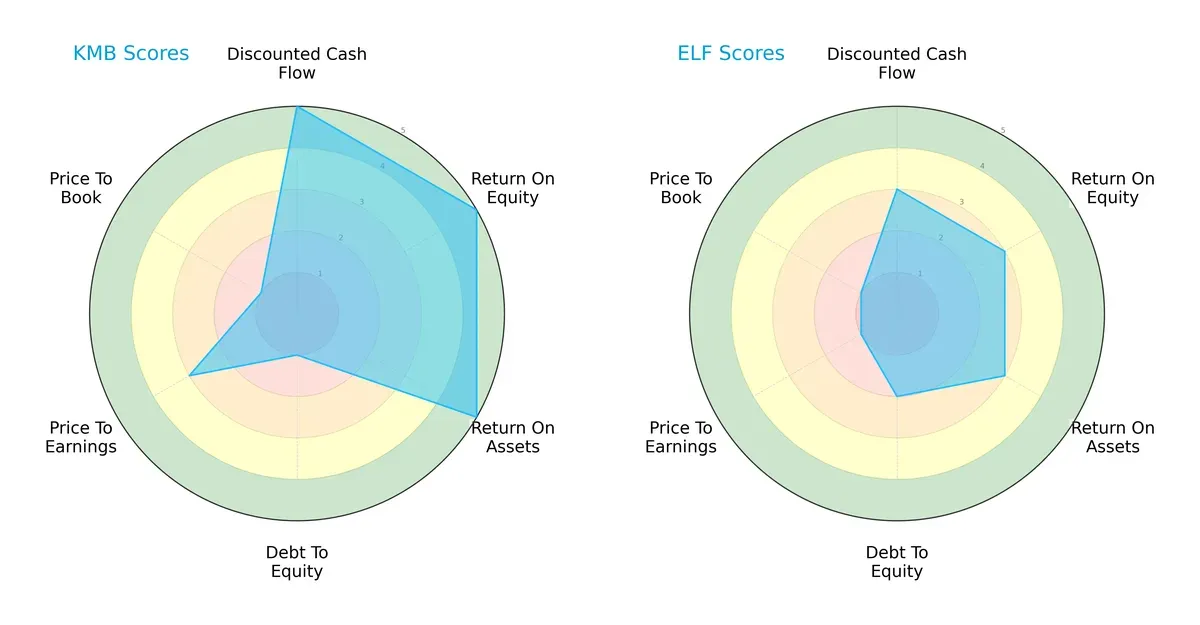
Kimberly-Clark dominates in return on equity (5 vs. 3) and assets (5 vs. 3), showing superior profitability and asset utilization. However, its debt-to-equity score (1) flags high leverage risk, unlike e.l.f.’s moderate score (2). e.l.f. lags in valuation metrics and cash flow but maintains a less risky balance sheet. Kimberly-Clark’s profile is more imbalanced but powered by operational efficiency; e.l.f. offers a steadier, albeit weaker, financial footing.
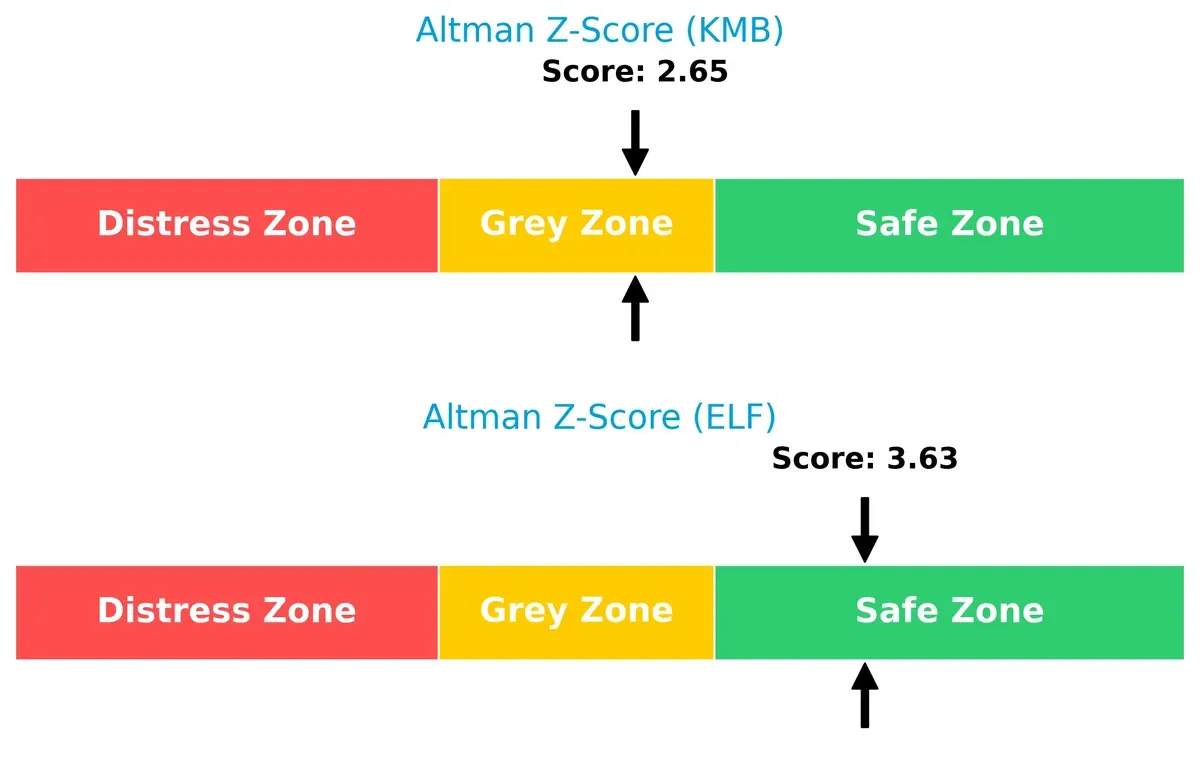
Bankruptcy Risk: Solvency Showdown
Kimberly-Clark’s Altman Z-Score sits in the grey zone (2.65), signaling moderate bankruptcy risk. e.l.f. scores safely above 3.6, suggesting stronger resilience and lower financial distress risk in this cycle:
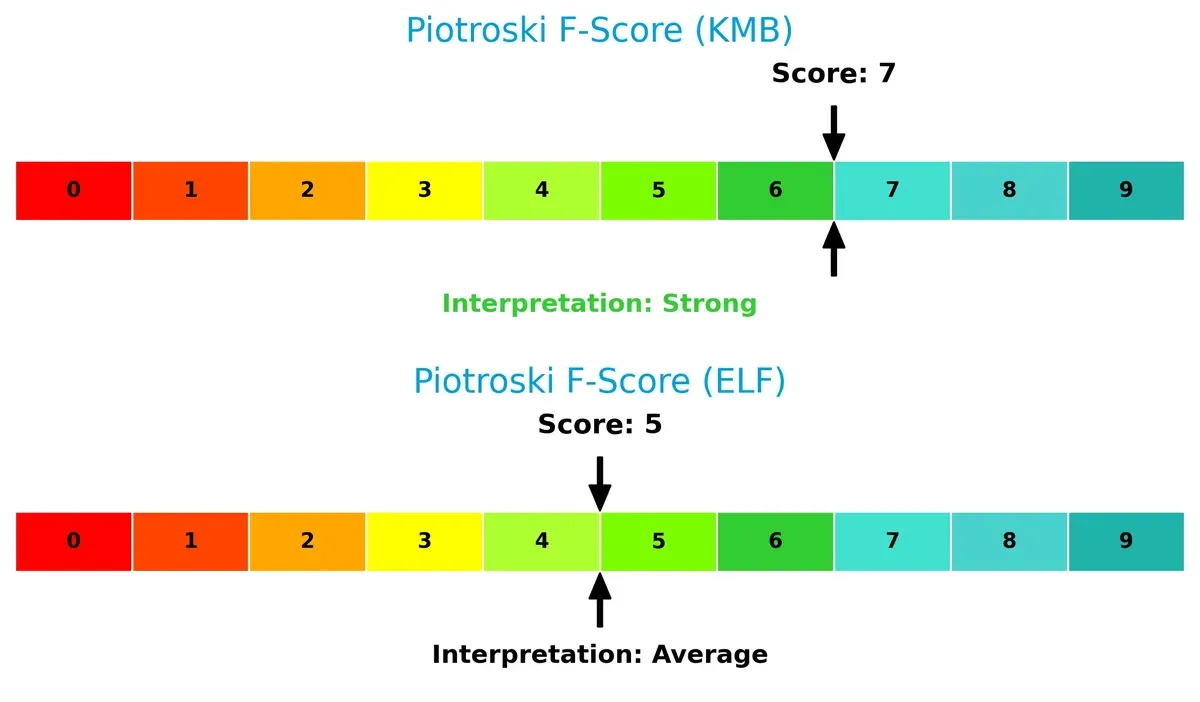
Financial Health: Quality of Operations
Kimberly-Clark’s Piotroski F-Score of 7 indicates strong financial health, while e.l.f.’s 5 suggests average operational quality. Kimberly-Clark shows fewer red flags and better internal metrics overall:
How are the two companies positioned?
This section dissects the operational DNA of KMB and ELF by comparing their revenue distribution and internal dynamics. The goal is to confront their economic moats to reveal which model offers the most resilient competitive advantage today.
Revenue Segmentation: The Strategic Mix
This visual comparison dissects how Kimberly-Clark Corporation and e.l.f. Beauty, Inc. diversify their income streams and highlights their primary sector bets:
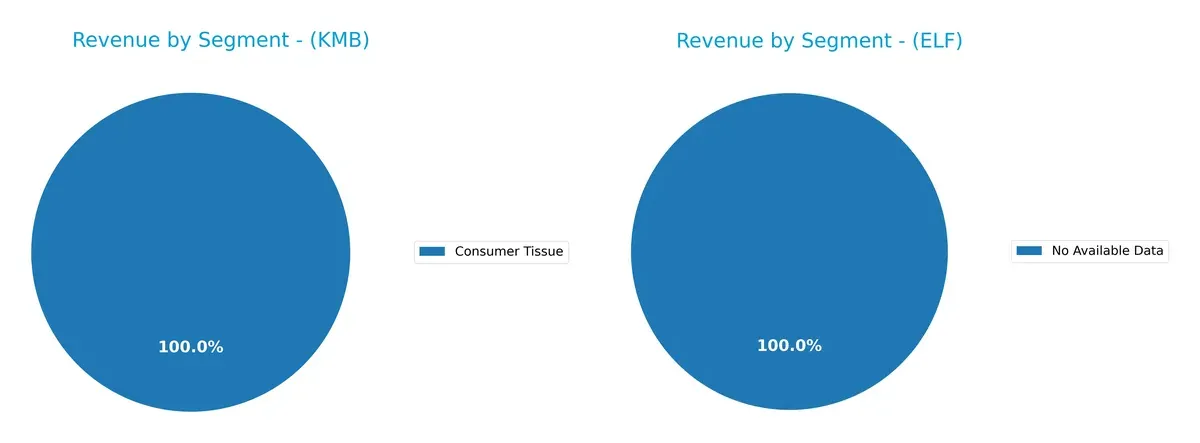
Kimberly-Clark displays a well-diversified mix across Personal Care ($10.7B), Consumer Tissue ($6.3B), and K-C Professional ($3.4B) segments in 2023. This multi-pronged approach anchors its resilience and ecosystem lock-in. In contrast, e.l.f. Beauty lacks available segment data, preventing segmentation insights. Kimberly-Clark’s broad exposure reduces concentration risk and signals robust capital allocation across stable consumer staples.
Strengths and Weaknesses Comparison
This table compares the strengths and weaknesses of Kimberly-Clark Corporation (KMB) and e.l.f. Beauty, Inc. (ELF):
KMB Strengths
- Diverse product segments including Consumer Tissue, K-C Professional, and Personal Care
- Strong net margin at 11.74%
- Favorable debt to equity and debt to assets ratios
- High interest coverage ratio of 9.73
- Consistent dividend yield of 4.94%
- Significant global presence with substantial revenue from the US, Europe, and Asia
ELF Strengths
- Favorable quick ratio indicating good short-term liquidity
- Low debt to equity and debt to assets ratios
- Strong interest coverage ratio of 9.44
- Efficient asset turnover ratios, including fixed asset turnover of 45.63
- Positive return on equity at 14.73%
- Growing US and international revenue streams
KMB Weaknesses
- Unfavorable return on equity and return on invested capital at 0%
- Unavailable weighted average cost of capital
- Poor liquidity ratios with current and quick ratios at 0
- Low asset and fixed asset turnover ratios
- Neutral price-to-earnings ratio at 16.63
- Limited recent revenue growth in some segments
ELF Weaknesses
- Unfavorable price-to-earnings ratio at 31.49
- Unfavorable price-to-book ratio at 4.64
- Current ratio higher but still unfavorable at 3.05
- Negative dividend yield at 0%
- Return on invested capital below weighted average cost of capital
- Moderate net margin at 8.53%
Both companies exhibit balanced profiles with roughly equal shares of favorable and unfavorable financial metrics. KMB benefits from product diversification and dividend yield, but struggles with liquidity and returns. ELF shows operational efficiency and reasonable leverage but faces valuation and profitability challenges. These contrasts highlight different strategic priorities and market positions.
The Moat Duel: Analyzing Competitive Defensibility
A structural moat is the only thing protecting long-term profits from the erosion of competition. Let’s dissect the competitive moats of these two companies:
Kimberly-Clark Corporation: Intangible Assets & Brand Legacy
Kimberly-Clark’s moat stems from its iconic brands and deep consumer trust. This manifests in stable margins (EBIT margin 14.5%) despite recent revenue declines. However, its shrinking ROIC trend signals rising pressure on capital efficiency in 2026.
e.l.f. Beauty, Inc.: Rapid Growth & Innovation Edge
e.l.f. Beauty leverages product innovation and direct-to-consumer channels as its moat, contrasting Kimberly-Clark’s legacy focus. It achieves explosive revenue growth (28% last year) and expanding ROIC, though net margin volatility warns of margin sustainability challenges ahead.
Legacy Brands vs. Agile Innovation: Who Defends Better?
Kimberly-Clark holds a deeper moat through entrenched brand equity and margin stability. e.l.f. Beauty boasts a wider moat in growth and innovation but sheds value currently. Kimberly-Clark remains better positioned to defend market share long term.
Which stock offers better returns?
Over the past 12 months, both Kimberly-Clark Corporation and e.l.f. Beauty, Inc. showed pronounced price movements. Kimberly-Clark’s decline slowed recently, while e.l.f. Beauty reversed a steep fall with a strong rebound.
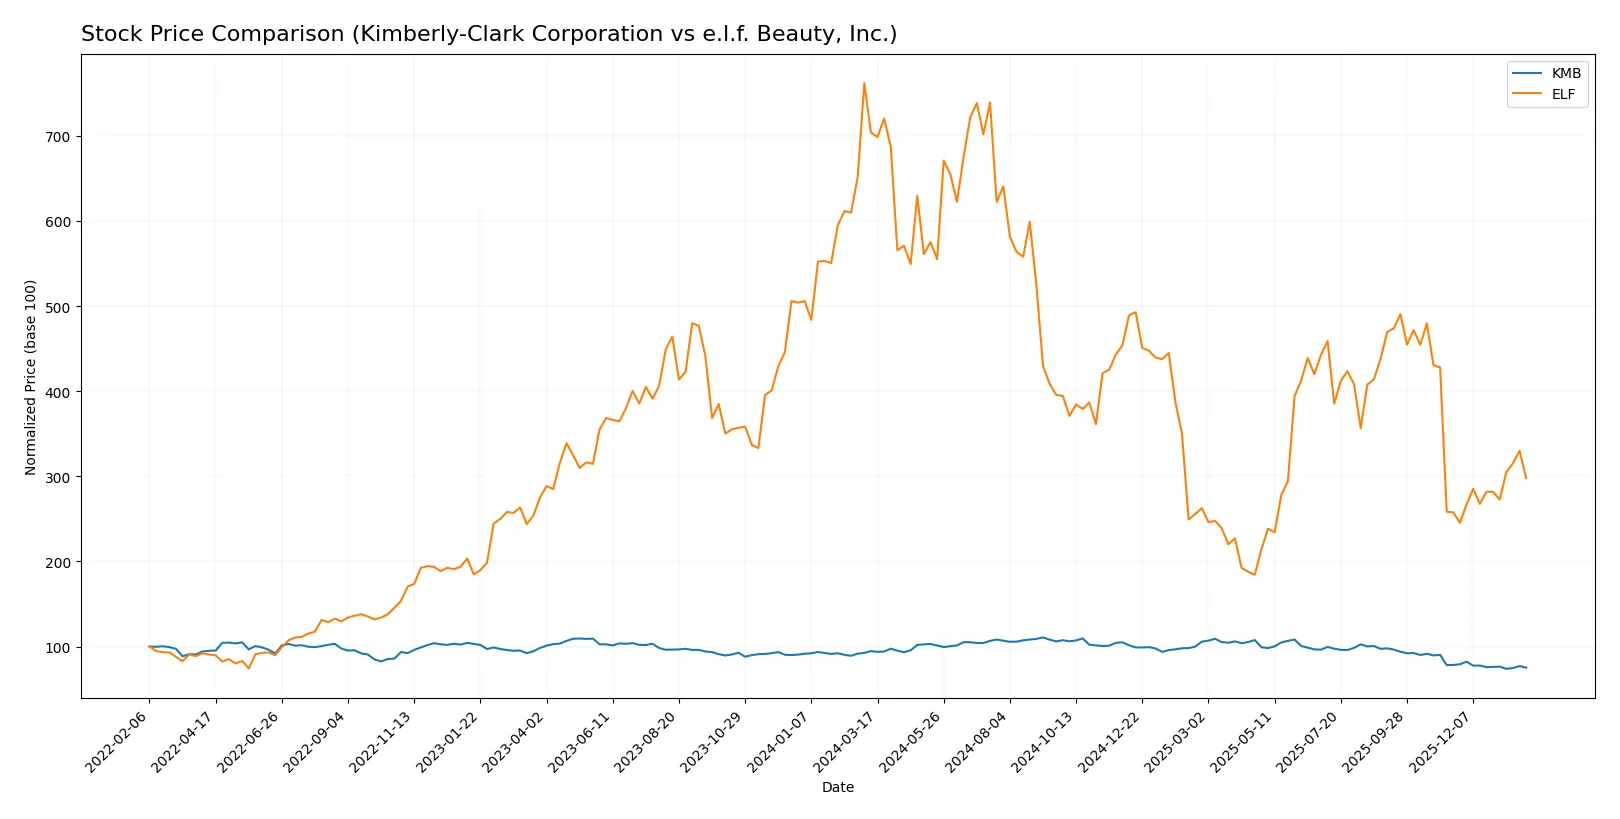
Trend Comparison
Kimberly-Clark’s stock fell 20.42% over the past year, marking a bearish trend with deceleration. Prices ranged from 146.91 to 97.92, and recent decline softened to -3.87%.
e.l.f. Beauty’s stock dropped sharply by 57.7%, indicating a bearish trend with acceleration. Volatility was high, with prices between 210.9 and 52.65. Recent months showed a 15.62% gain, signaling a rebound.
Comparing trends, Kimberly-Clark delivered a smaller loss and more stable decline. e.l.f. Beauty’s greater volatility and recent rally reflect higher risk and reward potential.
Target Prices
Analysts present a cautiously optimistic consensus for both Kimberly-Clark Corporation and e.l.f. Beauty, Inc.
| Company | Target Low | Target High | Consensus |
|---|---|---|---|
| Kimberly-Clark Corporation | 102 | 162 | 122.38 |
| e.l.f. Beauty, Inc. | 85 | 165 | 111.83 |
The consensus target for Kimberly-Clark stands about 22% above its current 99.99 price, indicating moderate upside. e.l.f. Beauty’s target consensus is roughly 32% higher than its 84.99 price, reflecting stronger growth expectations.

Don’t Let Luck Decide Your Entry Point
Optimize your entry points with our advanced ProRealTime indicators. You’ll get efficient buy signals with precise price targets for maximum performance. Start outperforming now!
How do institutions grade them?
Institutional grades for Kimberly-Clark Corporation and e.l.f. Beauty, Inc. show contrasting analyst perspectives:
Kimberly-Clark Corporation Grades
Below is a summary of recent institutional grades for Kimberly-Clark Corporation.
| Grading Company | Action | New Grade | Date |
|---|---|---|---|
| UBS | maintain | Neutral | 2026-01-28 |
| Citigroup | maintain | Sell | 2026-01-14 |
| UBS | maintain | Neutral | 2026-01-14 |
| TD Cowen | maintain | Hold | 2026-01-08 |
| Wells Fargo | maintain | Equal Weight | 2026-01-05 |
| Citigroup | maintain | Sell | 2025-12-17 |
| BNP Paribas Exane | maintain | Neutral | 2025-12-01 |
| Argus Research | upgrade | Buy | 2025-11-13 |
| Wells Fargo | maintain | Equal Weight | 2025-11-04 |
| Evercore ISI Group | downgrade | In Line | 2025-11-04 |
e.l.f. Beauty, Inc. Grades
Below is a summary of recent institutional grades for e.l.f. Beauty, Inc.
| Grading Company | Action | New Grade | Date |
|---|---|---|---|
| TD Cowen | maintain | Buy | 2026-01-21 |
| UBS | maintain | Neutral | 2026-01-14 |
| Piper Sandler | maintain | Neutral | 2025-12-22 |
| JP Morgan | maintain | Overweight | 2025-12-18 |
| Goldman Sachs | maintain | Buy | 2025-11-07 |
| Piper Sandler | downgrade | Neutral | 2025-11-06 |
| UBS | maintain | Neutral | 2025-11-06 |
| Canaccord Genuity | maintain | Buy | 2025-11-06 |
| JP Morgan | maintain | Overweight | 2025-11-06 |
| Baird | maintain | Outperform | 2025-11-06 |
Which company has the best grades?
e.l.f. Beauty, Inc. consistently receives Buy and Outperform ratings from multiple firms. Kimberly-Clark shows more Neutral and Sell grades with few upgrades. Investors may perceive e.l.f. Beauty’s stronger grades as a sign of greater growth confidence.
Risks specific to each company
The following risk categories identify the critical pressure points and systemic threats facing both Kimberly-Clark Corporation and e.l.f. Beauty, Inc. in the 2026 market environment:
1. Market & Competition
Kimberly-Clark Corporation
- Established leader in personal care with diversified brands; faces intense competition in mature markets.
e.l.f. Beauty, Inc.
- Fast-growing in cosmetics with higher beta; faces fierce competition and rapidly changing consumer trends.
2. Capital Structure & Debt
Kimberly-Clark Corporation
- Strong interest coverage (9.73) and favorable debt ratios; however, debt-to-equity score is very unfavorable, signaling leverage concerns.
e.l.f. Beauty, Inc.
- Moderate debt levels with interest coverage at 9.44; debt-to-equity ratio moderate and manageable.
3. Stock Volatility
Kimberly-Clark Corporation
- Low beta at 0.276 shows defensive, stable stock with limited price swings.
e.l.f. Beauty, Inc.
- High beta at 1.722 indicates significant price volatility and higher market sensitivity.
4. Regulatory & Legal
Kimberly-Clark Corporation
- Operates globally with exposure to evolving personal care regulations; historically manages compliance well.
e.l.f. Beauty, Inc.
- Faces cosmetic industry regulations and international compliance risks; less diversified which may increase legal impact.
5. Supply Chain & Operations
Kimberly-Clark Corporation
- Large scale and established supply chains; potential risks from raw material cost inflation.
e.l.f. Beauty, Inc.
- Smaller scale supply chain with higher operational risk and dependency on third-party distributors.
6. ESG & Climate Transition
Kimberly-Clark Corporation
- Increasing ESG initiatives amid consumer pressure; legacy issues may slow full transition.
e.l.f. Beauty, Inc.
- Emerging ESG policies but less historical data; opportunities exist but risks remain from evolving standards.
7. Geopolitical Exposure
Kimberly-Clark Corporation
- Global footprint exposes it to currency and trade risks, though diversified markets mitigate impact.
e.l.f. Beauty, Inc.
- More concentrated markets with potentially higher exposure to regional geopolitical tensions.
Which company shows a better risk-adjusted profile?
Kimberly-Clark’s main risk lies in its capital structure, notably high leverage despite stable cash flow and low volatility. e.l.f. faces pronounced market volatility and valuation risks, amplified by a higher beta and weak price multiples. Despite leverage concerns, Kimberly-Clark’s diversified operations and consistent dividend yield offer a more balanced risk-adjusted profile. e.l.f.’s strong Altman Z-score suggests low bankruptcy risk, but its valuation and volatility elevate overall investment risk. Recent data highlight Kimberly-Clark’s defensive positioning, while e.l.f.’s valuation metrics signal caution in a volatile sector.
Final Verdict: Which stock to choose?
Kimberly-Clark Corporation’s superpower lies in its resilient cash generation and disciplined capital allocation. It offers a steady dividend yield that appeals to income-focused investors. However, its declining revenue and tight liquidity ratios are points of vigilance. This stock fits well within a conservative, income-oriented portfolio.
e.l.f. Beauty, Inc. boasts a strategic moat rooted in its strong brand presence and rapid revenue growth. Its higher current ratio and manageable debt profile provide a safer balance sheet relative to Kimberly-Clark. e.l.f. suits investors seeking growth at a reasonable price, willing to tolerate valuation premiums for expanding market share.
If you prioritize dependable income and capital preservation, Kimberly-Clark commands attention due to its robust cash flows and dividend yield. However, if you seek aggressive growth with improving profitability and brand momentum, e.l.f. offers better upside potential despite higher volatility. Each presents a distinct risk-reward profile aligned with different investor strategies.
Disclaimer: Investment carries a risk of loss of initial capital. The past performance is not a reliable indicator of future results. Be sure to understand risks before making an investment decision.
Go Further
I encourage you to read the complete analyses of Kimberly-Clark Corporation and e.l.f. Beauty, Inc. to enhance your investment decisions: