Home > Comparison > Technology > KEYS vs TDY
The strategic rivalry between Keysight Technologies, Inc. and Teledyne Technologies Incorporated shapes the trajectory of the technology hardware sector. Keysight operates as a market-leading provider of electronic design and test solutions, emphasizing communications and semiconductor industries. In contrast, Teledyne focuses on diversified instrumentation and aerospace electronics, blending industrial and defense applications. This analysis examines their distinct operational models to identify which offers superior risk-adjusted returns for a diversified portfolio.
Table of contents
Companies Overview
Keysight Technologies and Teledyne Technologies play pivotal roles in the advanced hardware and equipment sector. Both firms serve diverse industrial and defense markets with specialized technology solutions, vying for leadership in cutting-edge instrumentation.
Keysight Technologies, Inc.: Leader in Electronic Test Solutions
Keysight Technologies dominates with electronic design and test solutions spanning communications, aerospace, and semiconductor industries. Its revenue hinges on sophisticated hardware and software tools like oscilloscopes and network test platforms. In 2026, Keysight focuses on expanding virtual network testing and enhancing design automation software, cementing its edge in precision measurement technologies.
Teledyne Technologies Incorporated: Industrial and Defense Innovator
Teledyne Technologies excels in instrumentation and aerospace electronics, offering sensors, digital imaging, and defense subsystems. Its core income stems from monitoring instruments, imaging systems, and integrated aerospace components. The company’s 2026 strategy centers on broadening systems engineering services and advancing electrochemical energy solutions for military applications.
Strategic Collision: Similarities & Divergences
Both firms emphasize advanced hardware but diverge philosophically: Keysight leans on precision test instruments, while Teledyne pursues integrated systems and imaging solutions. Their primary battleground is aerospace and defense electronics, where measurement meets system integration. Investors encounter distinct profiles—Keysight as a specialist in test innovation, Teledyne as a diversified industrial tech powerhouse.
Income Statement Comparison
This detailed data dissects the core profitability and scalability of both corporate engines to reveal who dominates the bottom line:
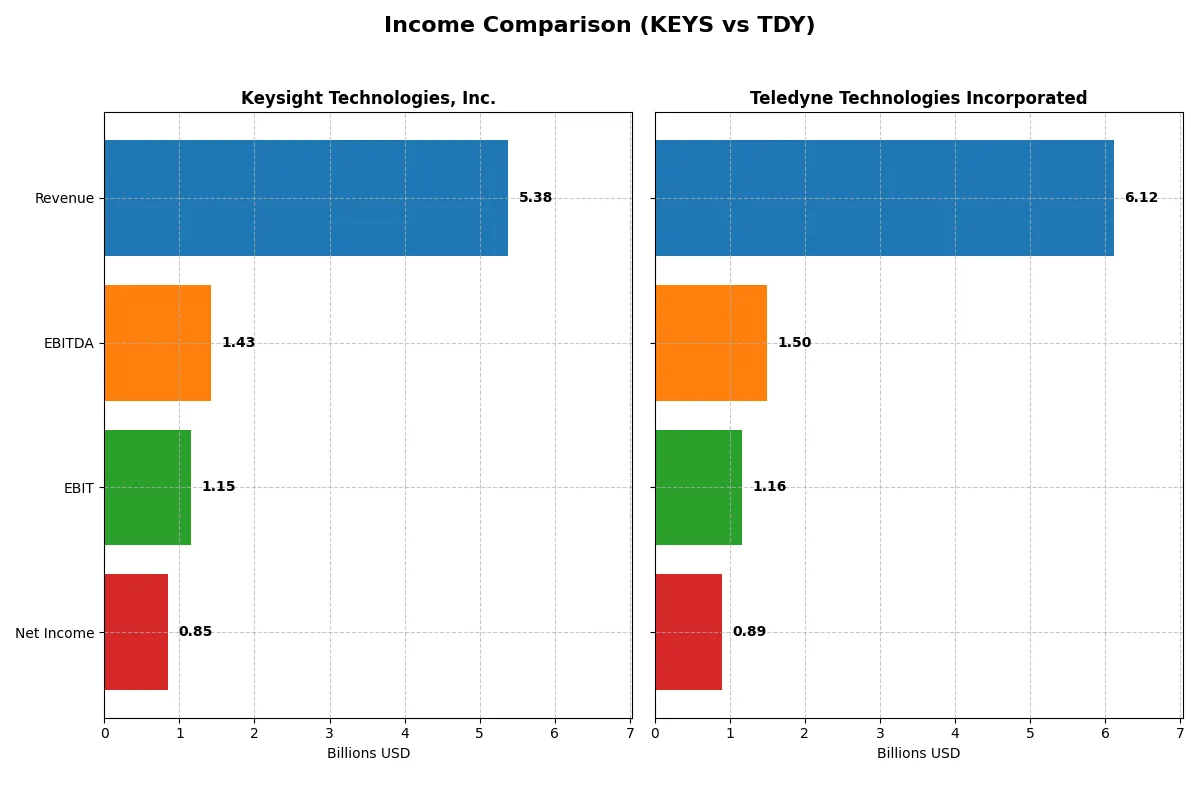
| Metric | Keysight Technologies, Inc. (KEYS) | Teledyne Technologies Incorporated (TDY) |
|---|---|---|
| Revenue | 5.38B | 6.12B |
| Cost of Revenue | 2.04B | 3.72B |
| Operating Expenses | 2.39B | 1.25B |
| Gross Profit | 3.34B | 2.40B |
| EBITDA | 1.43B | 1.50B |
| EBIT | 1.15B | 1.16B |
| Interest Expense | 96M | 60M |
| Net Income | 846M | 895M |
| EPS | 4.90 | 18.88 |
| Fiscal Year | 2025 | 2025 |
Income Statement Analysis: The Bottom-Line Duel
This income statement comparison reveals which company converts sales into profit most effectively, exposing the true efficiency of each corporate engine.
Keysight Technologies, Inc. Analysis
Keysight’s revenue grew steadily to $5.38B in 2025, with net income at $846M. Gross margin remains strong at 62%, signaling excellent cost control. The net margin of 15.7% improved sharply last year, driven by a 21% EBIT growth, reflecting solid operational momentum and efficient capital allocation.
Teledyne Technologies Incorporated Analysis
Teledyne’s revenue reached $6.12B in 2025, showing solid growth but with a lower gross margin of 39.2%. Net income hit $895M, with net margin at 14.6%. Despite a slight dip in gross profit last year, EBIT and EPS growth indicate improving operational leverage and disciplined expense management.
Margin Strength vs. Scale Growth
Keysight leads in margin power with a superior 62% gross margin and stronger net margin expansion. Teledyne boasts larger revenue and more robust net income growth over five years. Keysight’s profile suits investors favoring margin efficiency and profit quality. Teledyne appeals to those prioritizing scale and sustained earnings acceleration.
Financial Ratios Comparison
These vital ratios act as a diagnostic tool to expose the underlying fiscal health, valuation premiums, and capital efficiency of each company:
| Ratios | Keysight Technologies, Inc. (KEYS) | Teledyne Technologies Incorporated (TDY) |
|---|---|---|
| ROE | 14.40% | 8.51% |
| ROIC | 8.02% | 6.78% |
| P/E | 37.41 | 27.35 |
| P/B | 5.39 | 2.33 |
| Current Ratio | 2.35 | 1.64 |
| Quick Ratio | 1.78 | 1.08 |
| D/E (Debt to Equity) | 0.51 | 0.24 |
| Debt-to-Assets | 26.31% | 16.19% |
| Interest Coverage | 9.88 | 19.29 |
| Asset Turnover | 0.48 | 0.40 |
| Fixed Asset Turnover | 5.21 | 7.29 |
| Payout ratio | 0% | 0% |
| Dividend yield | 0% | 0% |
| Fiscal Year | 2025 | 2025 |
Efficiency & Valuation Duel: The Vital Signs
Financial ratios serve as a company’s DNA, exposing hidden risks and operational efficiency through key profitability and valuation metrics.
Keysight Technologies, Inc.
Keysight shows solid profitability with a 14.4% ROE and a favorable 15.74% net margin, indicating efficient core operations. However, its P/E ratio of 37.41 suggests the stock trades at a stretched valuation. Keysight reinvests heavily in R&D, dedicating 18.7% of revenue, reflecting a growth-focused strategy without dividend payouts.
Teledyne Technologies Incorporated
Teledyne posts a lower 8.5% ROE and a 14.63% net margin, signaling moderate profitability. Its P/E of 27.35 indicates a more reasonable valuation relative to Keysight. Despite no dividends, Teledyne maintains a strong interest coverage of 19.47 and invests modestly in R&D at 5.2% of revenue, balancing growth with financial stability.
Premium Valuation vs. Operational Balance
Keysight demands a premium price for higher profitability and aggressive R&D investment, while Teledyne offers a more balanced valuation with solid financial health. Investors seeking growth via innovation may prefer Keysight; those valuing steadier risk-reward may lean toward Teledyne.
Which one offers the Superior Shareholder Reward?
I see both Keysight Technologies (KEYS) and Teledyne Technologies (TDY) pay no dividends, focusing on reinvestment and buybacks. KEYS shows zero payout ratio and yield but maintains strong free cash flow (7.4/share in 2025) supporting aggressive buybacks. TDY’s free cash flow is much higher (22.7/share in 2025), fueling even more intense buyback activity. KEYS trades at a higher P/E (~37x) and price-to-FCF (~25x) than TDY (~27x and ~23x respectively), indicating premium valuation. TDY’s lower leverage and stronger operating cash flow coverage suggest a more sustainable buyback model. For 2026, I favor TDY’s shareholder reward profile due to its better cash flow scale and prudent capital allocation, offering a more durable total return potential.
Comparative Score Analysis: The Strategic Profile
The radar chart reveals the fundamental DNA and trade-offs of both firms, highlighting their financial strengths and valuation nuances:
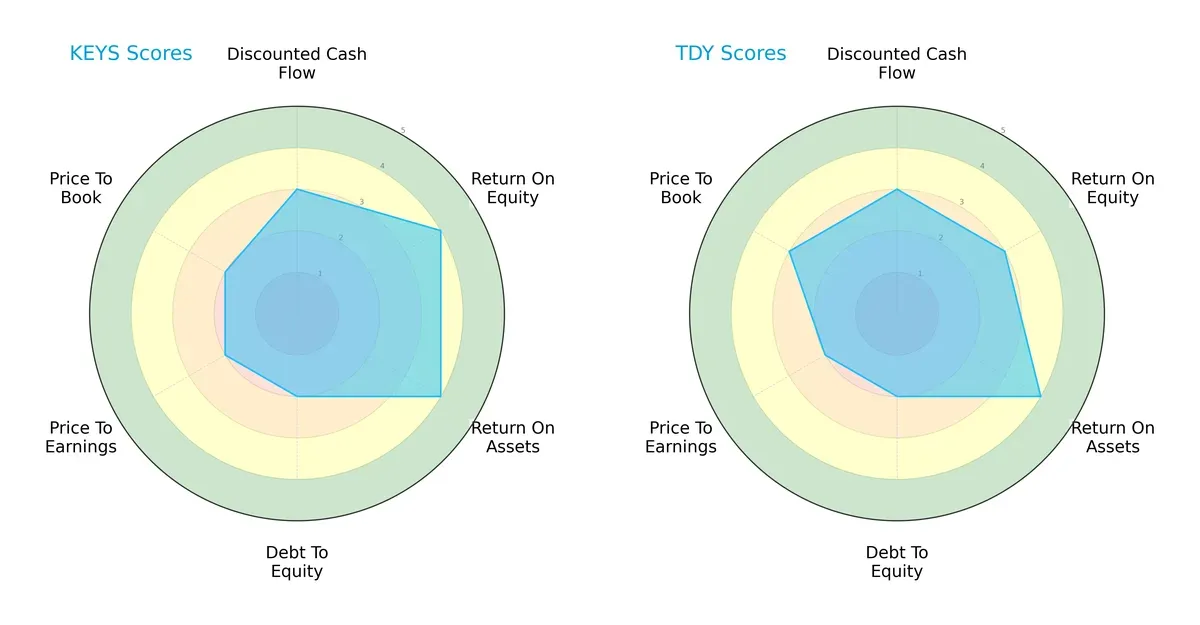
Keysight Technologies excels in return on equity (4 vs. 3) and maintains a balanced asset efficiency (ROA 4 vs. 4). Teledyne offers a slightly better price-to-book ratio (3 vs. 2), indicating marginally more attractive valuation metrics. Both show moderate debt-to-equity risk (2 each) and identical discounted cash flow scores (3). Keysight presents a more balanced profitability profile, while Teledyne leans on valuation appeal.
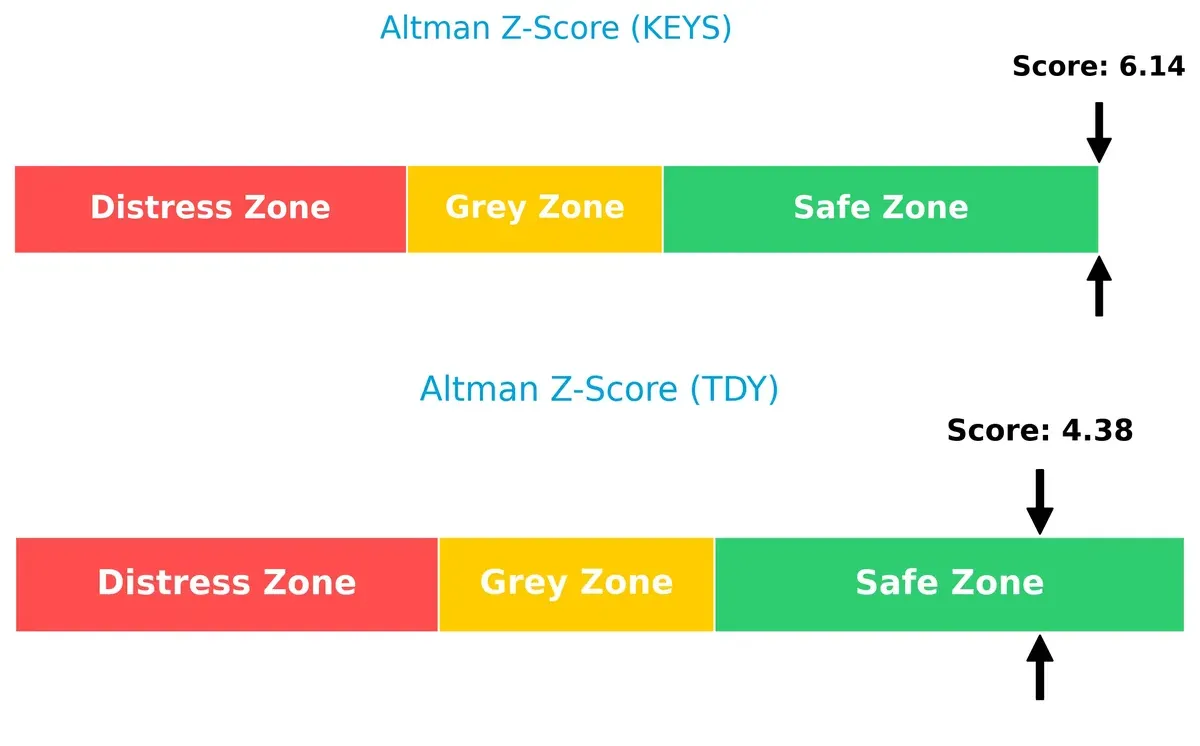
Bankruptcy Risk: Solvency Showdown
The Altman Z-Score gap favors Keysight (6.14 vs. 4.38), signaling stronger long-term solvency and lower bankruptcy risk in this cycle:
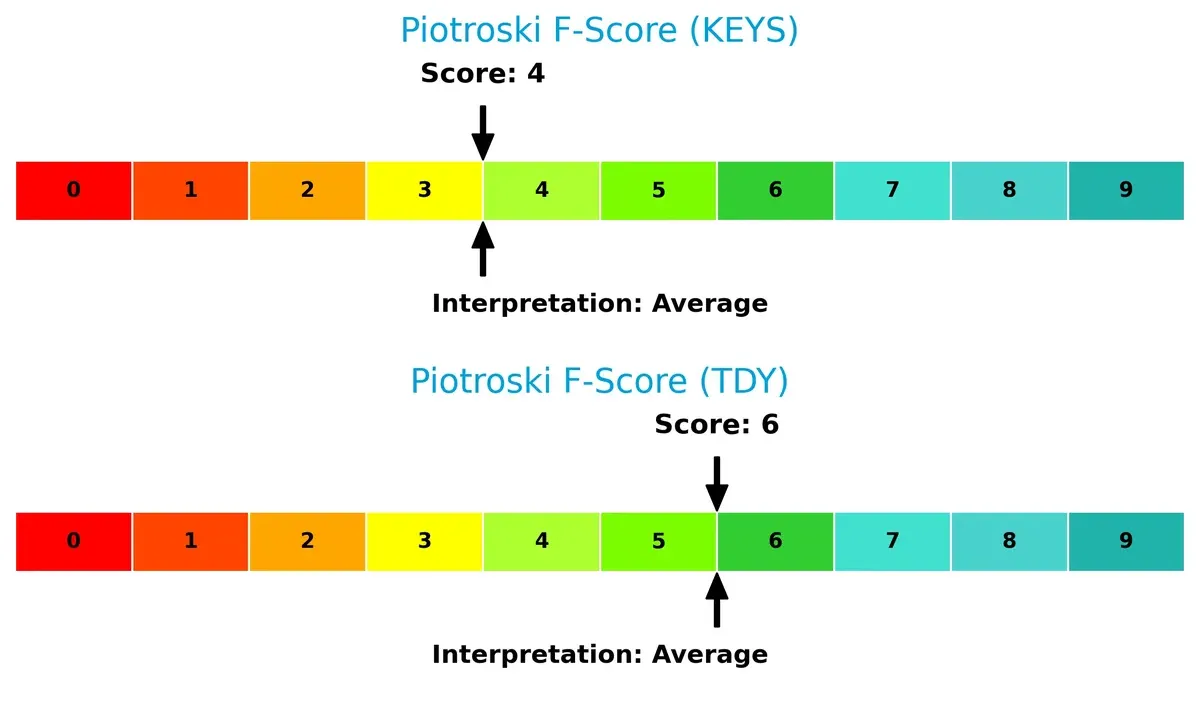
Financial Health: Quality of Operations
Teledyne’s Piotroski F-Score (6) outpaces Keysight’s (4), suggesting better internal financial health and fewer red flags in operational metrics:
How are the two companies positioned?
This section dissects the operational DNA of KEYS and TDY by comparing their revenue distribution and internal strengths and weaknesses. The goal is to confront their economic moats to identify which model offers the most resilient, sustainable competitive advantage today.
Revenue Segmentation: The Strategic Mix
This comparison dissects how Keysight Technologies and Teledyne Technologies diversify income streams and reveal their primary sector bets:
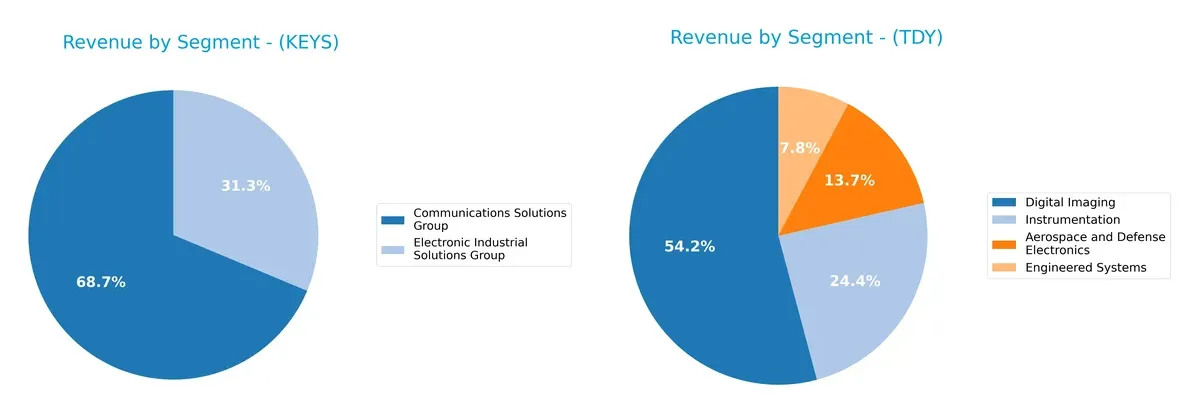
Keysight leans heavily on its Communications Solutions Group, with $3.42B in 2024, dwarfing its $1.56B Electronic Industrial Solutions. This signals a concentrated bet on communications infrastructure. Conversely, Teledyne spreads revenue across Digital Imaging ($3.07B), Instrumentation ($1.38B), Aerospace and Defense Electronics ($777M), and Engineered Systems ($440M), showing a broader diversification. Keysight’s concentration risks contrast with Teledyne’s ecosystem lock-in across defense, imaging, and instrumentation markets.
Strengths and Weaknesses Comparison
This table compares the Strengths and Weaknesses of Keysight Technologies, Inc. and Teledyne Technologies Incorporated:
KEYS Strengths
- Strong profitability with 15.74% net margin
- Favorable liquidity ratios (current 2.35, quick 1.78)
- Low debt-to-assets at 26.31%
- Robust fixed asset turnover at 5.21
- Balanced revenue from Communications and Industrial segments
- Diversified global presence in Americas, Asia Pacific, and Europe
TDY Strengths
- Favorable net margin at 14.63%
- Very strong interest coverage at 19.47
- Lower debt-to-assets at 16.19%
- High fixed asset turnover at 7.29
- Diversified revenue streams including Aerospace, Imaging, and Instrumentation
- Strong US revenue base with significant European presence
KEYS Weaknesses
- High valuation multiples (PE 37.41, PB 5.39)
- ROE and ROIC only neutral relative to WACC
- Unfavorable asset turnover at 0.48
- Zero dividend yield
- Slightly higher leverage (DE 0.51)
- Declining revenue in Communications segment recently
TDY Weaknesses
- Unfavorable ROE at 8.51% below expectations
- PE ratio still elevated at 27.35
- Moderate current and quick ratios (1.64 and 1.08)
- Zero dividend yield
- Asset turnover low at 0.40
- Revenue concentration heavily in US market
Both companies show slightly favorable financial profiles but reveal contrasting strategic challenges. KEYS faces valuation concerns and moderate asset efficiency, while TDY contends with weaker returns and geographic concentration. These factors could influence their strategic focus on innovation and diversification.
The Moat Duel: Analyzing Competitive Defensibility
A structural moat is the only reliable shield protecting long-term profits from relentless competitive pressures in capital-intensive industries:
Keysight Technologies, Inc.: Intangible Assets and Innovation Moat
Keysight’s competitive edge stems from its cutting-edge electronic design automation and test solutions. Its financials show stable, high EBIT margins near 21%, but declining ROIC signals value erosion. New product lines in virtual network testing could either deepen or strain this moat in 2026.
Teledyne Technologies Incorporated: Diversified Industrial Systems Moat
Teledyne’s moat arises from its diversified instrumentation and aerospace components. Unlike Keysight, it exhibits a rising ROIC trend despite shedding value overall. Its broad portfolio and growing profitability position it to capitalize on emerging defense and environmental tech markets.
Innovation Depth vs. Diversification Breadth
While Keysight boasts a strong product innovation moat, Teledyne’s expanding ROIC trend and diversified segments suggest a deeper economic moat. I believe Teledyne is better equipped to defend market share amid evolving industrial demands.
Which stock offers better returns?
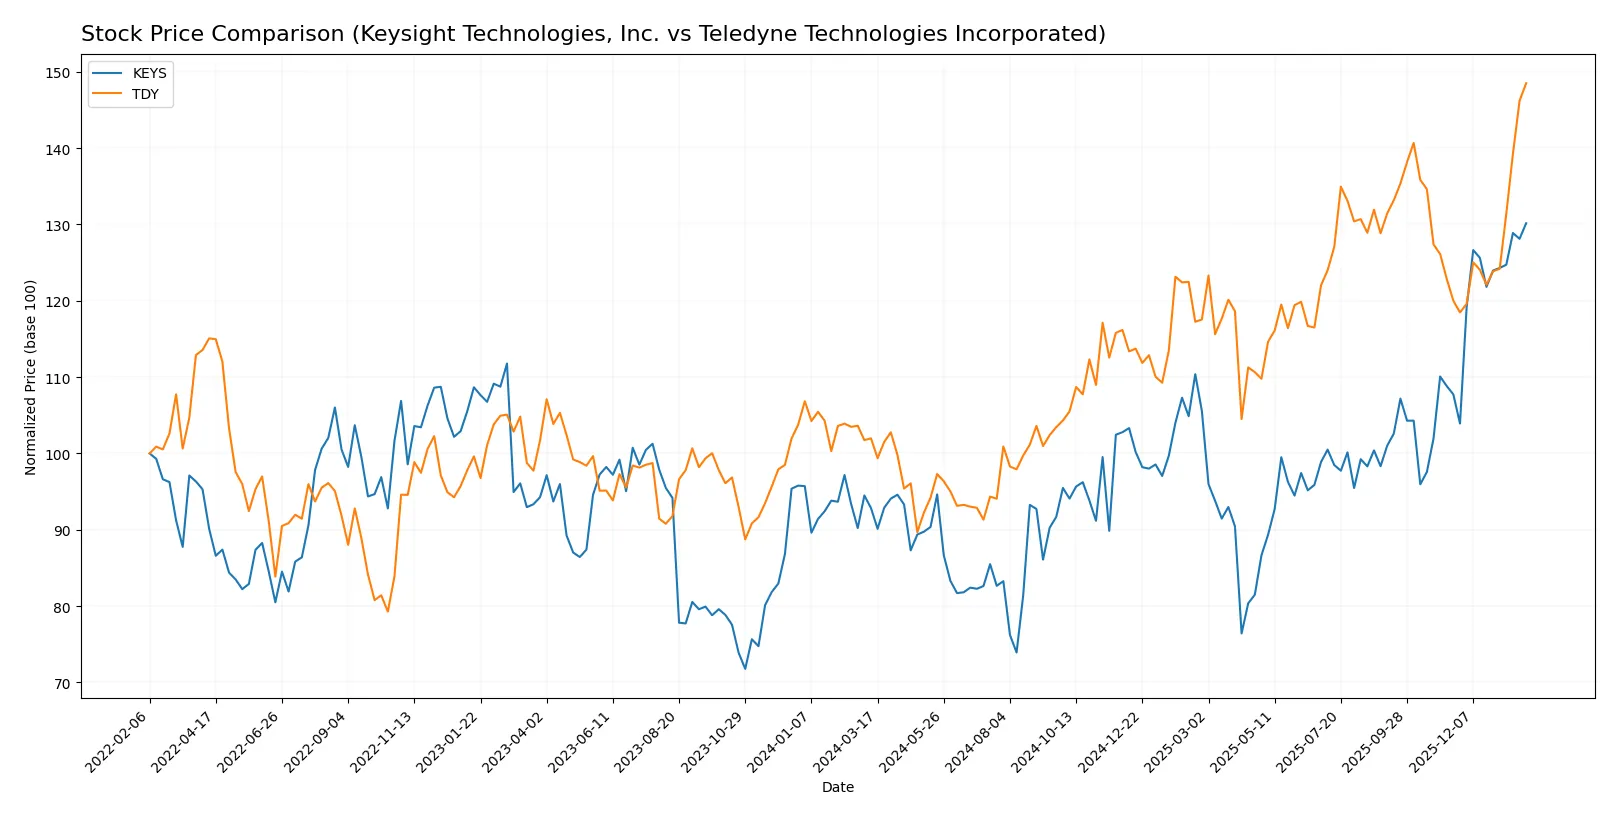
Over the past year, Keysight Technologies and Teledyne Technologies showed strong price appreciation with accelerating bullish trends and distinct trading volume dynamics.
Trend Comparison
Keysight Technologies’ stock rose 40.17% over 12 months, showing acceleration and a bullish trend. Price ranged from $122.87 to $216.33 with moderate volatility (20.07 std deviation).
Teledyne Technologies gained 45.62% in the same period, also accelerating bullishly. It experienced higher volatility (58.2 std deviation) with prices between $374.64 and $620.30.
Teledyne outperformed Keysight by 5.45 percentage points, delivering the stronger market performance despite greater price volatility.
Target Prices
Analysts offer a bullish consensus on Keysight Technologies and Teledyne Technologies, signaling growth potential ahead.
| Company | Target Low | Target High | Consensus |
|---|---|---|---|
| Keysight Technologies, Inc. | 210 | 243 | 226.5 |
| Teledyne Technologies Incorporated | 599 | 720 | 638.5 |
The consensus target for Keysight sits about 4.7% above its current price of $216.33, suggesting moderate upside. Teledyne’s target consensus exceeds its $620.30 price by roughly 3%, indicating measured optimism among analysts.

Don’t Let Luck Decide Your Entry Point
Optimize your entry points with our advanced ProRealTime indicators. You’ll get efficient buy signals with precise price targets for maximum performance. Start outperforming now!
How do institutions grade them?
Here is a comparison of the recent grades issued by major financial institutions for both companies:
Keysight Technologies, Inc. Grades
The table below shows recent grades from top financial firms on Keysight Technologies:
| Grading Company | Action | New Grade | Date |
|---|---|---|---|
| Morgan Stanley | Maintain | Equal Weight | 2025-12-17 |
| Jefferies | Maintain | Hold | 2025-12-10 |
| Baird | Maintain | Outperform | 2025-11-26 |
| Barclays | Maintain | Overweight | 2025-11-25 |
| Morgan Stanley | Maintain | Equal Weight | 2025-11-25 |
| Wells Fargo | Maintain | Overweight | 2025-11-25 |
| JP Morgan | Maintain | Overweight | 2025-11-25 |
| Susquehanna | Maintain | Positive | 2025-11-25 |
| Citigroup | Maintain | Buy | 2025-11-25 |
| UBS | Maintain | Buy | 2025-11-25 |
Teledyne Technologies Incorporated Grades
Below are recent grades from prominent analysts for Teledyne Technologies:
| Grading Company | Action | New Grade | Date |
|---|---|---|---|
| Barclays | Maintain | Equal Weight | 2026-01-22 |
| Needham | Maintain | Buy | 2026-01-22 |
| Stifel | Maintain | Buy | 2026-01-22 |
| Citigroup | Maintain | Neutral | 2026-01-13 |
| Barclays | Maintain | Equal Weight | 2026-01-12 |
| Needham | Maintain | Buy | 2025-10-23 |
| Barclays | Maintain | Equal Weight | 2025-10-23 |
| Stifel | Maintain | Buy | 2025-10-23 |
| Morgan Stanley | Maintain | Equal Weight | 2025-10-15 |
| UBS | Maintain | Buy | 2025-07-24 |
Which company has the best grades?
Both companies receive a mix of “Buy” and “Equal Weight” grades, but Keysight shows more “Overweight” and “Outperform” ratings. This diversity may suggest stronger analyst confidence in Keysight’s outlook, potentially influencing investors toward a more optimistic view.
Risks specific to each company
In the 2026 market environment, the following categories identify critical pressure points and systemic threats facing both Keysight Technologies, Inc. and Teledyne Technologies Incorporated:
1. Market & Competition
Keysight Technologies, Inc.
- Faces intense competition in electronic design and test solutions, requiring constant innovation to maintain market share.
Teledyne Technologies Incorporated
- Operates in diverse industrial markets but must manage competitive pressures in aerospace and defense segments.
2. Capital Structure & Debt
Keysight Technologies, Inc.
- Moderate debt-to-equity ratio (0.51) with favorable interest coverage (11.98), indicating balanced leverage.
Teledyne Technologies Incorporated
- Lower debt-to-equity (0.24) and strong interest coverage (19.47) reflect a more conservative capital structure.
3. Stock Volatility
Keysight Technologies, Inc.
- Beta of 1.179 suggests higher volatility relative to the market, increasing risk in turbulent periods.
Teledyne Technologies Incorporated
- Beta of 1.027 indicates moderate volatility, closer to market average, offering potentially steadier returns.
4. Regulatory & Legal
Keysight Technologies, Inc.
- Exposure to regulatory shifts in communications and defense sectors can impact operations and compliance costs.
Teledyne Technologies Incorporated
- Faces complex regulations across aerospace, defense, and environmental markets, increasing legal risk.
5. Supply Chain & Operations
Keysight Technologies, Inc.
- Supply chain disruptions in semiconductor and hardware components may affect production timelines.
Teledyne Technologies Incorporated
- Diverse product lines and global operations present risks from supply chain complexity and geopolitical factors.
6. ESG & Climate Transition
Keysight Technologies, Inc.
- Growing pressure to enhance sustainability practices amid rising ESG investor scrutiny.
Teledyne Technologies Incorporated
- Must navigate ESG compliance across multiple industrial sectors, with potential costs from climate transition.
7. Geopolitical Exposure
Keysight Technologies, Inc.
- Significant international sales expose the company to geopolitical tensions and trade restrictions.
Teledyne Technologies Incorporated
- Global footprint in sensitive defense and aerospace markets increases vulnerability to geopolitical risks.
Which company shows a better risk-adjusted profile?
Teledyne’s strongest risk lies in managing regulatory complexity across its diversified industrial sectors. Keysight faces the greatest challenge from competitive pressure in fast-evolving technology markets. Teledyne’s lower leverage and closer-to-market beta suggest a more conservative, stable risk profile. Notably, Keysight’s higher beta and premium valuation multiples heighten exposure to market swings, underscoring risk for momentum-driven investors.
Final Verdict: Which stock to choose?
Keysight Technologies stands out for its unmatched operational efficiency and robust cash flow generation. Its disciplined capital allocation supports steady innovation, but a declining ROIC signals a point of vigilance. This stock suits investors seeking aggressive growth with tolerance for shifting profitability dynamics.
Teledyne Technologies commands a strategic moat through its growing return on invested capital and stable cash conversion cycle. It offers greater financial stability than Keysight, reflected in stronger interest coverage and moderate leverage. This profile fits well with investors favoring GARP—growth at a reasonable price.
If you prioritize operational excellence and high-growth potential, Keysight appears compelling despite its profitability challenges. However, if you seek better stability and improving profitability trends, Teledyne offers a more balanced risk-reward profile. Both carry risks; your choice depends on your appetite for volatility versus steadiness.
Disclaimer: Investment carries a risk of loss of initial capital. The past performance is not a reliable indicator of future results. Be sure to understand risks before making an investment decision.
Go Further
I encourage you to read the complete analyses of Keysight Technologies, Inc. and Teledyne Technologies Incorporated to enhance your investment decisions: