Home > Comparison > Technology > TEL vs KEYS
The strategic rivalry between TE Connectivity Ltd. and Keysight Technologies, Inc. shapes the trajectory of the technology hardware sector. TE Connectivity operates as a capital-intensive manufacturer of connectivity and sensor solutions across multiple industries. In contrast, Keysight Technologies specializes in high-margin electronic design and test solutions, focusing on cutting-edge communications and industrial applications. This analysis evaluates which company’s operational model offers superior risk-adjusted returns for a diversified portfolio in 2026.
Table of contents
Companies Overview
TE Connectivity and Keysight Technologies both hold pivotal roles in the hardware and equipment sector, serving critical technology markets worldwide.
TE Connectivity Ltd.: Global Connectivity Solutions Leader
TE Connectivity dominates the connectivity and sensor solutions market, generating revenue from components used in automotive, industrial, and communication sectors. In 2026, it focused on expanding its Transportation and Industrial Solutions to enhance product integration across diverse end markets. Its extensive global footprint and broad product portfolio reinforce its competitive strength.
Keysight Technologies, Inc.: Electronic Test and Measurement Innovator
Keysight Technologies excels in electronic design and test solutions, serving communication, aerospace, and semiconductor industries. Its revenue streams arise from high-precision test equipment and software platforms. In 2026, it emphasized advancing its Communications Solutions Group, pushing innovation in RF testing and network virtualization tools to capture emerging tech demand.
Strategic Collision: Similarities & Divergences
Both companies operate in hardware with a strong tech emphasis but diverge in approach: TE Connectivity builds a broad product ecosystem focused on physical connectivity, while Keysight specializes in software-driven test and measurement solutions. Their competition centers on serving advanced industrial and communication markets. TE Connectivity’s scale contrasts with Keysight’s niche innovation, creating distinct investment profiles with different risk and growth dynamics.
Income Statement Comparison
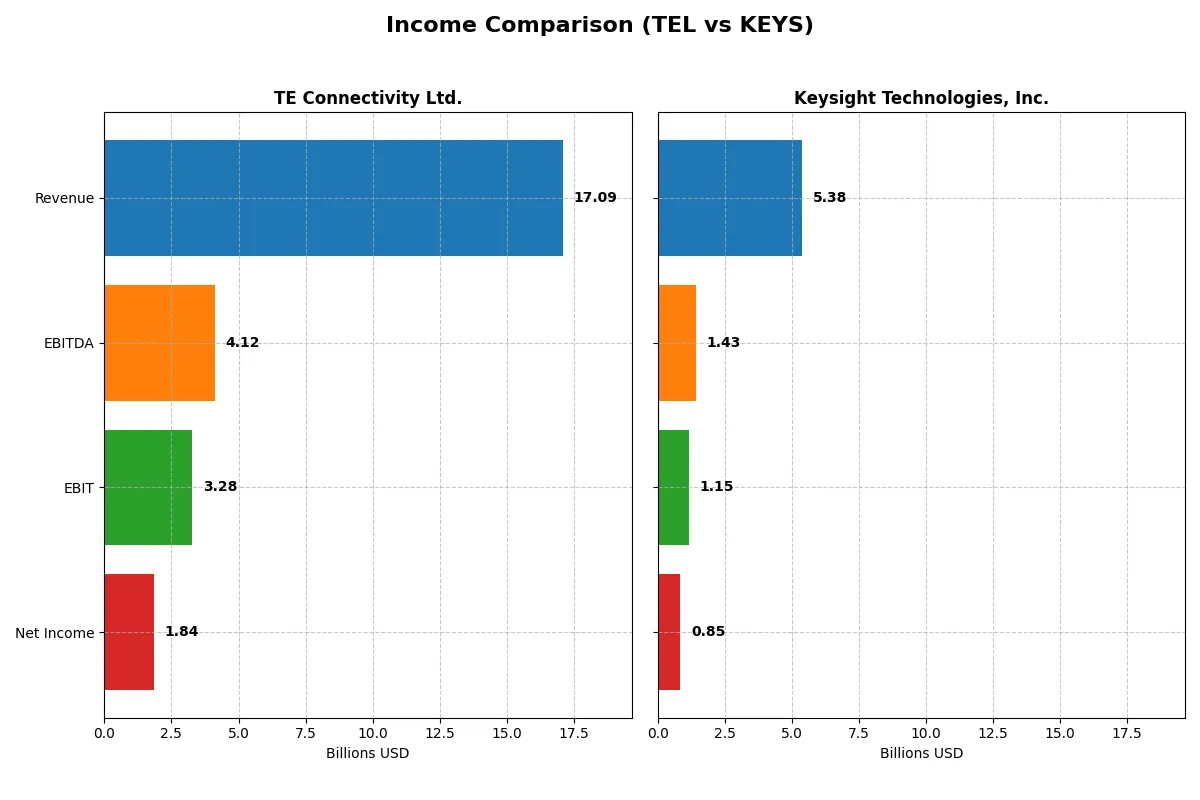
This table dissects the core profitability and scalability of both corporate engines to reveal who dominates the bottom line:
| Metric | TE Connectivity Ltd. (TEL) | Keysight Technologies, Inc. (KEYS) |
|---|---|---|
| Revenue | 17.1B | 5.38B |
| Cost of Revenue | 11.2B | 2.04B |
| Operating Expenses | 2.70B | 2.39B |
| Gross Profit | 5.91B | 3.34B |
| EBITDA | 4.12B | 1.43B |
| EBIT | 3.28B | 1.15B |
| Interest Expense | 77M | 96M |
| Net Income | 1.84B | 846M |
| EPS | 6.20 | 4.90 |
| Fiscal Year | 2025 | 2025 |
Income Statement Analysis: The Bottom-Line Duel
This income statement comparison uncovers which company runs its operations with superior efficiency and bottom-line strength.
TE Connectivity Ltd. Analysis
TE Connectivity’s revenue rose modestly to $17.1B in 2025, maintaining gross margin around 34.6%. However, net income dropped sharply to $1.84B from $3.19B the prior year, reflecting a weakened net margin near 10.8%. Despite stable operating efficiency, the steep net income decline signals margin pressures or one-off impacts.
Keysight Technologies, Inc. Analysis
Keysight grew revenue to $5.38B in 2025, sustaining a robust 62% gross margin and improving EBIT margin to 21.4%. Net income climbed to $846M with a net margin of 15.7%, reversing prior dips. The company demonstrates strong operational leverage and margin expansion amid steady top-line growth.
Margin Strength vs. Income Volatility
Keysight leads with superior gross and net margins, coupled with consistent net income growth and margin improvement. TE Connectivity shows revenue resilience but suffers notable net income volatility and margin contraction. For investors prioritizing stable profitability and efficiency, Keysight offers a clearer fundamental advantage over TE Connectivity’s uneven bottom-line performance.
Financial Ratios Comparison
These vital ratios act as a diagnostic tool to expose the underlying fiscal health, valuation premiums, and capital efficiency of the companies compared below:
| Ratios | TE Connectivity Ltd. (TEL) | Keysight Technologies, Inc. (KEYS) |
|---|---|---|
| ROE | 14.6% | 14.4% |
| ROIC | 8.8% | 8.0% |
| P/E | 35.0 | 37.4 |
| P/B | 5.12 | 5.39 |
| Current Ratio | 1.56 | 2.35 |
| Quick Ratio | 1.03 | 1.78 |
| D/E | 0.52 | 0.51 |
| Debt-to-Assets | 26.1% | 26.3% |
| Interest Coverage | 41.7 | 9.88 |
| Asset Turnover | 0.68 | 0.48 |
| Fixed Asset Turnover | 3.96 | 5.21 |
| Payout ratio | 44% | 0% |
| Dividend yield | 1.25% | 0% |
| Fiscal Year | 2025 | 2025 |
Efficiency & Valuation Duel: The Vital Signs
Financial ratios act as a company’s DNA, unveiling operational strengths and hidden risks that shape investor outcomes.
TE Connectivity Ltd.
TE Connectivity shows a solid 14.6% ROE with a favorable 10.8% net margin, signaling decent profitability. The P/E at 35.0 and P/B at 5.12 indicate the stock trades at a premium. It returns value via a modest 1.25% dividend yield, balancing income with ongoing reinvestment in R&D (4.85% of sales).
Keysight Technologies, Inc.
Keysight delivers a comparable 14.4% ROE but boasts a higher 15.7% net margin, reflecting stronger core efficiency. Its valuation is more stretched, with a P/E of 37.4 and P/B of 5.39. The company pays no dividend, opting instead for aggressive reinvestment into R&D (18.7% of sales), fueling growth.
Premium Valuation vs. Operational Safety
Both companies carry premium valuations and show slightly favorable financial profiles. TE Connectivity offers a balanced mix of shareholder returns and operational efficiency. Keysight excels in margin but demands a higher valuation and foregoes dividends. TE fits investors seeking income and stability; Keysight suits those prioritizing growth.
Which one offers the Superior Shareholder Reward?
TE Connectivity (TEL) pays a 1.25% dividend yield with a 44% payout ratio, supported by strong free cash flow coverage above 77%. It complements dividends with consistent buybacks, sustaining shareholder returns. Keysight Technologies (KEYS) offers no dividends but invests heavily in growth and R&D, with a robust buyback program, signaling capital allocation to long-term value. Historically in tech hardware, dividend payers like TEL provide steady income but face valuation pressure (P/E ~35). KEYS trades at a premium (P/E ~37) reflecting growth expectations but lacks immediate income. I find TEL’s balanced distribution—dividends plus buybacks—more sustainable and attractive for total return in 2026, especially amid market volatility.
Comparative Score Analysis: The Strategic Profile
The radar chart reveals the fundamental DNA and trade-offs of TE Connectivity Ltd. and Keysight Technologies, Inc., highlighting their core strengths and vulnerabilities:
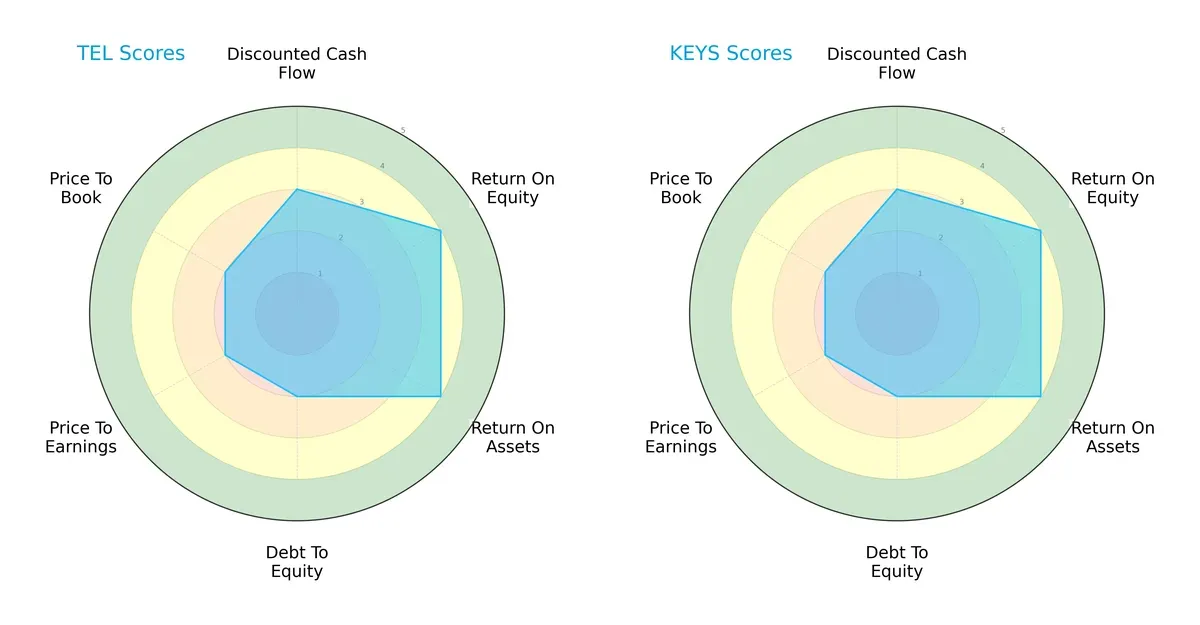
Both companies share identical scores across all metrics: a moderate overall score of 3, balanced DCF scores of 3, and favorable ROE and ROA scores of 4 each. Their debt-to-equity and valuation metrics (P/E and P/B) both sit at moderate levels of 2. This parity suggests both firms maintain a similarly balanced profile without a singular competitive edge dominating their financial strategy.
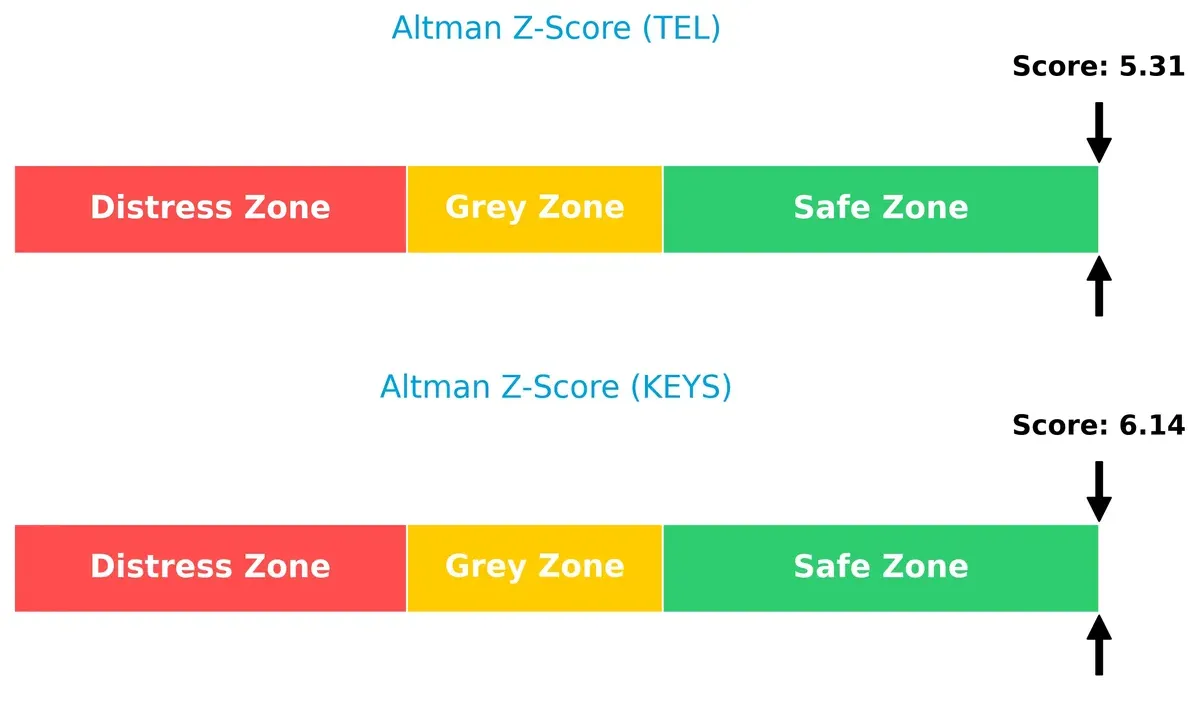
Bankruptcy Risk: Solvency Showdown
I observe a clear solvency advantage for Keysight Technologies, with an Altman Z-Score of 6.14 versus TE Connectivity’s 5.31. Both scores are comfortably in the safe zone, implying robust long-term financial stability in this cycle:
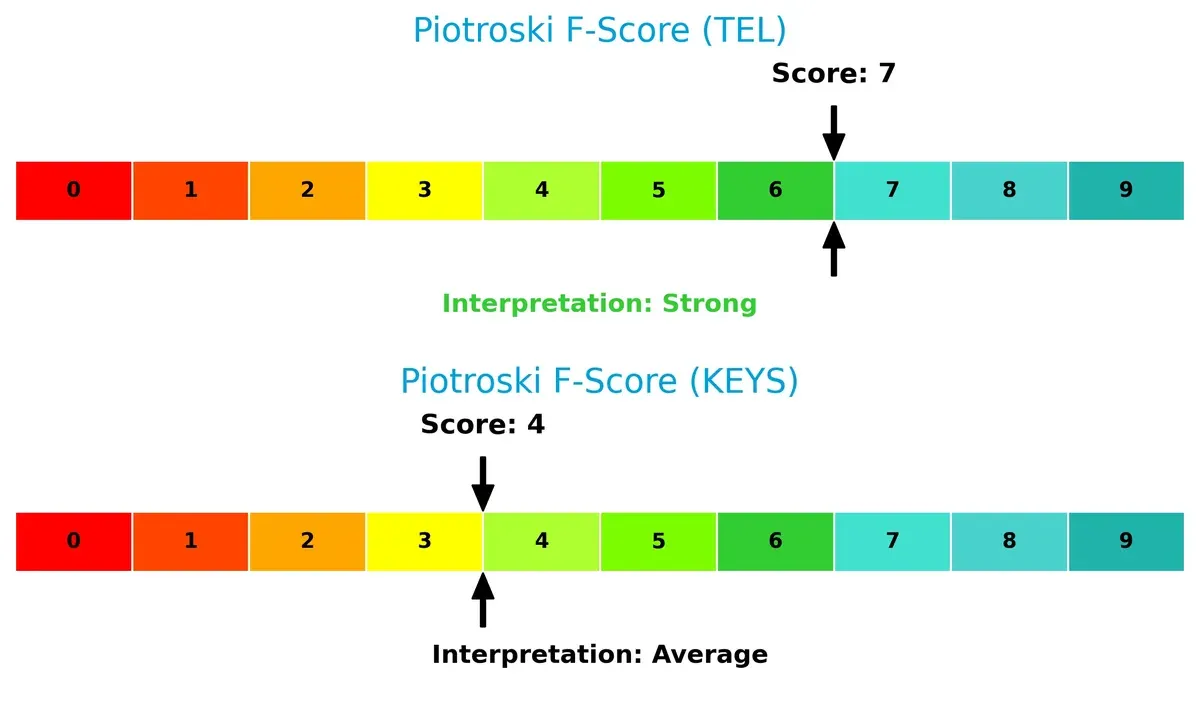
Financial Health: Quality of Operations
TE Connectivity leads decisively in financial health with a Piotroski F-Score of 7 compared to Keysight’s average score of 4. This suggests TE Connectivity exhibits stronger profitability, liquidity, and operational efficiency, whereas Keysight may show cautionary signs in internal metrics:
How are the two companies positioned?
This section dissects TEL and KEYS’s operational DNA by comparing their revenue distribution and internal dynamics, highlighting strengths and weaknesses. The goal is to confront their economic moats to reveal the most resilient competitive advantage today.
Revenue Segmentation: The Strategic Mix
This comparison dissects how TE Connectivity Ltd. and Keysight Technologies, Inc. diversify their income streams and where their primary sector bets lie:
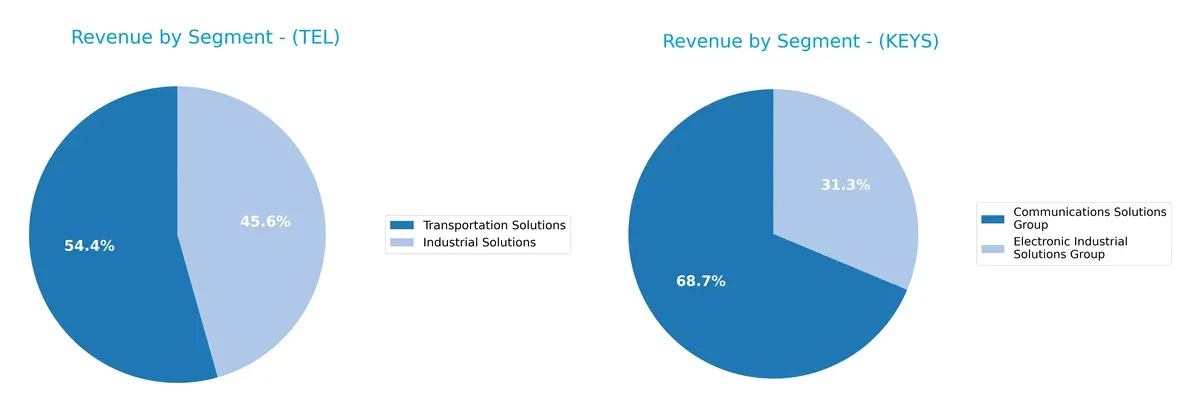
TE Connectivity leans heavily on Transportation Solutions, generating $9.4B, overshadowing its $7.9B Industrial Solutions. This concentration signals reliance on infrastructure dominance but exposes it to sector-specific risks. In contrast, Keysight splits revenue more evenly between Communications Solutions Group ($3.4B) and Electronic Industrial Solutions Group ($1.6B), reflecting a balanced approach that cushions against volatility in any single segment. Keysight’s mix supports a stable innovation ecosystem.
Strengths and Weaknesses Comparison
This table compares the Strengths and Weaknesses of TE Connectivity Ltd. and Keysight Technologies, Inc.:
TE Connectivity Ltd. Strengths
- Diverse product segments including Industrial and Transportation Solutions
- Strong global presence with balanced revenues across major regions
- Favorable net margin of 10.78% and strong liquidity ratios
- High fixed asset turnover indicating efficient asset use
- Favorable debt to assets and interest coverage
Keysight Technologies, Inc. Strengths
- Higher net margin at 15.74% reflecting strong profitability
- Favorable liquidity ratios with current ratio at 2.35
- Efficient fixed asset turnover at 5.21
- Balanced geographic revenues across Americas, Asia Pacific, and Europe
- Favorable debt to assets and adequate interest coverage
TE Connectivity Ltd. Weaknesses
- Unfavorable valuation metrics with PE at 35.0 and PB at 5.12
- ROIC slightly below WACC suggesting limited capital efficiency
- Neutral asset turnover at 0.68 may indicate potential for improvement
- Neutral return on equity at 14.64%
Keysight Technologies, Inc. Weaknesses
- Unfavorable valuation with PE at 37.41 and PB at 5.39
- Unfavorable asset turnover at 0.48 signals lower operational efficiency
- Zero dividend yield may deter income-focused investors
- ROIC of 8.02% marginally below WACC at 8.89%
Both companies show slightly favorable overall financial profiles with solid profitability and liquidity. TE Connectivity’s broader product and geographic diversification contrasts with Keysight’s higher margin and asset efficiency in fixed assets. Each faces valuation and capital efficiency challenges that could influence strategic priorities.
The Moat Duel: Analyzing Competitive Defensibility
A structural moat alone protects long-term profits from relentless competition erosion. Let’s examine how TE Connectivity and Keysight Technologies defend their turf:
TE Connectivity Ltd.: Durable Industrial Connectivity Moat
TE Connectivity’s moat stems from high switching costs embedded in its specialized connectivity solutions. This delivers stable margins near 19% EBIT. Yet, declining ROIC signals value erosion, threatening moat durability in 2026.
Keysight Technologies, Inc.: Precision Test Equipment Moat
Keysight’s moat relies on intangible assets and advanced technology leadership, reflected in a superior 21.4% EBIT margin and robust gross margin above 62%. Still, its falling ROIC warns of competitive pressure ahead.
Industrial Connectivity vs. Advanced Test Solutions: The Moat Face-Off
Both firms show declining ROIC and value destruction, but TE Connectivity’s entrenched switching costs yield steadier margin stability. I see TE better positioned to defend market share despite challenges.
Which stock offers better returns?
The past year shows TE Connectivity with a strong 58.5% rise but recent deceleration. Keysight posted a 40.2% gain and accelerating momentum into early 2026.
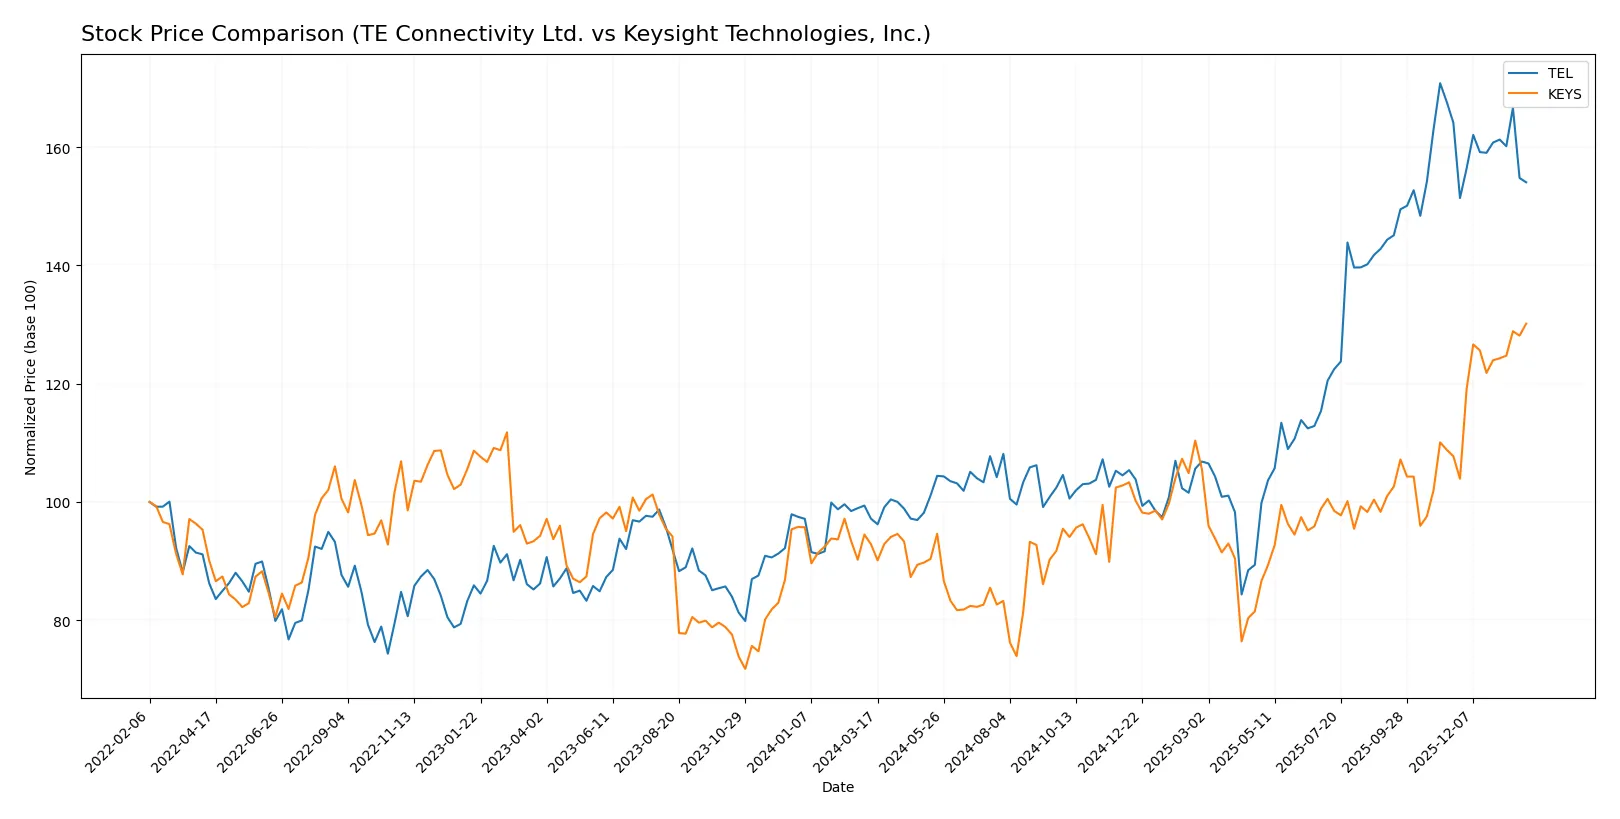
Trend Comparison
TE Connectivity’s stock surged 58.5% over 12 months, marking a bullish trend with decelerating growth. It reached a high of 247.01 and a low of 122.0, indicating strong overall momentum.
Keysight Technologies rose 40.2% over the same period, also bullish but with accelerating gains. Its price ranged between 122.87 and 216.33, showing more stable volatility than TE.
TE Connectivity delivered higher total returns, but Keysight’s accelerating recent trend contrasts TE’s deceleration, highlighting differing momentum profiles.
Target Prices
Analysts present a confident target price consensus for TE Connectivity Ltd. and Keysight Technologies, Inc.
| Company | Target Low | Target High | Consensus |
|---|---|---|---|
| TE Connectivity Ltd. | 238 | 306 | 270.29 |
| Keysight Technologies, Inc. | 210 | 243 | 226.5 |
The consensus targets for both stocks exceed current prices, suggesting upside potential. TE Connectivity’s target consensus stands about 21% above its $223 price, while Keysight’s target is roughly 5% above its $216 price.

Don’t Let Luck Decide Your Entry Point
Optimize your entry points with our advanced ProRealTime indicators. You’ll get efficient buy signals with precise price targets for maximum performance. Start outperforming now!
How do institutions grade them?
Here are the latest institutional grades for TE Connectivity Ltd. and Keysight Technologies, Inc.:
TE Connectivity Ltd. Grades
This table shows recent rating updates and actions for TE Connectivity Ltd.:
| Grading Company | Action | New Grade | Date |
|---|---|---|---|
| Oppenheimer | Upgrade | Outperform | 2026-01-27 |
| Barclays | Maintain | Overweight | 2026-01-23 |
| Truist Securities | Maintain | Hold | 2026-01-22 |
| Wells Fargo | Maintain | Equal Weight | 2026-01-22 |
| UBS | Maintain | Buy | 2026-01-14 |
| Truist Securities | Maintain | Hold | 2025-12-19 |
| Wells Fargo | Maintain | Equal Weight | 2025-12-09 |
| Truist Securities | Maintain | Hold | 2025-11-21 |
| Barclays | Maintain | Overweight | 2025-11-21 |
| TD Cowen | Maintain | Buy | 2025-11-17 |
Keysight Technologies, Inc. Grades
Below is a summary of recent grades and recommendations for Keysight Technologies, Inc.:
| Grading Company | Action | New Grade | Date |
|---|---|---|---|
| Morgan Stanley | Maintain | Equal Weight | 2025-12-17 |
| Jefferies | Maintain | Hold | 2025-12-10 |
| Baird | Maintain | Outperform | 2025-11-26 |
| Barclays | Maintain | Overweight | 2025-11-25 |
| Morgan Stanley | Maintain | Equal Weight | 2025-11-25 |
| Wells Fargo | Maintain | Overweight | 2025-11-25 |
| JP Morgan | Maintain | Overweight | 2025-11-25 |
| Susquehanna | Maintain | Positive | 2025-11-25 |
| Citigroup | Maintain | Buy | 2025-11-25 |
| UBS | Maintain | Buy | 2025-11-25 |
Which company has the best grades?
TE Connectivity received an upgrade to Outperform from Oppenheimer, signaling recent positive momentum. Keysight’s ratings remain stable with multiple Overweight and Buy grades but no recent upgrades. TE’s upgrade may increase investor interest and valuation potential.
Risks specific to each company
The following categories identify the critical pressure points and systemic threats facing both firms in the 2026 market environment:
1. Market & Competition
TE Connectivity Ltd.
- Faces intense competition in hardware and connectivity sectors; market cap nearly $65B provides some scale advantage.
Keysight Technologies, Inc.
- Competes in electronic design and test solutions with a smaller $37B market cap; innovation pace is crucial.
2. Capital Structure & Debt
TE Connectivity Ltd.
- Maintains moderate debt-to-equity at 0.52 with strong interest coverage of 42.6x, indicating sound debt management.
Keysight Technologies, Inc.
- Similar debt-to-equity of 0.51 but weaker interest coverage at 12x, suggesting tighter debt servicing capacity.
3. Stock Volatility
TE Connectivity Ltd.
- Beta of 1.24 implies above-average market volatility but manageable risk relative to S&P 500 benchmarks.
Keysight Technologies, Inc.
- Slightly lower beta at 1.18 signals marginally less volatility, beneficial in turbulent markets.
4. Regulatory & Legal
TE Connectivity Ltd.
- Global footprint in 140 countries increases exposure to diverse regulatory regimes and compliance costs.
Keysight Technologies, Inc.
- Operating primarily in US and global markets with defense sector exposure; regulatory scrutiny remains elevated.
5. Supply Chain & Operations
TE Connectivity Ltd.
- Extensive global supply chain risks amid geopolitical tensions; 85K employees offer operational scale but complexity.
Keysight Technologies, Inc.
- Smaller workforce of 15.4K may allow more agile supply chain responses but less scale leverage.
6. ESG & Climate Transition
TE Connectivity Ltd.
- Swiss base and industrial exposure require proactive ESG strategy to meet evolving climate regulations.
Keysight Technologies, Inc.
- US-based with significant tech focus; ESG risks linked to energy consumption and product lifecycle management.
7. Geopolitical Exposure
TE Connectivity Ltd.
- Broad international presence exposes it to currency fluctuations and trade tensions, particularly in Asia-Pacific.
Keysight Technologies, Inc.
- US-centric with global sales, geopolitical risks include defense contracts and export controls.
Which company shows a better risk-adjusted profile?
TE Connectivity’s strongest risk is its complex global supply chain with geopolitical exposure that could disrupt operations. Keysight faces its most significant risk in regulatory and legal challenges tied to defense and technology sectors. TE Connectivity’s superior interest coverage and higher Piotroski score suggest a more resilient financial footing. However, Keysight’s lower beta offers marginally less market volatility. Overall, TE Connectivity presents a slightly better risk-adjusted profile, supported by its robust liquidity and safer Altman Z-score of 5.3 versus Keysight’s 6.1, though both remain comfortably in the safe zone.
Final Verdict: Which stock to choose?
TE Connectivity’s superpower lies in its operational resilience and solid cash flow generation, making it a reliable cash machine despite a concerning decline in profitability metrics. Its slight valuation premium and value erosion signal a point of vigilance. It fits best in a core portfolio seeking steady industrial exposure with moderate growth.
Keysight Technologies commands a strategic moat through its dominant position in high-margin test and measurement solutions, backed by robust recurring revenue and superior margin expansion. It offers a safer liquidity profile and accelerating price momentum compared to TE Connectivity. This makes it suitable for GARP investors aiming for growth with reasonable financial stability.
If you prioritize operational cash flow strength and industrial cycle exposure, TE Connectivity presents a compelling choice due to its steady free cash flow despite margin pressures. However, if you seek growth driven by innovation and margin expansion with better short-term price acceleration, Keysight outshines with its stronger income growth and safer liquidity. Both carry risks from declining ROIC trends, demanding careful monitoring.
Disclaimer: Investment carries a risk of loss of initial capital. The past performance is not a reliable indicator of future results. Be sure to understand risks before making an investment decision.
Go Further
I encourage you to read the complete analyses of TE Connectivity Ltd. and Keysight Technologies, Inc. to enhance your investment decisions: