In the dynamic world of technology hardware, Keysight Technologies, Inc. and Ouster, Inc. stand out for their innovation and market presence. Keysight, a seasoned leader in electronic test and measurement solutions, contrasts with Ouster’s cutting-edge digital lidar sensors for 3D vision applications. Both companies operate within overlapping sectors, making their strategies and growth potential highly relevant for investors. This article will help you decide which company holds the most promise for your investment portfolio.

Table of contents
Companies Overview
I will begin the comparison between Keysight Technologies and Ouster by providing an overview of these two companies and their main differences.
Keysight Technologies Overview
Keysight Technologies, Inc. provides electronic design and test solutions across sectors including communications, aerospace, defense, automotive, and semiconductors. Founded in 1939 and headquartered in Santa Rosa, California, Keysight offers a broad range of hardware, software, and services such as electronic design automation, test instruments, and network test platforms. It serves global markets with a workforce of 15,400 employees and a market capitalization of 36B USD.
Ouster Overview
Ouster, Inc. specializes in designing and manufacturing high-resolution digital lidar sensors and enabling software for 3D vision applications in machinery, vehicles, robots, and fixed infrastructure. Founded more recently and based in San Francisco, California, Ouster operates with a smaller team of 292 employees and a market capitalization of 1.6B USD. Its product portfolio includes scanning and solid-state flash lidar sensors.
Key similarities and differences
Both Keysight and Ouster operate in the technology sector within the hardware, equipment, and parts industry. While Keysight focuses broadly on electronic design and test solutions with diversified products and services, Ouster targets a niche market focused on lidar sensor technology for 3D vision applications. Keysight’s business model includes extensive product support and consulting, whereas Ouster centers on sensor design and manufacturing, reflecting different scales and market approaches.
Income Statement Comparison
Below is a side-by-side comparison of the latest fiscal year income statement metrics for Keysight Technologies, Inc. and Ouster, Inc.
| Metric | Keysight Technologies, Inc. | Ouster, Inc. |
|---|---|---|
| Market Cap | 36B | 1.6B |
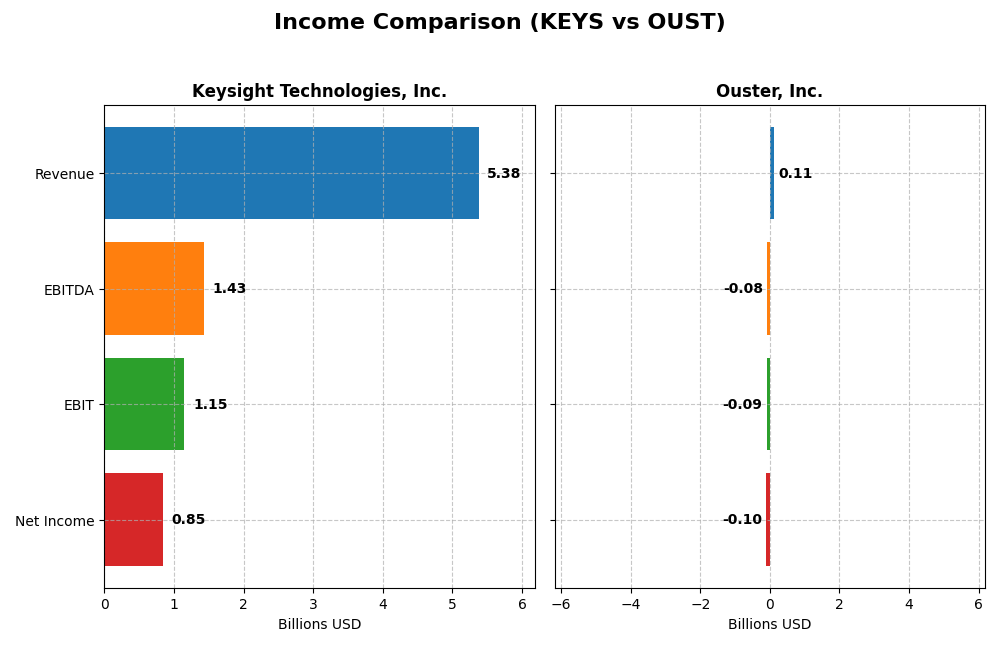
| Revenue | 5.38B | 111M |
| EBITDA | 1.43B | -80M |
| EBIT | 1.15B | -95M |
| Net Income | 846M | -97M |
| EPS | 4.9 | -2.08 |
| Fiscal Year | 2025 | 2024 |
Income Statement Interpretations
Keysight Technologies, Inc.
Keysight’s revenue showed steady growth from 2021 to 2025, rising from $4.94B to $5.38B, while net income fluctuated, peaking at $1.06B in 2023 before falling to $846M in 2025. Margins remained favorable, with a strong gross margin above 62% and improving net margin in the latest year. The 2025 performance indicated moderate revenue growth of 7.95% and significant net margin expansion.
Ouster, Inc.
Ouster exhibited rapid revenue growth, jumping from $19M in 2020 to $111M in 2024, with net income losses narrowing from -$107M to -$97M over the same period. Despite continued negative net margins (-87.35% in 2024), improvements were evident with a 33.41% revenue increase and substantial gains in gross profit and EPS in the most recent year. EBIT margin remains deeply negative but improving.
Which one has the stronger fundamentals?
Keysight demonstrates more stable and profitable fundamentals with consistent revenue and positive net income, maintaining strong margins and moderate growth. Ouster, while showing impressive growth rates and margin improvements, still operates at significant losses and negative profitability metrics. Keysight’s established profitability contrasts with Ouster’s high-growth but riskier financial profile.
Financial Ratios Comparison
The table below presents the most recent key financial ratios for Keysight Technologies, Inc. and Ouster, Inc. as of their latest fiscal years, providing a snapshot of their operational efficiency, profitability, liquidity, and leverage.
| Ratios | Keysight Technologies, Inc. (2025 FY) | Ouster, Inc. (2024 FY) |
|---|---|---|
| ROE | 14.40% | -53.64% |
| ROIC | 7.98% | -50.84% |
| P/E | 37.41 | -5.87 |
| P/B | 5.39 | 3.15 |
| Current Ratio | 2.35 | 2.80 |
| Quick Ratio | 1.78 | 2.59 |
| D/E (Debt-to-Equity) | 0.51 | 0.11 |
| Debt-to-Assets | 26.31% | 7.33% |
| Interest Coverage | 9.88 | -57.15 |
| Asset Turnover | 0.48 | 0.40 |
| Fixed Asset Turnover | 5.21 | 4.54 |
| Payout ratio | 0% | 0% |
| Dividend yield | 0% | 0% |
Interpretation of the Ratios
Keysight Technologies, Inc.
Keysight shows a slightly favorable profile with strong liquidity (current ratio 2.35) and solid interest coverage (11.98), but some valuation concerns with a high PE of 37.41 and PB of 5.39. Profitability margins and debt metrics are stable, though asset turnover is weak. The company does not pay dividends, focusing on reinvestment and R&D, which supports its growth and innovation strategy.
Ouster, Inc.
Ouster’s ratios present an unfavorable overall picture, marked by negative profitability metrics (net margin -87.35%, ROE -53.64%) and high WACC (17.47%). Liquidity ratios are strong, and leverage remains low, but interest coverage is negative. The company pays no dividends, likely due to ongoing investments and a high-growth phase prioritizing R&D and expansion efforts.
Which one has the best ratios?
Comparing both, Keysight maintains a more balanced and favorable financial position with stronger profitability and coverage ratios despite some valuation concerns. Ouster’s ratios are notably weaker, reflecting its early-stage growth challenges and negative returns, leading to an overall less favorable assessment.
Strategic Positioning
This section compares the strategic positioning of Keysight Technologies and Ouster, including market position, key segments, and exposure to technological disruption:
Keysight Technologies, Inc.
- Large market cap (36B) with diversified customers across communications, aerospace, automotive, and more.
- Key segments include Communications Solutions (3.42B revenue) and Electronic Industrial Solutions (1.56B revenue).
- Operates in established electronic design and test equipment markets with moderate beta (1.18).
Ouster, Inc.
- Smaller market cap (1.6B), focused on high-resolution digital lidar sensors for vehicles and infrastructure.
- Single reportable segment focused on product sales of lidar sensors, with 111M revenue in 2024.
- Operates in emerging lidar technology with higher beta (2.94), indicating higher volatility and disruption potential.
Keysight Technologies vs Ouster Positioning
Keysight has a diversified portfolio serving multiple industries with substantial revenues, while Ouster concentrates on a niche lidar market with smaller scale but growing revenue. Keysight’s broader market exposure contrasts with Ouster’s focused innovation in 3D vision technology.
Which has the best competitive advantage?
Both companies are currently shedding value with ROIC below WACC. However, Ouster shows improving profitability with a growing ROIC trend, while Keysight faces declining returns and a very unfavorable moat status.
Stock Comparison
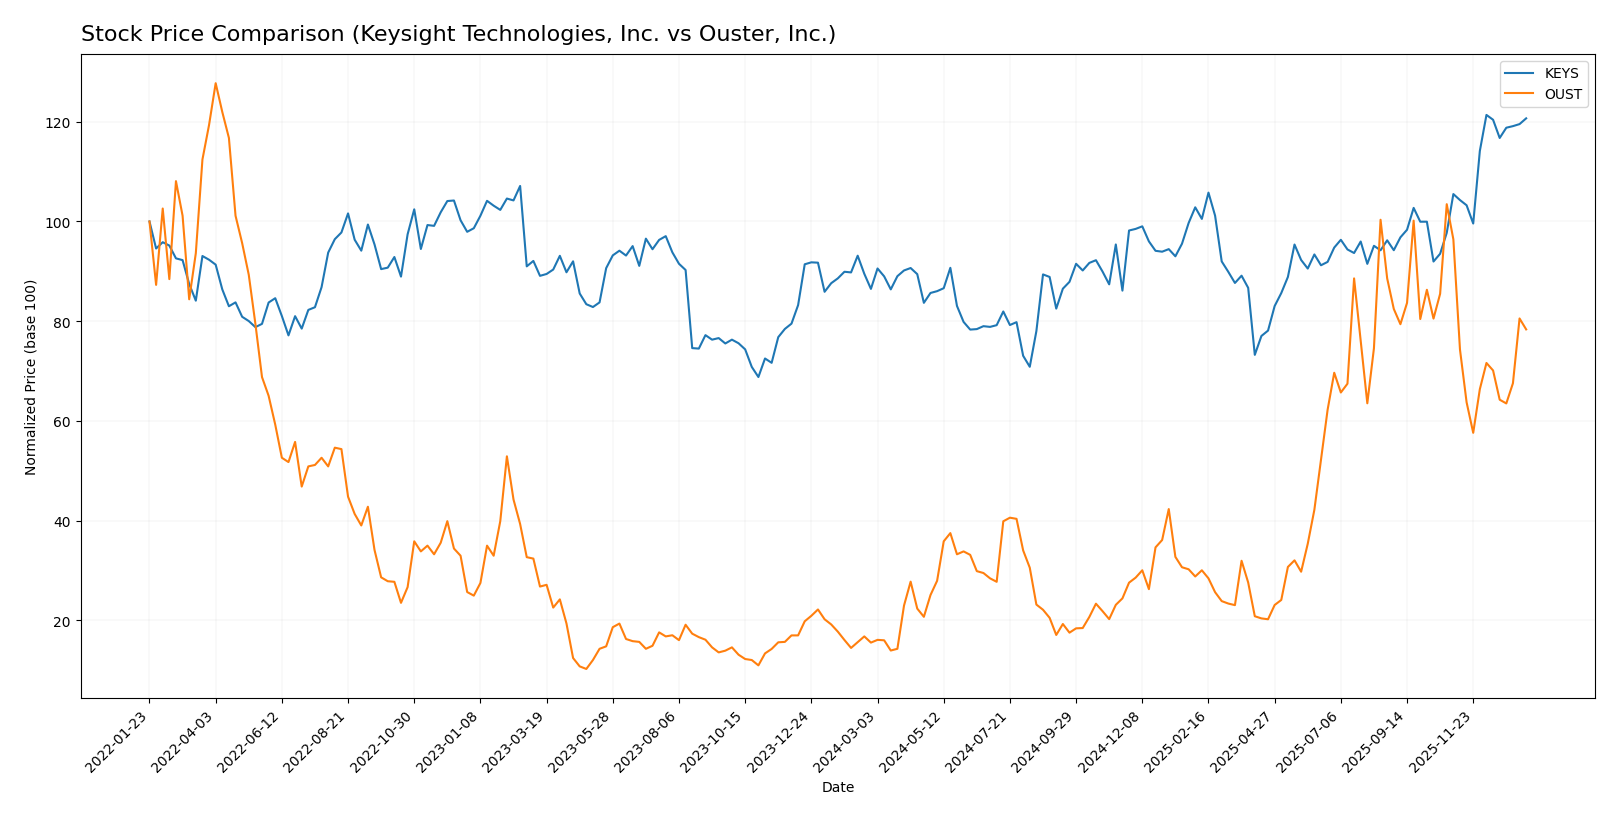
The stock price chart highlights significant bullish momentum for both Keysight Technologies, Inc. and Ouster, Inc. over the past year, with Ouster showing a notably higher percentage gain despite recent downward pressure.
Trend Analysis
Keysight Technologies, Inc. demonstrated a strong bullish trend over the past 12 months with a 39.56% price increase, showing acceleration and a high volatility level reflected by an 18.51 std deviation. The stock ranged between 122.87 and 210.49.
Ouster, Inc. recorded an impressive 404.84% price increase over the same period, indicating a bullish trend with deceleration and lower volatility at 8.61 std deviation. However, the recent 2.5-month period shows an 18.74% decline and a negative slope.
Comparing the two, Ouster delivered the highest market performance over the past year despite recent short-term weakness, while Keysight maintained steady bullish acceleration with moderate volatility.
Target Prices
Analysts present a generally optimistic target price consensus for both Keysight Technologies, Inc. and Ouster, Inc.
| Company | Target High | Target Low | Consensus |
|---|---|---|---|
| Keysight Technologies, Inc. | 232 | 210 | 225.13 |
| Ouster, Inc. | 39 | 33 | 36.67 |
The consensus target prices for Keysight and Ouster are approximately 7.6% and 35.3% above their current stock prices, respectively, indicating positive growth expectations from analysts.
Analyst Opinions Comparison
This section compares analysts’ ratings and grades for Keysight Technologies, Inc. (KEYS) and Ouster, Inc. (OUST):
Rating Comparison
KEYS Rating
- Rating: B, considered very favorable by analysts.
- Discounted Cash Flow Score: 3, indicating moderate valuation.
- ROE Score: 4, a favorable measure of profit generation.
- ROA Score: 4, favorable asset utilization by the company.
- Debt To Equity Score: 2, moderate financial risk.
- Overall Score: 3, moderate overall financial standing.
OUST Rating
- Rating: C-, also marked very favorable but lower than KEYS.
- Discounted Cash Flow Score: 1, very unfavorable valuation.
- ROE Score: 1, very unfavorable in profit efficiency.
- ROA Score: 1, very unfavorable asset use performance.
- Debt To Equity Score: 3, moderate financial risk but higher.
- Overall Score: 1, very unfavorable overall financial health.
Which one is the best rated?
Based strictly on the provided data, KEYS is clearly better rated than OUST. KEYS holds higher scores in key financial metrics such as ROE, ROA, discounted cash flow, and overall assessment, indicating stronger financial health and profitability.
Scores Comparison
Here is a comparison of the Altman Z-Score and Piotroski Score for both companies:
KEYS Scores
- Altman Z-Score: 5.94, indicating a safe zone with low bankruptcy risk.
- Piotroski Score: 4, representing an average financial strength.
OUST Scores
- Altman Z-Score: 3.66, also in the safe zone but closer to the grey area.
- Piotroski Score: 4, indicating average financial strength as well.
Which company has the best scores?
KEYS has a higher Altman Z-Score than OUST, suggesting stronger financial stability. Both have identical Piotroski Scores, reflecting similar average financial strength. Therefore, KEYS shows marginally better scores based on the provided data.
Grades Comparison
Here is a detailed comparison of the latest available grades from recognized grading companies for Keysight Technologies, Inc. and Ouster, Inc.:
Keysight Technologies, Inc. Grades
The table below summarizes recent grades assigned by leading financial institutions for Keysight Technologies, Inc.:
| Grading Company | Action | New Grade | Date |
|---|---|---|---|
| Morgan Stanley | Maintain | Equal Weight | 2025-12-17 |
| Jefferies | Maintain | Hold | 2025-12-10 |
| Baird | Maintain | Outperform | 2025-11-26 |
| Barclays | Maintain | Overweight | 2025-11-25 |
| JP Morgan | Maintain | Overweight | 2025-11-25 |
| Jefferies | Maintain | Hold | 2025-11-25 |
| Citigroup | Maintain | Buy | 2025-11-25 |
| UBS | Maintain | Buy | 2025-11-25 |
| Wells Fargo | Maintain | Overweight | 2025-11-25 |
| Susquehanna | Maintain | Positive | 2025-11-25 |
The overall grading trend for Keysight Technologies is stable, with a mix of Buy, Overweight, Hold, and Outperform ratings and no recent downgrades.
Ouster, Inc. Grades
The table below summarizes recent grades assigned by recognized financial institutions for Ouster, Inc.:
| Grading Company | Action | New Grade | Date |
|---|---|---|---|
| Cantor Fitzgerald | Upgrade | Overweight | 2025-11-07 |
| Cantor Fitzgerald | Upgrade | Overweight | 2025-11-06 |
| WestPark Capital | Maintain | Buy | 2025-11-05 |
| Rosenblatt | Maintain | Buy | 2025-11-05 |
| WestPark Capital | Upgrade | Buy | 2025-08-13 |
| Oppenheimer | Maintain | Outperform | 2025-07-16 |
| WestPark Capital | Downgrade | Hold | 2025-06-12 |
| WestPark Capital | Upgrade | Buy | 2025-05-09 |
| Rosenblatt | Maintain | Buy | 2025-03-21 |
| Cantor Fitzgerald | Maintain | Overweight | 2025-03-21 |
Ouster’s grades show some recent upgrades and a generally positive outlook, though there is a single downgrade noted earlier in 2025.
Which company has the best grades?
Both companies hold a consensus “Buy” rating, but Keysight Technologies has a larger number of Buy and Overweight ratings from a wider variety of firms, indicating broader analyst confidence. Ouster shows positive momentum with recent upgrades, which may attract investors seeking growth potential.
Strengths and Weaknesses
Below is a comparison of the key strengths and weaknesses of Keysight Technologies, Inc. (KEYS) and Ouster, Inc. (OUST) based on recent financial and operational data.
| Criterion | Keysight Technologies, Inc. (KEYS) | Ouster, Inc. (OUST) |
|---|---|---|
| Diversification | Strong diversification with multiple segments: Communications Solutions and Electronic Industrial Solutions generating $3.42B and $1.56B respectively in 2024. | Limited diversification, primarily one reportable segment with $111M revenue in 2024. |
| Profitability | Positive net margin (15.74%), ROIC near WACC, but declining value creation (ROIC < WACC). | Negative net margin (-87.35%) and ROIC (-50.84%), but showing improving ROIC trend. |
| Innovation | Established in test and measurement solutions, moderate innovation pace. | Emerging tech company with high innovation potential in lidar sensors. |
| Global presence | Well-established global market presence in industrial and communications sectors. | Smaller scale, less global reach compared to KEYS. |
| Market Share | Significant market share in its industry segments with steady revenue growth. | Small market share, rapidly growing but still in early stages. |
Keysight offers a more diversified and globally established business with decent profitability, though it currently faces challenges in value creation. Ouster is less diversified and currently unprofitable but shows promising innovation and improving profitability trends. Investors should weigh KEYS’s stability against OUST’s growth potential and higher risk.
Risk Analysis
The table below compares key risks between Keysight Technologies, Inc. (KEYS) and Ouster, Inc. (OUST) based on the most recent data from 2025 and 2024 respectively:
| Metric | Keysight Technologies, Inc. (KEYS) | Ouster, Inc. (OUST) |
|---|---|---|
| Market Risk | Moderate (Beta 1.18) | High (Beta 2.94) |
| Debt level | Moderate (D/E 0.51) | Low (D/E 0.11) |
| Regulatory Risk | Moderate (Tech industry standard) | Moderate (Tech & lidar sensors) |
| Operational Risk | Moderate (15,400 employees) | High (292 employees, growth phase) |
| Environmental Risk | Moderate (Industry standard) | Moderate (Product impact concerns) |
| Geopolitical Risk | Moderate (Global operations) | Moderate (US-based, global market) |
In synthesis, Ouster faces higher market and operational risks due to its smaller scale, higher volatility, and unprofitable status. Keysight’s risks are more moderate but include a higher debt level and valuation concerns. The most impactful risk for investors is Ouster’s significant negative profitability and high market beta, indicating higher price volatility and financial vulnerability. Keysight, while more stable with a safe Altman Z-Score, carries valuation and competitive pressures worth monitoring closely.
Which Stock to Choose?
Keysight Technologies, Inc. (KEYS) shows a favorable income evolution with strong gross and EBIT margins and a net margin of 15.74%. Financial ratios are slightly favorable overall, supported by good liquidity and moderate debt, though valuation multiples appear high. Despite a very favorable rating (B), the company’s MOAT is very unfavorable due to declining ROIC below WACC, indicating value destruction.
Ouster, Inc. (OUST) posts a favorable income statement growth but with negative profitability metrics, including an -87.35% net margin and unfavorable returns. Financial ratios are generally unfavorable, despite low leverage and solid liquidity. The rating is very favorable (C-), but MOAT remains slightly unfavorable with improving ROIC that still lags below WACC, signaling ongoing value erosion albeit with improving profitability.
Investors seeking stability and established profitability might find Keysight’s consistent earnings and strong financial structure more aligned with their profiles, while those with a tolerance for risk and interest in rapid growth could view Ouster’s accelerating revenue and improving ROIC as indicative of potential future value. The choice could therefore depend on whether the investor prioritizes steady income and financial strength or growth potential amid higher risk.
Disclaimer: Investment carries a risk of loss of initial capital. The past performance is not a reliable indicator of future results. Be sure to understand risks before making an investment decision.
Go Further
I encourage you to read the complete analyses of Keysight Technologies, Inc. and Ouster, Inc. to enhance your investment decisions: