In the competitive landscape of technology hardware, Keysight Technologies, Inc. (KEYS) and Novanta Inc. (NOVT) stand out as innovators delivering advanced electronic and photonics solutions. Both serve overlapping industrial markets with cutting-edge products that drive communications, medical, and industrial applications. This comparison explores their market positions and innovation strategies to help you identify which company presents the most compelling investment opportunity in 2026. Let’s dive into the details to guide your portfolio decisions.
Table of contents
Companies Overview
I will begin the comparison between Keysight Technologies and Novanta by providing an overview of these two companies and their main differences.
Keysight Technologies Overview
Keysight Technologies, Inc. specializes in electronic design and test solutions across various sectors such as communications, aerospace, automotive, and semiconductor industries. Founded in 1939 and headquartered in Santa Rosa, California, Keysight operates globally with a workforce of 15.4K employees. It offers a wide range of products including electronic design automation software, oscilloscopes, and optical analyzers, serving customers through direct sales and distributors.
Novanta Overview
Novanta Inc. designs and manufactures photonics, vision, and precision motion components for medical and industrial original equipment manufacturers. Established in 1968 and based in Bedford, Massachusetts, Novanta employs approximately 3K people. The company’s product portfolio includes laser scanning systems, medical visualization technologies, and precision motion control solutions, marketed under multiple brands via direct sales, resellers, and system integrators globally.
Key similarities and differences
Both companies operate in the hardware, equipment, and parts industry within the technology sector, serving industrial and medical markets. Keysight has a broader focus on electronic test and measurement solutions, while Novanta concentrates on photonics, vision, and precision motion components. Keysight’s workforce and market capitalization are significantly larger, reflecting its extensive product range and global reach compared to Novanta’s specialized niche and smaller scale.
Income Statement Comparison
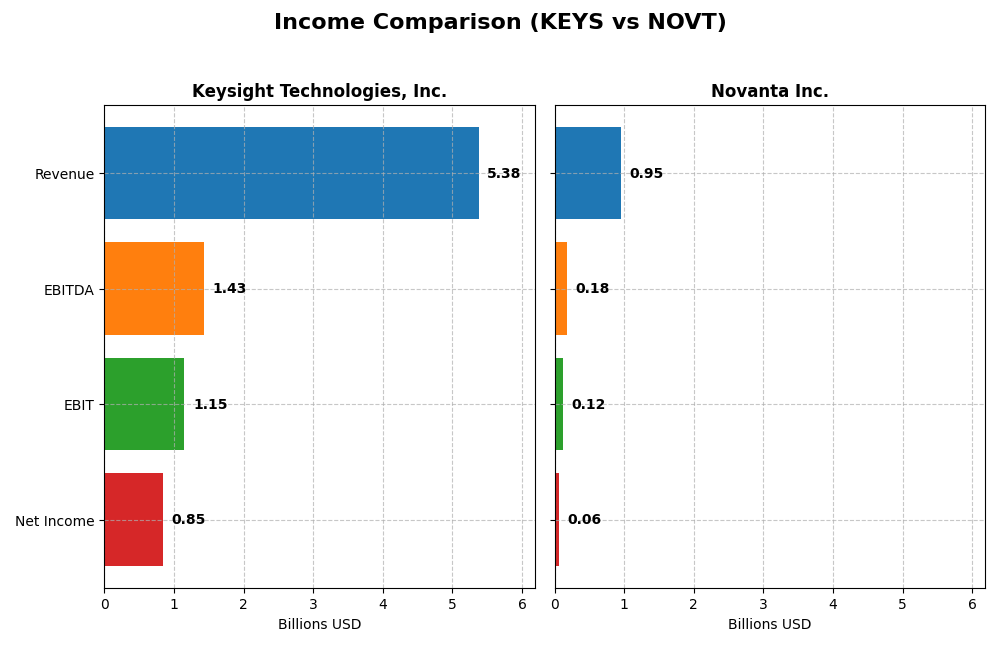
The table below presents a side-by-side comparison of the most recent fiscal year income statement metrics for Keysight Technologies, Inc. and Novanta Inc.
| Metric | Keysight Technologies, Inc. | Novanta Inc. |
|---|---|---|
| Market Cap | 36B | 4.7B |
| Revenue | 5.38B | 949M |
| EBITDA | 1.43B | 180M |
| EBIT | 1.15B | 124M |
| Net Income | 846M | 64M |
| EPS | 4.90 | 1.78 |
| Fiscal Year | 2025 | 2024 |
Income Statement Interpretations
Keysight Technologies, Inc.
Between 2021 and 2025, Keysight’s revenue showed a generally positive trend with an overall growth of 8.78%, while net income declined slightly by 5.37%. Margins remained strong, with a gross margin of 62.08% and an improving net margin reaching 15.74% in 2025. The most recent year saw a revenue growth of 7.95% and a significant 27.63% increase in net margin, reflecting improved profitability.
Novanta Inc.
Novanta experienced robust revenue growth of 60.72% from 2020 to 2024, accompanied by a net income rise of 43.95%. Margins are lower than Keysight’s but still favorable, with a gross margin of 44.41% and a net margin of 6.75% in 2024. However, the latest year showed a mixed picture: revenue rose by 7.67%, but net margin dropped by 18.32%, and earnings per share decreased by 12.38%, indicating margin pressure.
Which one has the stronger fundamentals?
Keysight demonstrates stronger profitability with higher margins and more consistent earnings quality, despite a slight net income decline overall. Novanta shows impressive top-line and net income growth over the longer term but struggles with margin compression and recent EPS declines. Both companies have favorable income statements, though Keysight’s margin stability and recent profitability gains suggest more resilient fundamentals.
Financial Ratios Comparison
Below is a comparison of key financial ratios for Keysight Technologies, Inc. (KEYS) and Novanta Inc. (NOVT) based on their most recent fiscal year data.
| Ratios | Keysight Technologies, Inc. (2025) | Novanta Inc. (2024) |
|---|---|---|
| ROE | 14.40% | 8.59% |
| ROIC | 7.98% | 7.19% |
| P/E | 37.41 | 85.70 |
| P/B | 5.39 | 7.37 |
| Current Ratio | 2.35 | 2.58 |
| Quick Ratio | 1.78 | 1.72 |
| D/E (Debt-to-Equity) | 0.51 | 0.63 |
| Debt-to-Assets | 26.31% | 33.92% |
| Interest Coverage | 9.88 | 3.51 |
| Asset Turnover | 0.48 | 0.68 |
| Fixed Asset Turnover | 5.21 | 6.08 |
| Payout Ratio | 0% | 0% |
| Dividend Yield | 0% | 0% |
Interpretation of the Ratios
Keysight Technologies, Inc.
Keysight exhibits a slightly favorable overall ratio profile with strong current and quick ratios indicating solid liquidity. Favorable net margin and interest coverage ratios support financial stability, though high PE and PB ratios suggest potential overvaluation. Asset turnover is weak, possibly indicating lower operational efficiency. The company does not pay dividends, likely reflecting reinvestment or growth focus.
Novanta Inc.
Novanta shows a slightly unfavorable ratio profile with weaker profitability metrics such as lower ROE and higher WACC, signaling challenges in generating returns. Liquidity ratios remain strong, and fixed asset turnover is favorable. High PE and PB ratios raise valuation concerns. Novanta also does not pay dividends, which may imply prioritization of reinvestment or expansion over shareholder returns.
Which one has the best ratios?
Comparing the two, Keysight presents a more balanced and slightly favorable ratio set, especially in profitability and liquidity, despite some valuation concerns. Novanta’s ratios reflect more challenges with profitability and valuation, resulting in a slightly unfavorable overall view. Thus, Keysight holds a comparative advantage in ratio strength based on the current data.
Strategic Positioning
This section compares the strategic positioning of Keysight Technologies and Novanta Inc., including market position, key segments, and exposure to technological disruption:
Keysight Technologies, Inc.
- Large market cap near 36B USD with moderate competitive pressure in hardware and test solutions
- Diverse segments: Communications Solutions and Electronic Industrial Solutions, driving revenue over 5B USD
- Exposure to technological disruption via electronic design automation, network test platforms, and optical analyzers
Novanta Inc.
- Smaller market cap about 4.7B USD, facing higher beta and competitive market in precision components
- Focused on photonics, vision, and precision motion serving medical and industrial markets, revenues around 750M USD
- Exposure through photonics-based laser and vision technologies, precision motion control, and medical grade devices
Keysight Technologies, Inc. vs Novanta Inc. Positioning
Keysight pursues a diversified strategy with broad segment coverage supporting higher revenue scale, while Novanta concentrates on specialized photonics and precision motion segments with a narrower focus and smaller scale. This yields different risk and opportunity profiles based on their market and product breadth.
Which has the best competitive advantage?
Both companies are currently shedding value as ROIC is below WACC. Keysight shows declining profitability (very unfavorable moat), whereas Novanta has a slightly unfavorable moat but with improving ROIC, indicating a modestly better competitive position.
Stock Comparison
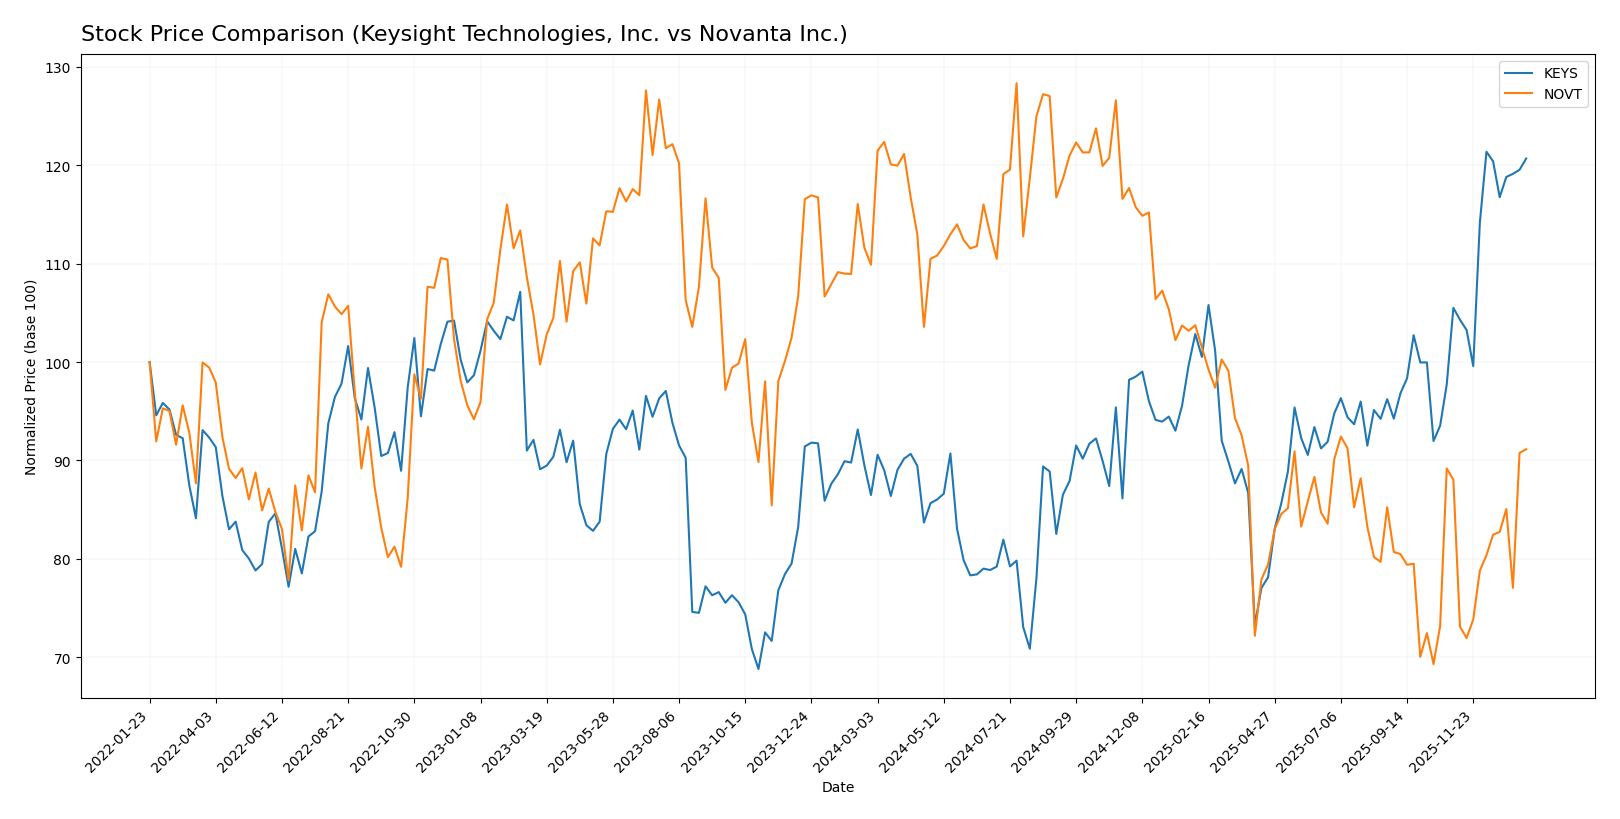
The stock price chart highlights key price movements and trading dynamics over the past 12 months, revealing a strong bullish run for Keysight Technologies, Inc., contrasted with a bearish trend and increasing volatility for Novanta Inc.
Trend Analysis
Keysight Technologies, Inc. (KEYS) experienced a 39.56% price increase over the past year, indicating a bullish trend with accelerating momentum. The stock ranged from 122.87 to 210.49, showing considerable volatility with a standard deviation of 18.51.
Novanta Inc. (NOVT) showed a 17.07% price decrease during the same period, reflecting a bearish trend with acceleration and higher volatility, demonstrated by a 25.04 standard deviation. The stock fluctuated between 99.96 and 185.16.
Comparatively, KEYS delivered the highest market performance with a strong positive trend, while NOVT’s price declined, underperforming in the last 12 months.
Target Prices
The consensus target prices for Keysight Technologies, Inc. and Novanta Inc. reflect positive analyst expectations.
| Company | Target High | Target Low | Consensus |
|---|---|---|---|
| Keysight Technologies, Inc. | 232 | 210 | 225.13 |
| Novanta Inc. | 160 | 160 | 160 |
Analysts expect Keysight’s price to rise modestly above its current 209.3 USD, while Novanta’s consensus target of 160 USD suggests significant upside from its current 131.47 USD.
Analyst Opinions Comparison
This section compares analysts’ ratings and grades for Keysight Technologies, Inc. (KEYS) and Novanta Inc. (NOVT):
Rating Comparison
KEYS Rating
- Rating: B, classified as very favorable by analysts.
- Discounted Cash Flow Score: 3, indicating a moderate valuation assessment.
- ROE Score: 4, reflecting a favorable efficiency in generating shareholder profit.
- ROA Score: 4, showing favorable asset utilization for earnings.
- Debt To Equity Score: 2, suggesting moderate financial risk.
- Overall Score: 3, categorized as moderate overall financial standing.
NOVT Rating
- Rating: C+, also marked very favorable by analysts.
- Discounted Cash Flow Score: 3, showing a moderate valuation assessment.
- ROE Score: 3, indicating moderate efficiency in generating shareholder profit.
- ROA Score: 3, showing moderate asset utilization for earnings.
- Debt To Equity Score: 1, indicating very unfavorable financial risk.
- Overall Score: 2, categorized as moderate overall financial standing.
Which one is the best rated?
Based strictly on the data, KEYS holds a higher rating (B) than NOVT (C+), accompanied by better ROE and ROA scores and a stronger debt-to-equity position, making KEYS the better-rated company overall.
Scores Comparison
Here is a comparison of the Altman Z-Score and Piotroski Score for both companies:
KEYS Scores
- Altman Z-Score: 5.94, indicating a safe zone.
- Piotroski Score: 4, classified as average.
NOVT Scores
- Altman Z-Score: 5.35, indicating a safe zone.
- Piotroski Score: 6, classified as average.
Which company has the best scores?
Both KEYS and NOVT are in the safe zone for the Altman Z-Score, indicating low bankruptcy risk. NOVT has a higher Piotroski Score, suggesting relatively stronger financial health compared to KEYS based on this measure.
Grades Comparison
Here is a comparison of the latest reliable grades assigned to Keysight Technologies, Inc. and Novanta Inc.:
Keysight Technologies, Inc. Grades
This table summarizes recent grades from reputable financial institutions for Keysight Technologies:
| Grading Company | Action | New Grade | Date |
|---|---|---|---|
| Morgan Stanley | Maintain | Equal Weight | 2025-12-17 |
| Jefferies | Maintain | Hold | 2025-12-10 |
| Baird | Maintain | Outperform | 2025-11-26 |
| Barclays | Maintain | Overweight | 2025-11-25 |
| JP Morgan | Maintain | Overweight | 2025-11-25 |
| Jefferies | Maintain | Hold | 2025-11-25 |
| Citigroup | Maintain | Buy | 2025-11-25 |
| UBS | Maintain | Buy | 2025-11-25 |
| Wells Fargo | Maintain | Overweight | 2025-11-25 |
| Susquehanna | Maintain | Positive | 2025-11-25 |
The overall trend for Keysight shows a majority of Buy and Overweight ratings, indicating positive analyst sentiment with consistent maintenance of prior grades.
Novanta Inc. Grades
This table summarizes recent grades from reputable financial institutions for Novanta Inc.:
| Grading Company | Action | New Grade | Date |
|---|---|---|---|
| Baird | Maintain | Neutral | 2025-08-11 |
| Baird | Maintain | Neutral | 2025-03-03 |
| Baird | Maintain | Neutral | 2024-11-06 |
| Baird | Maintain | Neutral | 2024-08-07 |
| Baird | Maintain | Neutral | 2023-05-11 |
| Baird | Maintain | Neutral | 2023-05-10 |
| William Blair | Upgrade | Outperform | 2022-05-11 |
| William Blair | Upgrade | Outperform | 2022-05-10 |
| Berenberg | Maintain | Hold | 2020-11-13 |
| Baird | Maintain | Neutral | 2020-05-13 |
The ratings for Novanta are predominantly Neutral, with an upgrade to Outperform noted in 2022, reflecting stable but cautious analyst views.
Which company has the best grades?
Keysight Technologies has received stronger and more positive grades, predominantly Buy and Overweight, compared to Novanta Inc.’s mostly Neutral ratings. This suggests greater analyst confidence in Keysight’s prospects, potentially impacting investor sentiment and portfolio allocation.
Strengths and Weaknesses
The table below summarizes key strengths and weaknesses of Keysight Technologies, Inc. (KEYS) and Novanta Inc. (NOVT) based on recent financial performance, market position, and innovation trends:
| Criterion | Keysight Technologies, Inc. (KEYS) | Novanta Inc. (NOVT) |
|---|---|---|
| Diversification | Moderate: Two main segments with steady revenue from Communications and Electronic Industrial Solutions | Moderate: Multiple specialized segments including Precision Manufacturing and Advanced Surgery |
| Profitability | Favorable net margin (15.74%), but declining ROIC below WACC, indicating value destruction | Moderate net margin (6.75%) with growing ROIC but still below WACC, slight value erosion |
| Innovation | Strong in measurement and communications technology, stable product evolution | Focused on robotics, automation, and precision medicine with increasing profitability trends |
| Global presence | Established global footprint with significant product sales worldwide | Growing global reach in medical and industrial automation markets |
| Market Share | Solid in communications solutions, but facing margin pressure and valuation concerns (high PE and PB ratios) | Niche market leadership in photonics and robotics, but high valuation and lower profitability |
In summary, Keysight shows stronger current profitability and a robust market position but faces challenges with declining capital efficiency and high valuation multiples. Novanta is improving profitability and innovation with a growing ROIC trend but remains less profitable overall and carries a higher valuation risk. Investors should weigh stability versus growth potential cautiously.
Risk Analysis
Below is a table summarizing key risks for Keysight Technologies, Inc. (KEYS) and Novanta Inc. (NOVT) based on the most recent data available in 2026:
| Metric | Keysight Technologies, Inc. (KEYS) | Novanta Inc. (NOVT) |
|---|---|---|
| Market Risk | Moderate (Beta 1.18) | Higher (Beta 1.60) |
| Debt level | Moderate (D/E 0.51, favorable) | Moderate-High (D/E 0.63, neutral) |
| Regulatory Risk | Moderate (Technology sector) | Moderate (Medical & Industrial sectors) |
| Operational Risk | Moderate (Complex supply chain) | Moderate (Diverse product segments) |
| Environmental Risk | Low to moderate | Low to moderate |
| Geopolitical Risk | Moderate (Global sales exposure) | Moderate (Global sales exposure) |
The most likely and impactful risks are market volatility, especially for Novanta given its higher beta, and debt-related risks. Novanta’s higher debt-to-equity ratio and weaker coverage ratios suggest more financial risk compared to Keysight. Both companies face moderate regulatory and geopolitical risks due to global operations, but neither shows alarming distress signs, supported by strong Altman Z-scores in the safe zone. Careful monitoring of market conditions and debt management is advisable.
Which Stock to Choose?
Keysight Technologies, Inc. (KEYS) shows a favorable income statement with strong gross and EBIT margins, improving net margin growth, and solid profitability ratios. Its debt level is moderate with a net debt to EBITDA of 0.77, combined with a very favorable B rating and slightly favorable financial ratios despite some valuation concerns.
Novanta Inc. (NOVT) presents a generally favorable income statement but with mixed margin growth and lower profitability metrics. Its debt is higher relative to EBITDA at nearly 2, and while it holds a very favorable C+ rating, its financial ratios are slightly unfavorable overall, reflecting valuation and leverage challenges.
Considering ratings and financials, KEYS might appear more suitable for investors seeking stable profitability and moderate leverage, while NOVT could appeal to those tolerating higher risk for growth potential amid improving ROIC trends. The choice may depend on an investor’s risk tolerance and strategic focus.
Disclaimer: Investment carries a risk of loss of initial capital. The past performance is not a reliable indicator of future results. Be sure to understand risks before making an investment decision.
Go Further
I encourage you to read the complete analyses of Keysight Technologies, Inc. and Novanta Inc. to enhance your investment decisions: