In the competitive landscape of technology hardware and equipment, Keysight Technologies, Inc. (KEYS) and MKS Inc. (MKSI) stand out as key players with significant market presence. Both companies serve critical industries such as semiconductor manufacturing and defense, leveraging innovation to drive growth. This comparison explores their strategies and market positioning to help you identify which company presents the most compelling investment opportunity in 2026. Let’s dive in to find the best fit for your portfolio.
Table of contents
Companies Overview
I will begin the comparison between Keysight Technologies and MKS Inc. by providing an overview of these two companies and their main differences.
Keysight Technologies Overview
Keysight Technologies, Inc. specializes in electronic design and test solutions, serving sectors such as communications, aerospace, defense, automotive, and semiconductors. It offers a broad range of hardware and software products including electronic design automation, radio frequency test solutions, and optical measurement tools. The company operates globally with a workforce of 15,400 employees and is headquartered in Santa Rosa, California.
MKS Inc. Overview
MKS Inc. provides instruments, systems, and process control solutions focused on manufacturing process parameters. Its product portfolio includes vacuum and pressure control, laser technologies, and photonics products, serving semiconductor, industrial, life sciences, and defense markets. Headquartered in Andover, Massachusetts, MKS employs around 10,200 people and distributes its solutions through direct and indirect sales channels worldwide.
Key similarities and differences
Both companies operate within the hardware, equipment, and parts industry, catering primarily to high-tech and industrial sectors. Keysight emphasizes electronic design and testing solutions, while MKS focuses on control systems and laser-based manufacturing equipment. Keysight has a larger market capitalization and employee base, whereas MKS provides a more diversified portfolio spanning vacuum systems and photonics, indicating complementary but distinct market approaches.
Income Statement Comparison
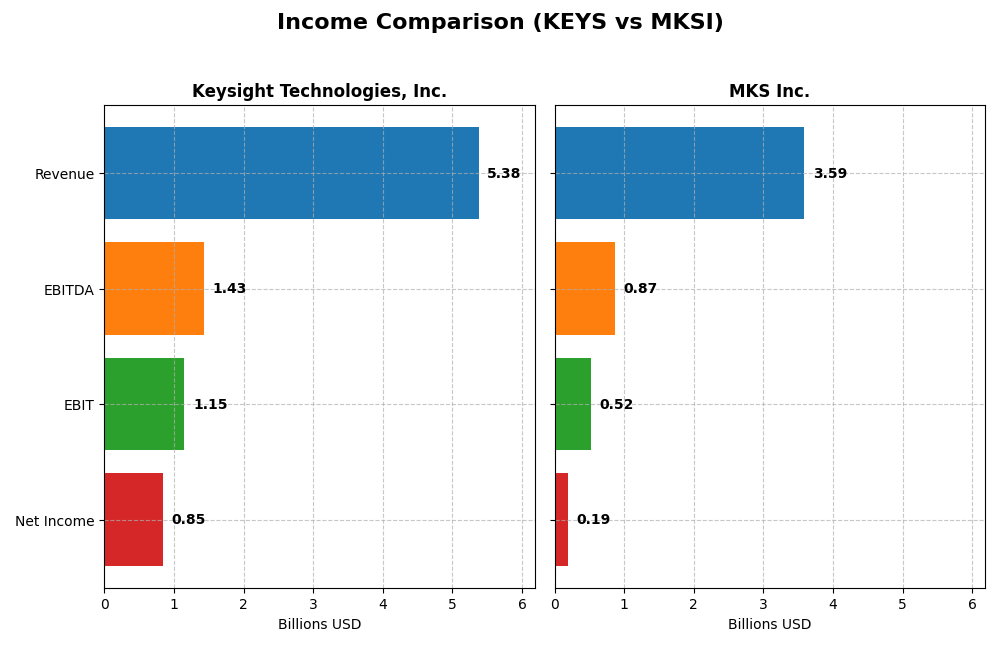
The following table compares the key income statement metrics for Keysight Technologies, Inc. and MKS Inc. for their most recent fiscal years.
| Metric | Keysight Technologies, Inc. (2025) | MKS Inc. (2024) |
|---|---|---|
| Market Cap | 36B | 13B |
| Revenue | 5.38B | 3.59B |
| EBITDA | 1.43B | 870M |
| EBIT | 1.15B | 522M |
| Net Income | 846M | 190M |
| EPS | 4.9 | 2.82 |
| Fiscal Year | 2025 | 2024 |
Income Statement Interpretations
Keysight Technologies, Inc.
Keysight’s revenue showed a generally positive trend from 2021 to 2025, rising from $4.94B to $5.38B, with a slight dip in 2023. Net income fluctuated, peaking at $1.06B in 2023 before declining to $846M in 2025. Margins remained strong, with a gross margin of 62.1% and a net margin of 15.7% in 2025. The latest year showed revenue growth slowing to 7.95%, but significant improvements in EBIT and net margin growth.
MKS Inc.
MKS experienced revenue growth overall, increasing from $2.33B in 2020 to $3.59B in 2024, despite a minor decline in the latest year. Net income was volatile, plunging to a loss of $1.84B in 2023 before rebounding to $190M in 2024. Margins improved recently, with a gross margin of 47.6% and net margin of 5.3% in 2024. The latest year showed strong EBIT and net margin growth, offsetting the prior year’s losses.
Which one has the stronger fundamentals?
Keysight demonstrates stronger fundamentals with higher and more stable margins, including a gross margin above 60% and consistent profitability. Although its net income declined overall, recent margin improvements and positive EPS growth indicate operational strength. MKS shows greater volatility with severe losses and narrower margins, though it has made some recovery recently. Overall, Keysight’s income statement reflects more favorable and stable financial performance.
Financial Ratios Comparison
Below is a comparative table of key financial ratios for Keysight Technologies, Inc. (KEYS) and MKS Inc. (MKSI) based on their most recent fiscal year data.
| Ratios | Keysight Technologies, Inc. (2025) | MKS Inc. (2024) |
|---|---|---|
| ROE | 14.40% | 8.18% |
| ROIC | 7.98% | 6.31% |
| P/E | 37.41 | 36.98 |
| P/B | 5.39 | 3.03 |
| Current Ratio | 2.35 | 3.19 |
| Quick Ratio | 1.78 | 2.04 |
| D/E (Debt-to-Equity) | 0.51 | 2.06 |
| Debt-to-Assets | 26.31% | 55.65% |
| Interest Coverage | 9.88 | 1.44 |
| Asset Turnover | 0.48 | 0.42 |
| Fixed Asset Turnover | 5.21 | 3.55 |
| Payout Ratio | 0% | 31.05% |
| Dividend Yield | 0% | 0.84% |
Interpretation of the Ratios
Keysight Technologies, Inc.
Keysight’s ratios present a mixed picture with 42.86% favorable and 28.57% unfavorable metrics, indicating a slightly favorable overall standing. Notable strengths include a solid net margin of 15.74%, strong liquidity with a current ratio of 2.35, and robust interest coverage at 11.98. However, high price-to-earnings (PE) and price-to-book (PB) ratios raise valuation concerns. The company does not pay dividends, focusing instead on reinvestment and growth strategies.
MKS Inc.
MKS shows a largely unfavorable ratio profile with 71.43% of ratios negative, reflecting financial challenges. The company has a low net margin of 5.3%, weak return on equity at 8.18%, and high debt levels, with a debt-to-equity ratio of 2.06 and low interest coverage of 1.51. Despite a small dividend yield of 0.84%, the payout may carry risks given the overall financial strain. MKS appears to prioritize operational adjustments and capital structure management.
Which one has the best ratios?
Comparing the two, Keysight holds the advantage with a larger share of favorable ratios and stronger profitability and liquidity metrics. MKS’s financial profile is weighed down by high leverage and weaker returns, reflected in its unfavorable global ratios opinion. Therefore, Keysight demonstrates a more balanced and robust ratio set versus MKS’s pronounced financial weaknesses.
Strategic Positioning
This section compares the strategic positioning of Keysight Technologies, Inc. and MKS Inc., focusing on Market position, Key segments, and exposure to disruption:
Keysight Technologies, Inc.
- Large market cap at $36B, operates in competitive hardware and equipment industry.
- Diversified key segments: Communications and Electronic Industrial Solutions driving revenues.
- Exposure to technological disruption through electronic design and test solutions across multiple industries.
MKS Inc.
- Smaller market cap of $13B, also in hardware and equipment industry facing competitive pressure.
- Concentrated segments: Vacuum & Analysis, Light & Motion, Equipment & Solutions focus on manufacturing processes.
- Exposure mainly via instruments and laser technologies impacting semiconductor and industrial markets.
Keysight Technologies, Inc. vs MKS Inc. Positioning
Keysight pursues a diversified strategy across communications and industrial electronics, offering broader market exposure but facing diverse competitive pressures. MKS is more focused on manufacturing process control and photonics, concentrating risks and opportunities within fewer segments.
Which has the best competitive advantage?
Both companies show very unfavorable MOAT evaluations with declining ROIC trends below WACC, indicating value destruction and weakening competitive advantages in their respective markets.
Stock Comparison
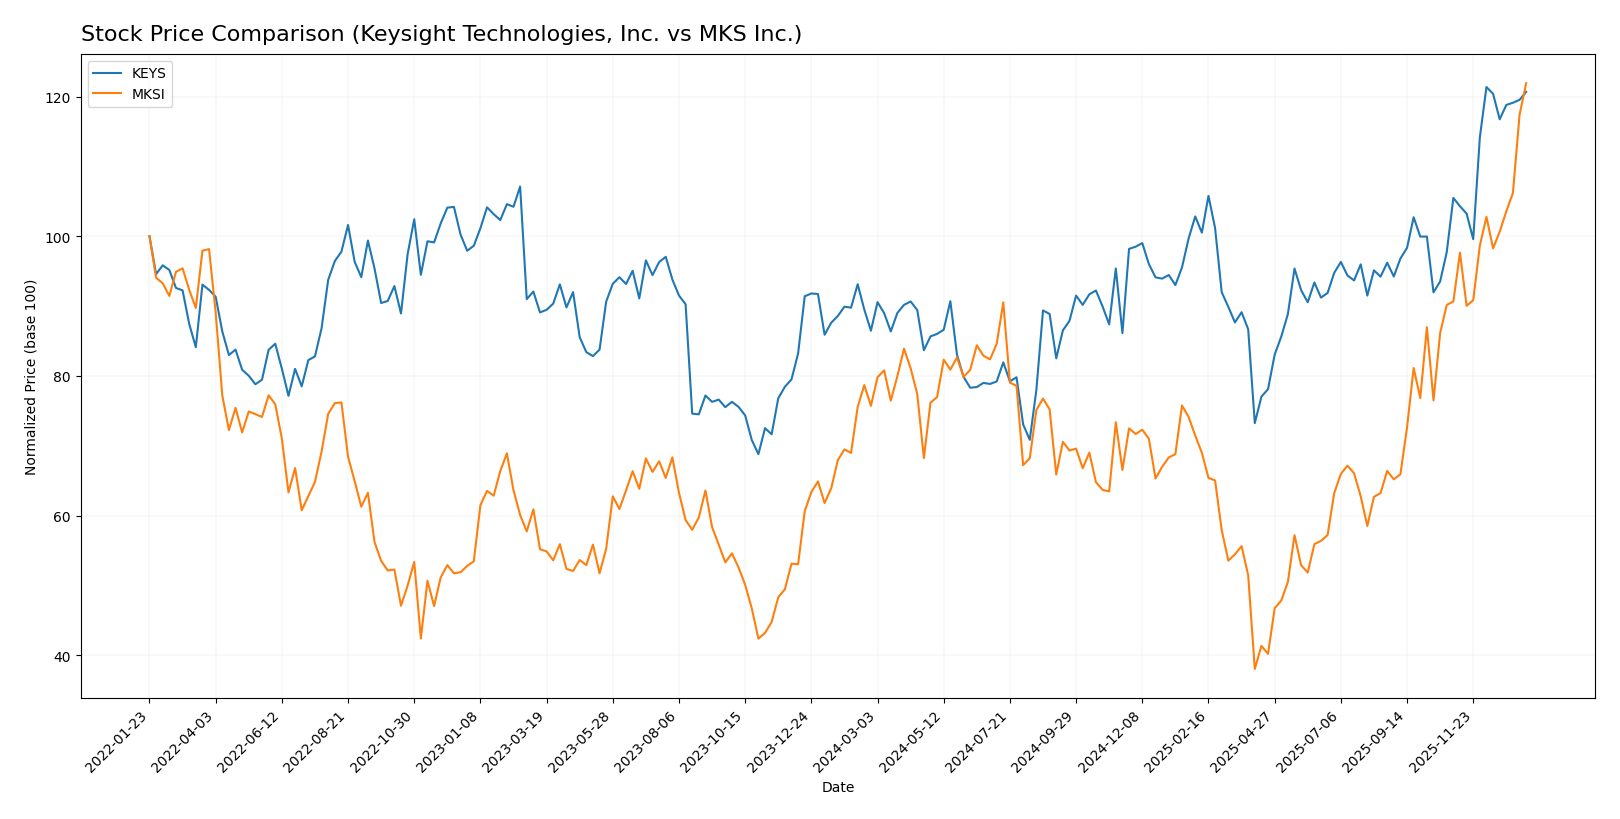
The stock prices of Keysight Technologies, Inc. and MKS Inc. have shown significant bullish momentum over the past year, with notable upward acceleration and differing volume dynamics influencing their trading activity.
Trend Analysis
Keysight Technologies, Inc. exhibited a 39.56% price increase over the past 12 months, indicating a strong bullish trend with acceleration. The stock’s price ranged from 122.87 to 210.49, with a volatility standard deviation of 18.51.
MKS Inc. outperformed with a 61.03% gain over the same period, also showing a bullish trend and acceleration. Its price fluctuated between 60.29 and 193.28, experiencing higher volatility at 24.4 standard deviation.
Comparing both stocks, MKS Inc. delivered the highest market performance with a 61.03% increase, surpassing Keysight Technologies’ 39.56% gain in the last year.
Target Prices
Analysts present a positive consensus for both Keysight Technologies, Inc. and MKS Inc., indicating potential upside from current prices.
| Company | Target High | Target Low | Consensus |
|---|---|---|---|
| Keysight Technologies, Inc. | 232 | 210 | 225.13 |
| MKS Inc. | 215 | 136 | 176.17 |
The target consensus for Keysight Technologies at 225.13 suggests a modest upside versus the current price of 209.3. MKS Inc.’s consensus target of 176.17 indicates a mixed outlook, with the current price of 193.28 above consensus, signaling possible market caution.
Analyst Opinions Comparison
This section compares analysts’ ratings and grades for Keysight Technologies, Inc. (KEYS) and MKS Inc. (MKSI):
Rating Comparison
KEYS Rating
- Rating: B, characterized as Very Favorable.
- Discounted Cash Flow Score: 3, Moderate level.
- ROE Score: 4, indicating a Favorable rating.
- ROA Score: 4, Favorable rating.
- Debt To Equity Score: 2, Moderate risk level.
- Overall Score: 3, Moderate rating.
MKSI Rating
- Rating: B-, also considered Very Favorable.
- Discounted Cash Flow Score: 3, Moderate level.
- ROE Score: 3, Moderate rating.
- ROA Score: 3, Moderate rating.
- Debt To Equity Score: 1, Very Unfavorable risk.
- Overall Score: 2, Moderate rating.
Which one is the best rated?
Based strictly on the provided data, KEYS holds a higher overall score and stronger ROE and ROA scores compared to MKSI. MKSI has a lower debt to equity score, indicating higher financial risk relative to KEYS.
Scores Comparison
Here is a comparison of the Altman Z-Score and Piotroski Score for the two companies:
KEYS Scores
- Altman Z-Score: 5.94, indicating a safe zone for bankruptcy risk.
- Piotroski Score: 4, reflecting average financial strength.
MKSI Scores
- Altman Z-Score: 2.22, placing the company in the grey zone.
- Piotroski Score: 7, indicating strong financial health.
Which company has the best scores?
KEYS shows a significantly higher Altman Z-Score, suggesting lower bankruptcy risk, while MKSI has a stronger Piotroski Score, indicating better overall financial strength according to the provided data.
Grades Comparison
Here is a detailed comparison of the latest grades and ratings for Keysight Technologies, Inc. and MKS Inc.:
Keysight Technologies, Inc. Grades
The following table summarizes recent grades from major grading companies for Keysight Technologies, Inc.:
| Grading Company | Action | New Grade | Date |
|---|---|---|---|
| Morgan Stanley | Maintain | Equal Weight | 2025-12-17 |
| Jefferies | Maintain | Hold | 2025-12-10 |
| Baird | Maintain | Outperform | 2025-11-26 |
| Barclays | Maintain | Overweight | 2025-11-25 |
| JP Morgan | Maintain | Overweight | 2025-11-25 |
| Jefferies | Maintain | Hold | 2025-11-25 |
| Citigroup | Maintain | Buy | 2025-11-25 |
| UBS | Maintain | Buy | 2025-11-25 |
| Wells Fargo | Maintain | Overweight | 2025-11-25 |
| Susquehanna | Maintain | Positive | 2025-11-25 |
Overall, the grades for Keysight Technologies show a stable and positive trend, with multiple firms maintaining Buy, Overweight, and Outperform ratings.
MKS Inc. Grades
The following table presents the recent grading actions for MKS Inc. from recognized grading companies:
| Grading Company | Action | New Grade | Date |
|---|---|---|---|
| B of A Securities | Maintain | Buy | 2026-01-13 |
| Needham | Maintain | Buy | 2026-01-13 |
| Mizuho | Maintain | Outperform | 2025-12-17 |
| Citigroup | Maintain | Buy | 2025-11-12 |
| Wells Fargo | Maintain | Equal Weight | 2025-11-07 |
| Keybanc | Maintain | Overweight | 2025-11-07 |
| Benchmark | Maintain | Buy | 2025-11-07 |
| Needham | Maintain | Buy | 2025-11-06 |
| Mizuho | Maintain | Outperform | 2025-10-16 |
| Needham | Maintain | Buy | 2025-10-13 |
The ratings for MKS Inc. also indicate a strong and consistent Buy and Outperform consensus, with some firms maintaining Overweight and Equal Weight positions.
Which company has the best grades?
Both Keysight Technologies and MKS Inc. have predominantly positive grades, with multiple Buy and Outperform ratings. MKS Inc. shows a slightly higher number of Buy and Outperform grades, whereas Keysight has more Overweight and Hold ratings. This suggests investors might view MKS Inc. with marginally stronger confidence, potentially influencing portfolio allocation preferences.
Strengths and Weaknesses
Below is a comparison table highlighting the key strengths and weaknesses of Keysight Technologies, Inc. (KEYS) and MKS Inc. (MKSI) based on recent financial and operational data.
| Criterion | Keysight Technologies, Inc. (KEYS) | MKS Inc. (MKSI) |
|---|---|---|
| Diversification | Moderate diversification with two main segments: Communications Solutions (~$3.42B in 2024) and Electronic Industrial Solutions (~$1.56B in 2024). | Less diversified, primarily focused on product sales (~$3.12B) and services (~$462M) in 2024. |
| Profitability | Higher net margin at 15.74%, neutral ROIC at 7.98%, and slightly favorable overall financial ratios. | Lower net margin at 5.3%, neutral ROIC at 6.31%, but overall unfavorable financial ratios. |
| Innovation | Strong fixed asset turnover (5.21) suggests efficient use of assets, supporting innovation capacity. | Moderate fixed asset turnover (3.55) but burdened by high debt and weaker interest coverage, limiting innovation investment. |
| Global presence | Solid global reach with consistent revenue in communications and electronics markets. | Global presence mainly through vacuum and photonics solutions but less balanced revenue streams. |
| Market Share | Sustained revenue growth in core segments but declining ROIC indicates potential market challenges. | Declining ROIC and weak profitability suggest shrinking competitive edge and value destruction. |
In summary, Keysight shows stronger profitability and better asset efficiency despite some declining returns on invested capital, while MKS faces more pronounced financial and operational challenges that may impact its long-term value creation. Investors should weigh KEYS’ moderate diversification and stable margins against MKSI’s weaker financial health and shrinking economic moat.
Risk Analysis
Below is a comparative risk table for Keysight Technologies, Inc. (KEYS) and MKS Inc. (MKSI) based on the latest available data from 2025 and 2024 respectively:
| Metric | Keysight Technologies, Inc. (KEYS) | MKS Inc. (MKSI) |
|---|---|---|
| Market Risk | Beta 1.18 – moderate market sensitivity | Beta 1.92 – higher volatility and sensitivity |
| Debt level | Debt-to-Equity 0.51 (neutral), Debt-to-Assets 26.3% (favorable) | Debt-to-Equity 2.06 (unfavorable), Debt-to-Assets 55.7% (high leverage) |
| Regulatory Risk | Moderate, operates globally in technology sector | Moderate, exposure to semiconductor and industrial sectors |
| Operational Risk | Diverse product portfolio, stable operations | Complex product lines, higher operational complexity |
| Environmental Risk | Standard industry compliance, no major concerns | Similar industrial footprint, moderate risk profile |
| Geopolitical Risk | Exposure through global markets, including Asia-Pacific | Similar geographic exposure, sensitive to global supply chains |
In synthesis, MKS Inc. faces higher financial risk due to its elevated debt levels and greater market volatility, reflected in its unfavorable debt ratios and high beta. Keysight shows better financial stability with lower leverage and a safer Altman Z-Score (5.94 vs. 2.22 for MKS), reducing bankruptcy risk. Market and geopolitical risks affect both similarly due to their global operations, but Keysight’s more favorable financial health and moderate beta suggest a lower overall risk profile. Investors should weigh MKS’s strong operational capabilities against its higher financial and market risks.
Which Stock to Choose?
Keysight Technologies, Inc. (KEYS) has shown generally favorable income growth with a 7.95% revenue increase over the past year and strong profitability metrics such as a 15.74% net margin and a 21.4% EBIT margin. Its financial ratios are slightly favorable overall, marked by strong liquidity (current ratio 2.35) and moderate debt levels (debt to equity 0.51). However, the company’s ROIC has been declining and remains below its WACC, indicating value destruction despite a very favorable rating of B.
MKS Inc. (MKSI) exhibits a mixed income evolution with a slight revenue decline last year but strong EBIT and net margin growth in the short term. Its financial ratios are mostly unfavorable, with high debt levels (debt to equity 2.06), a low interest coverage ratio (1.51), and weaker profitability metrics, although it maintains a very favorable rating of B-. The company’s ROIC also trends downward and remains well below its WACC, signaling ongoing value erosion.
Investors with a preference for moderate financial stability and consistent income growth might find Keysight Technologies’ profile more aligned with their goals given its slightly favorable financial ratios and stronger income statement performance. Conversely, those who are risk-tolerant and focused on potential high growth despite financial leverage might view MKS Inc.’s recent earnings rebound and bullish price momentum as a factor to consider. Both companies currently show signs of value destruction per MOAT analysis, which could imply caution for investors emphasizing capital preservation.
Disclaimer: Investment carries a risk of loss of initial capital. The past performance is not a reliable indicator of future results. Be sure to understand risks before making an investment decision.
Go Further
I encourage you to read the complete analyses of Keysight Technologies, Inc. and MKS Inc. to enhance your investment decisions: