In the ever-evolving technology sector, Keysight Technologies, Inc. (KEYS) and MicroVision, Inc. (MVIS) stand out as innovators in hardware and equipment. Keysight leads with comprehensive electronic test solutions across multiple industries, while MicroVision focuses on cutting-edge lidar and display technologies for automotive and augmented reality markets. This comparison will help investors identify which company holds the most promise for a balanced and forward-looking portfolio. Let’s dive into their strengths and risks.
Table of contents
Companies Overview
I will begin the comparison between Keysight Technologies and MicroVision by providing an overview of these two companies and their main differences.
Keysight Technologies Overview
Keysight Technologies, Inc. provides electronic design and test solutions across multiple industries including communications, aerospace, automotive, and semiconductors. Headquartered in Santa Rosa, California, Keysight offers a wide range of products such as electronic design automation software, test platforms, oscilloscopes, and optical analyzers. The company serves global markets with direct sales and reseller channels and employs approximately 15,400 people.
MicroVision Overview
MicroVision, Inc. develops lidar sensors and laser beam scanning technology primarily for automotive safety and autonomous driving applications. Based in Redmond, Washington, MicroVision also designs micro-display modules for augmented reality headsets and consumer lidar products for smart home systems. The company markets its products mainly to original equipment manufacturers and has a workforce of about 185 employees.
Key similarities and differences
Both companies operate in the hardware and equipment sector, focusing on advanced technology solutions. Keysight has a broad product portfolio serving diverse industries with electronic test and measurement equipment, while MicroVision specializes in lidar and laser scanning technologies for automotive and AR applications. Keysight is significantly larger in scale, with a market cap over 35B and a workforce exceeding 15K, contrasting with MicroVision’s niche focus and market cap below 300M.
Income Statement Comparison
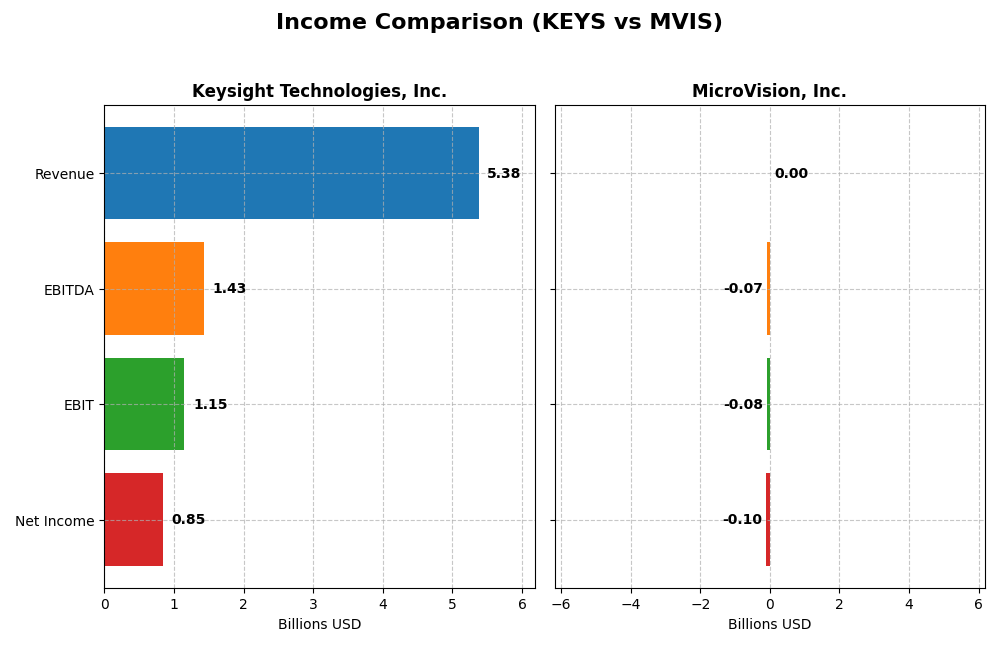
The table below presents a side-by-side comparison of key income statement metrics for the fiscal year 2025 for Keysight Technologies, Inc. and 2024 for MicroVision, Inc., illustrating their recent financial performance.
| Metric | Keysight Technologies, Inc. | MicroVision, Inc. |
|---|---|---|
| Market Cap | 36B | 291M |
| Revenue | 5.38B | 4.70M |
| EBITDA | 1.43B | -71M |
| EBIT | 1.15B | -75M |
| Net Income | 846M | -97M |
| EPS | 4.9 | -0.46 |
| Fiscal Year | 2025 | 2024 |
Income Statement Interpretations
Keysight Technologies, Inc.
Keysight Technologies experienced generally favorable revenue growth of 8.78% over 2021-2025, with a modest 7.95% increase in 2025. Net income showed a decline of 5.37% overall but improved significantly in 2025. Margins remain strong, with a gross margin of 62.08% and a net margin of 15.74%. The 2025 fiscal year saw earnings per share rise sharply by 39.03%, indicating margin improvement despite revenue growth slowing.
MicroVision, Inc.
MicroVision showed a volatile revenue trend, with a 51.97% growth over 2020-2024 but a sharp 35.31% decline in 2024. Net income deteriorated drastically by 610.83% over the period, accompanied by very negative margins, including a gross margin of -60.35% and a net margin of -2063.78%. The 2024 year confirmed unfavorable results with continuing losses, worsening margins, and a slight decrease in EPS by 2.22%.
Which one has the stronger fundamentals?
Keysight Technologies clearly demonstrates stronger fundamentals with consistent revenue growth, favorable margins, and positive EPS trends, supported by a largely favorable income statement evaluation. MicroVision, by contrast, struggles with significant losses, negative margins, and deteriorating profitability. The disparity in income statement quality decisively favors Keysight in terms of financial stability and operational efficiency.
Financial Ratios Comparison
Below is a comparative table showing the most recent financial ratios for Keysight Technologies, Inc. (KEYS) and MicroVision, Inc. (MVIS) for their latest fiscal years.
| Ratios | Keysight Technologies, Inc. (2025) | MicroVision, Inc. (2024) |
|---|---|---|
| ROE | 14.4% | -198.7% |
| ROIC | 8.0% | -83.7% |
| P/E | 37.4 | -2.83 |
| P/B | 5.39 | 5.63 |
| Current Ratio | 2.35 | 1.79 |
| Quick Ratio | 1.78 | 1.74 |
| D/E | 0.51 | 1.06 |
| Debt-to-Assets | 26.3% | 42.6% |
| Interest Coverage | 9.88 | -19.19 |
| Asset Turnover | 0.48 | 0.039 |
| Fixed Asset Turnover | 5.21 | 0.20 |
| Payout ratio | 0% | 0% |
| Dividend yield | 0% | 0% |
Interpretation of the Ratios
Keysight Technologies, Inc.
Keysight demonstrates a slightly favorable ratio profile with strong liquidity ratios (current ratio 2.35, quick ratio 1.78) and solid interest coverage at 11.98. However, valuation metrics like P/E of 37.41 and P/B of 5.39 are unfavorable. The company does not pay dividends, reflecting a possible reinvestment strategy or growth focus.
MicroVision, Inc.
MicroVision shows an overall unfavorable ratio profile, with deeply negative profitability ratios such as net margin at -2063.78% and ROE at -198.72%. Liquidity ratios are acceptable (current ratio 1.79, quick ratio 1.74), but debt levels and interest coverage are concerning. It pays no dividends, consistent with its current losses and emphasis on R&D.
Which one has the best ratios?
Based on the evaluations, Keysight holds a better overall ratio profile with more favorable liquidity and coverage ratios despite some valuation concerns. MicroVision’s ratios reveal significant financial distress and negative returns, indicating greater risk and weaker financial health in comparison.
Strategic Positioning
This section compares the strategic positioning of Keysight Technologies, Inc. and MicroVision, Inc. across Market position, Key segments, and Exposure to technological disruption:
Keysight Technologies, Inc.
- Established leader in hardware, facing competitive pressure in multiple global markets.
- Serves diverse segments: communications, aerospace, defense, automotive, energy, semiconductor, and education.
- Exposure through evolving electronic test solutions and software platforms in advanced tech sectors.
MicroVision, Inc.
- Small-cap company focused on niche lidar technology in automotive safety and AR.
- Concentrated on lidar sensors, micro-displays for AR, and scanning technology for smart devices.
- Exposure via innovative MEMS lidar and scanning tech with potential disruption in automotive and AR.
Keysight Technologies, Inc. vs MicroVision, Inc. Positioning
Keysight pursues a diversified strategy across many industries, providing scale and resilience but facing broad competition. MicroVision focuses on a concentrated niche with specialized lidar and AR tech, offering potential growth but limited scale.
Which has the best competitive advantage?
Both companies currently shed value versus cost of capital; however, MicroVision shows improving profitability trends, while Keysight’s profitability declines, indicating MicroVision’s competitive advantage may be gradually strengthening despite ongoing challenges.
Stock Comparison
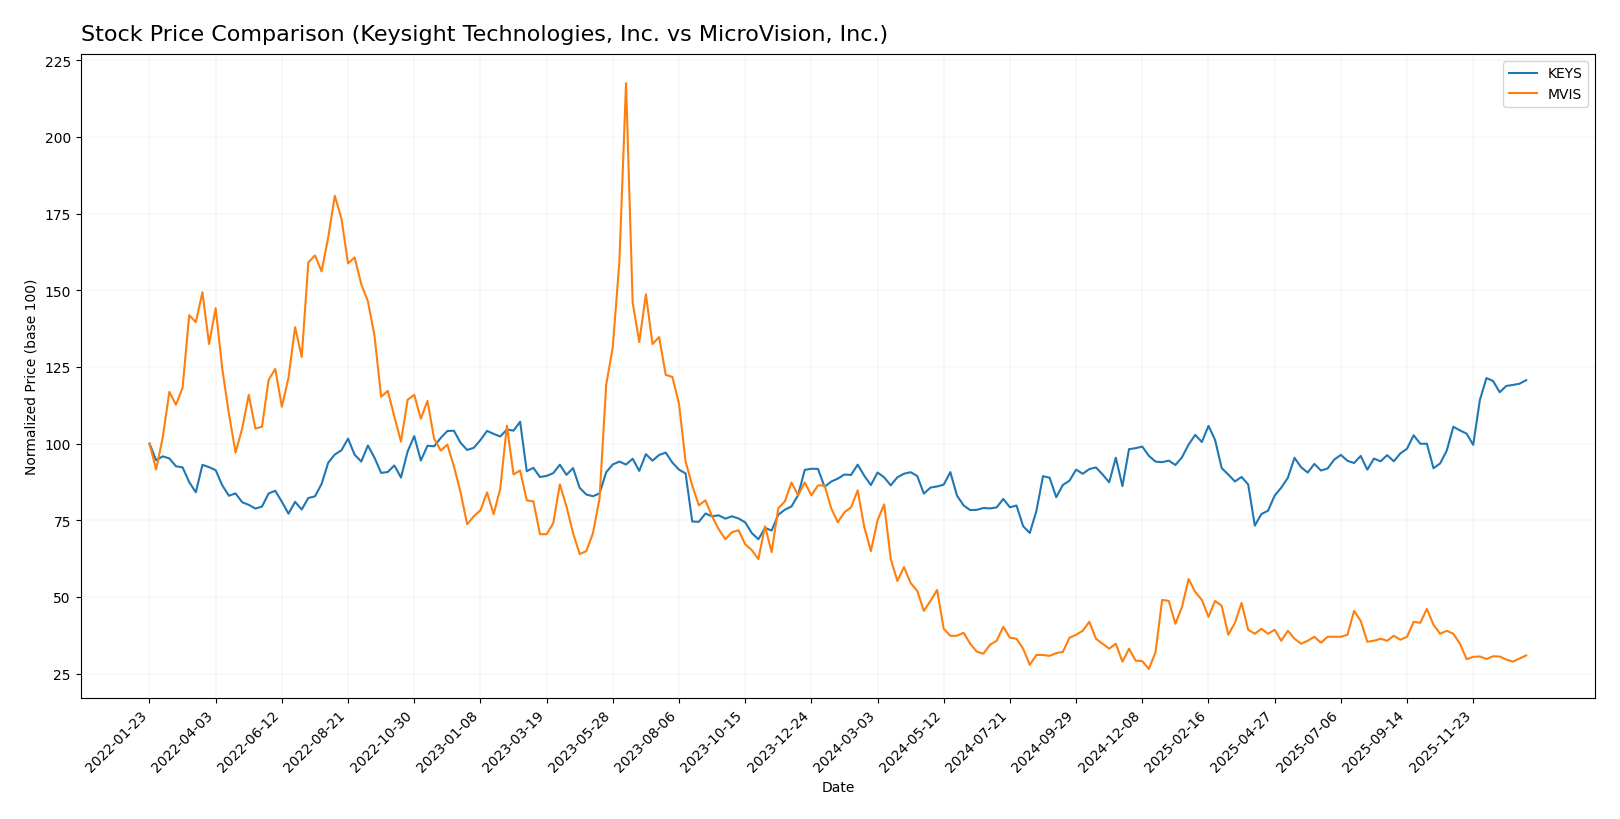
The stock price movements over the past 12 months reveal a strong bullish momentum for Keysight Technologies, Inc. (KEYS) contrasted by a sustained bearish trend with deceleration for MicroVision, Inc. (MVIS), highlighting divergent trading dynamics.
Trend Analysis
Keysight Technologies, Inc. (KEYS) showed a 39.56% price increase over the past year, indicating a bullish trend with acceleration. It experienced notable volatility with a standard deviation of 18.51 and a highest price of 210.49.
MicroVision, Inc. (MVIS) registered a -52.36% price decline over the same period, reflecting a bearish trend with deceleration. The stock showed low volatility, with a standard deviation of 0.29 and a lowest price of 0.82.
Comparing both, KEYS delivered the highest market performance with a strong upward trend, while MVIS faced significant declines and weaker momentum during the analyzed timeframe.
Target Prices
The target price consensus for Keysight Technologies, Inc. and MicroVision, Inc. reflects analyst expectations for moderate upside potential.
| Company | Target High | Target Low | Consensus |
|---|---|---|---|
| Keysight Technologies, Inc. | 232 | 210 | 225.13 |
| MicroVision, Inc. | 5 | 5 | 5 |
Analysts see Keysight’s price rising slightly above the current $209.3, indicating moderate optimism. MicroVision’s consensus target of $5 far exceeds its current price near $0.95, suggesting high expected growth but with elevated risk.
Analyst Opinions Comparison
This section compares analysts’ ratings and grades for Keysight Technologies, Inc. and MicroVision, Inc.:
Rating Comparison
Keysight Technologies, Inc. Rating
- Rating: B, indicating a very favorable overall assessment.
- Discounted Cash Flow Score: 3, moderate valuation outlook.
- ROE Score: 4, favorable efficiency in generating equity profit.
- ROA Score: 4, favorable asset utilization.
- Debt To Equity Score: 2, moderate financial risk.
- Overall Score: 3, moderate overall financial standing.
MicroVision, Inc. Rating
- Rating: C-, indicating a very unfavorable overall assessment.
- Discounted Cash Flow Score: 1, very unfavorable valuation.
- ROE Score: 1, very unfavorable efficiency in equity profit.
- ROA Score: 1, very unfavorable asset utilization.
- Debt To Equity Score: 2, moderate financial risk.
- Overall Score: 1, very unfavorable overall financial standing.
Which one is the best rated?
Based strictly on the provided data, Keysight Technologies holds a notably stronger position with a B rating and higher scores across key metrics, especially in ROE and ROA. MicroVision’s ratings and scores are significantly lower, reflecting a weaker financial profile.
Scores Comparison
Here is the comparison of the Altman Z-Score and Piotroski Score for the two companies:
Keysight Technologies, Inc. Scores
- Altman Z-Score: 5.94, in safe zone, indicating low bankruptcy risk.
- Piotroski Score: 4, average financial strength.
MicroVision, Inc. Scores
- Altman Z-Score: -6.63, in distress zone, indicating high bankruptcy risk.
- Piotroski Score: 1, very weak financial strength.
Which company has the best scores?
Based on the provided data, Keysight Technologies has significantly better scores with a safe zone Altman Z-Score and an average Piotroski Score. MicroVision’s scores indicate financial distress and very weak financial strength.
Grades Comparison
The grades comparison for Keysight Technologies, Inc. and MicroVision, Inc. is as follows:
Keysight Technologies, Inc. Grades
The following table shows recent grades assigned by reputable grading companies for Keysight Technologies, Inc.:
| Grading Company | Action | New Grade | Date |
|---|---|---|---|
| Morgan Stanley | Maintain | Equal Weight | 2025-12-17 |
| Jefferies | Maintain | Hold | 2025-12-10 |
| Baird | Maintain | Outperform | 2025-11-26 |
| Barclays | Maintain | Overweight | 2025-11-25 |
| JP Morgan | Maintain | Overweight | 2025-11-25 |
| Jefferies | Maintain | Hold | 2025-11-25 |
| Citigroup | Maintain | Buy | 2025-11-25 |
| UBS | Maintain | Buy | 2025-11-25 |
| Wells Fargo | Maintain | Overweight | 2025-11-25 |
| Susquehanna | Maintain | Positive | 2025-11-25 |
Overall, the grades for Keysight Technologies tend to cluster around buy and overweight ratings, with some hold and equal weight opinions, indicating cautious optimism.
MicroVision, Inc. Grades
The following table shows recent grades assigned by known grading firms for MicroVision, Inc.:
| Grading Company | Action | New Grade | Date |
|---|---|---|---|
| D. Boral Capital | Maintain | Buy | 2025-12-16 |
| D. Boral Capital | Maintain | Buy | 2025-11-12 |
| WestPark Capital | Maintain | Buy | 2025-10-21 |
| WestPark Capital | Maintain | Buy | 2025-09-05 |
| D. Boral Capital | Maintain | Buy | 2025-09-02 |
| WestPark Capital | Maintain | Buy | 2025-08-27 |
| D. Boral Capital | Maintain | Buy | 2025-08-11 |
| D. Boral Capital | Maintain | Buy | 2025-05-21 |
| D. Boral Capital | Maintain | Buy | 2025-05-13 |
| WestPark Capital | Maintain | Buy | 2025-03-27 |
The grades for MicroVision, Inc. are consistently “Buy,” reflecting a strong positive consensus from these grading companies.
Which company has the best grades?
MicroVision, Inc. has received consistently strong “Buy” ratings from its grading firms, while Keysight Technologies shows a mix of “Buy,” “Overweight,” and some more neutral ratings like “Hold” and “Equal Weight.” This difference may influence investors by indicating a stronger bullish sentiment for MicroVision, whereas Keysight’s grades suggest a more balanced outlook with some caution.
Strengths and Weaknesses
Below is a comparison of key strengths and weaknesses for Keysight Technologies, Inc. (KEYS) and MicroVision, Inc. (MVIS) based on recent financial and operational data.
| Criterion | Keysight Technologies, Inc. (KEYS) | MicroVision, Inc. (MVIS) |
|---|---|---|
| Diversification | Strong diversification with Communications and Electronic Industrial segments generating multi-billion revenues | Limited diversification; revenue mainly from licenses and product sales, smaller scale |
| Profitability | Positive net margin (15.74%), neutral ROIC (7.98%), but high P/E (37.41) and P/B (5.39) ratios | Negative net margin (-2063.78%), unfavorable ROIC (-83.73%), but low P/E (-2.83) due to losses |
| Innovation | Established leader investing in advanced electronic measurement solutions | Focused on emerging technology with growing ROIC trend, but still value destroying |
| Global presence | Significant global footprint with large customer base in multiple sectors | Smaller, niche market presence with limited global reach |
| Market Share | Large market share in test and measurement equipment industry | Small market share in laser scanning and sensing technology |
Keysight demonstrates strong diversification and solid profitability with a stable global presence, though its valuation metrics suggest caution. MicroVision shows potential with improving ROIC but remains unprofitable and less diversified, posing higher investment risk.
Risk Analysis
Below is a comparison of key risks for Keysight Technologies, Inc. (KEYS) and MicroVision, Inc. (MVIS) based on the latest data from 2025 and 2024 respectively:
| Metric | Keysight Technologies, Inc. (KEYS) | MicroVision, Inc. (MVIS) |
|---|---|---|
| Market Risk | Beta 1.18, moderate volatility | Beta 1.27, slightly higher volatility |
| Debt level | Debt/Equity 0.51, moderate leverage | Debt/Equity 1.06, high leverage |
| Regulatory Risk | Moderate, industry compliance needed | Elevated, emerging tech with regulatory scrutiny |
| Operational Risk | Low to moderate, stable operations | High, due to early-stage tech and limited scale |
| Environmental Risk | Moderate, typical for hardware sector | Moderate, emerging production processes |
| Geopolitical Risk | Moderate, global supply chain exposure | Moderate, US-based with global customers |
The most impactful risks for MVIS are its high leverage and poor profitability, indicating financial distress and operational challenges. KEYS shows moderate market and regulatory risks but benefits from solid financial health and a safer bankruptcy risk profile. Investors should weigh MVIS’s high-risk profile against its innovation potential, while KEYS offers more stability with moderate risks.
Which Stock to Choose?
Keysight Technologies, Inc. shows a generally favorable income evolution with strong gross and EBIT margins, improving profitability, and manageable debt levels. Its financial ratios are slightly favorable overall, supported by solid current and quick ratios, though some valuation multiples appear stretched. The company holds a very favorable rating and exhibits a safe zone Altman Z-Score with average Piotroski strength, despite a very unfavorable MOAT due to declining ROIC versus WACC.
MicroVision, Inc. presents an unfavorable income statement marked by significant net losses and negative margins, alongside deteriorating profitability and high debt relative to equity. Its financial ratios evaluation is unfavorable, with weak asset turnover and interest coverage, though it maintains a very favorable overall rating. The firm is in financial distress per Altman Z-Score and has a very weak Piotroski score, while showing a slightly unfavorable MOAT but a growing ROIC trend.
For investors, Keysight’s profile might appear more suitable for those emphasizing stable profitability and financial strength, despite some valuation concerns and value destruction signals. MicroVision’s metrics could be interpreted as fitting for risk-tolerant investors focused on potential turnaround stories, given its worsening financials but improving ROIC trend. The choice may depend on the investor’s risk appetite and investment strategy preference.
Disclaimer: Investment carries a risk of loss of initial capital. The past performance is not a reliable indicator of future results. Be sure to understand risks before making an investment decision.
Go Further
I encourage you to read the complete analyses of Keysight Technologies, Inc. and MicroVision, Inc. to enhance your investment decisions: