In the competitive landscape of hardware and equipment technology, Keysight Technologies, Inc. (KEYS) and Mesa Laboratories, Inc. (MLAB) stand out as notable players. Both companies operate in overlapping markets, providing specialized testing and measurement solutions, yet they pursue distinct innovation strategies to address diverse industry needs. This article will explore their strengths and challenges to identify which company presents the most compelling opportunity for investors in 2026.
Table of contents
Companies Overview
I will begin the comparison between Keysight Technologies and Mesa Laboratories by providing an overview of these two companies and their main differences.
Keysight Technologies Overview
Keysight Technologies, Inc. specializes in electronic design and test solutions serving industries such as communications, aerospace, defense, automotive, semiconductor, and education. Headquartered in Santa Rosa, California, Keysight offers a broad portfolio including EDA software, radio frequency test equipment, oscilloscopes, and optical analyzers. The company supports customers globally through direct sales, distributors, and representatives, emphasizing advanced hardware and software platforms.
Mesa Laboratories Overview
Mesa Laboratories, Inc. focuses on developing and manufacturing life sciences tools and quality control products for sterilization, biopharmaceutical development, calibration, and clinical genomics. Based in Lakewood, Colorado, Mesa serves healthcare, pharmaceutical, and research sectors worldwide with products like biological indicators, automated protein analysis systems, calibration devices, and genetic testing tools. The company integrates testing services primarily targeting medical and laboratory environments.
Key similarities and differences
Both companies operate in the technology sector within the hardware, equipment, and parts industry, addressing specialized testing and measurement needs. Keysight has a larger scale presence with a diverse portfolio focused on electronic design and communications, while Mesa concentrates on life sciences and healthcare-related testing solutions. Keysight’s market cap stands near 36B USD with broader industrial applications, contrasting with Mesa’s niche focus and market cap of about 466M USD.
Income Statement Comparison
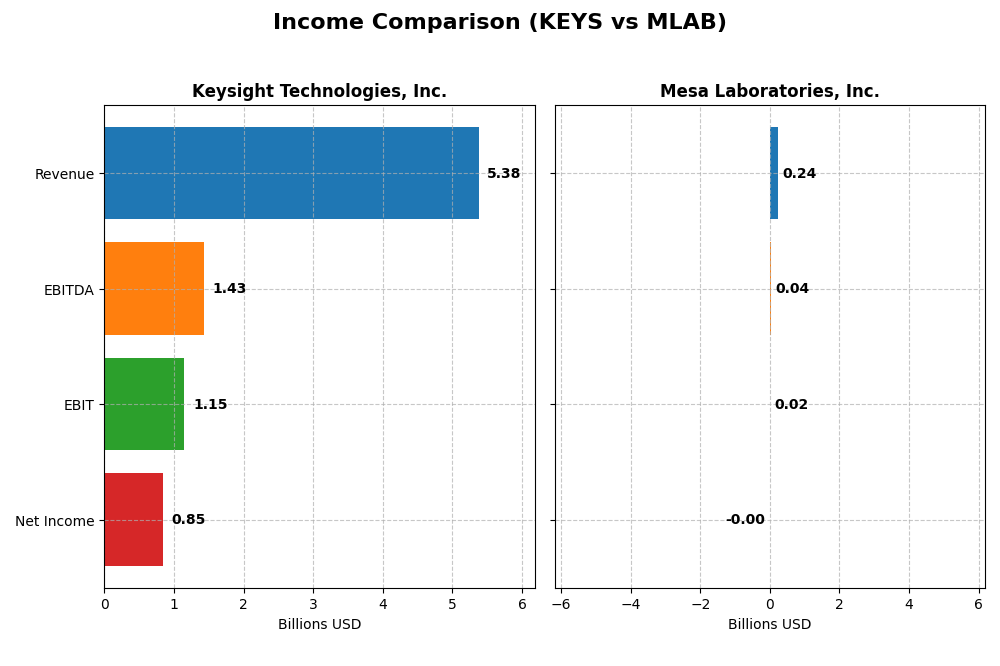
This table compares key income statement metrics for Keysight Technologies, Inc. and Mesa Laboratories, Inc. for their most recent fiscal years, reflecting their financial performance.
| Metric | Keysight Technologies, Inc. | Mesa Laboratories, Inc. |
|---|---|---|
| Market Cap | 36B | 466M |
| Revenue | 5.38B | 241M |
| EBITDA | 1.43B | 42M |
| EBIT | 1.15B | 18M |
| Net Income | 846M | -2M |
| EPS | 4.90 | -0.36 |
| Fiscal Year | 2025 | 2025 |
Income Statement Interpretations
Keysight Technologies, Inc.
Keysight’s revenue showed moderate growth from 2021 to 2025, peaking at $5.37B in 2025. Net income fluctuated, declining overall by 5.37% for the period, ending at $846M in 2025. Margins remain strong, with a favorable gross margin of 62.08% and net margin of 15.74%. The latest year saw margin improvements and a modest 7.95% revenue growth, signaling stable profitability.
Mesa Laboratories, Inc.
Mesa’s revenue increased significantly by nearly 80% over the period, reaching $241M in 2025. However, net income declined sharply by 160%, resulting in a net loss of $2M in 2025. While gross margin held favorably at 62.61%, the net margin was negative at -0.82%. The recent year showed improved EBIT and net margin growth, yet profitability remains a challenge.
Which one has the stronger fundamentals?
Keysight exhibits stronger fundamentals with consistently favorable margins, solid revenue growth, and overall positive income statement evaluations. Despite a slight net income decline over five years, its profitable operations and margin improvements suggest resilience. Mesa’s high revenue growth contrasts with ongoing net losses and negative margins, indicating weaker profitability fundamentals despite some recent positive trends.
Financial Ratios Comparison
The table below presents a side-by-side comparison of key financial ratios for Keysight Technologies, Inc. (KEYS) and Mesa Laboratories, Inc. (MLAB) based on their most recent fiscal year data.
| Ratios | Keysight Technologies, Inc. (2025) | Mesa Laboratories, Inc. (2025) |
|---|---|---|
| ROE | 14.40% | -1.24% |
| ROIC | 7.98% | -1.45% |
| P/E | 37.41 | -326.35 |
| P/B | 5.39 | 4.03 |
| Current Ratio | 2.35 | 0.63 |
| Quick Ratio | 1.78 | 0.47 |
| D/E (Debt-to-Equity) | 0.51 | 1.14 |
| Debt-to-Assets | 26.31% | 41.88% |
| Interest Coverage | 9.88 | 1.38 |
| Asset Turnover | 0.48 | 0.56 |
| Fixed Asset Turnover | 5.21 | 7.45 |
| Payout ratio | 0.00% | -175.68% |
| Dividend yield | 0.00% | 0.54% |
Interpretation of the Ratios
Keysight Technologies, Inc.
Keysight shows a slightly favorable profile with strong liquidity ratios (current ratio 2.35, quick ratio 1.78) and solid interest coverage (11.98). Profitability is decent with a net margin of 15.74%, though valuation metrics like P/E (37.41) and P/B (5.39) are unfavorable. The company does not pay dividends, focusing on reinvestment and growth.
Mesa Laboratories, Inc.
Mesa has an unfavorable ratios profile, marked by negative profitability metrics such as net margin (-0.82%) and return on equity (-1.24%). Liquidity ratios are weak (current ratio 0.63, quick ratio 0.47), and debt levels are high (D/E 1.14). It pays a small dividend yield of 0.54%, but this appears unsustainable given the negative earnings and coverage ratios.
Which one has the best ratios?
Keysight’s ratios are generally stronger and more balanced, with favorable liquidity and profitability despite high valuation multiples. Mesa’s financials are more concerning, with persistent losses, weak liquidity, and higher leverage, resulting in an unfavorable overall ratios evaluation.
Strategic Positioning
This section compares the strategic positioning of Keysight Technologies and Mesa Laboratories, focusing on market position, key segments, and exposure to technological disruption:
Keysight Technologies
- Large market cap of 36B in hardware, facing competitive pressure in tech equipment sector
- Key segments: Communications Solutions (3.42B), Electronic Industrial Solutions (1.56B)
- Exposure to disruption through evolving electronic design and testing technologies
Mesa Laboratories
- Smaller market cap of 466M, niche presence in life sciences tools and quality control
- Key segments: Sterilization & Disinfection, Biopharmaceutical Development, Calibration, Clinical Genomics
- Exposure to disruption linked to advances in genomics and biopharma automation
Keysight Technologies vs Mesa Laboratories Positioning
Keysight operates with a diversified portfolio across communications and industrial electronics, enabling broad market reach. Mesa focuses on specialized life sciences and calibration products, offering concentrated expertise. Keysight’s scale contrasts with Mesa’s niche specialization, reflecting different strategic scopes.
Which has the best competitive advantage?
Both companies show very unfavorable MOAT evaluations with declining ROIC and value destruction. Neither currently demonstrates a sustainable competitive advantage based on ROIC versus WACC trends.
Stock Comparison
The stock price movements of Keysight Technologies, Inc. and Mesa Laboratories, Inc. over the past year reveal contrasting trends, with significant price fluctuations and evolving trading volumes shaping their market dynamics.
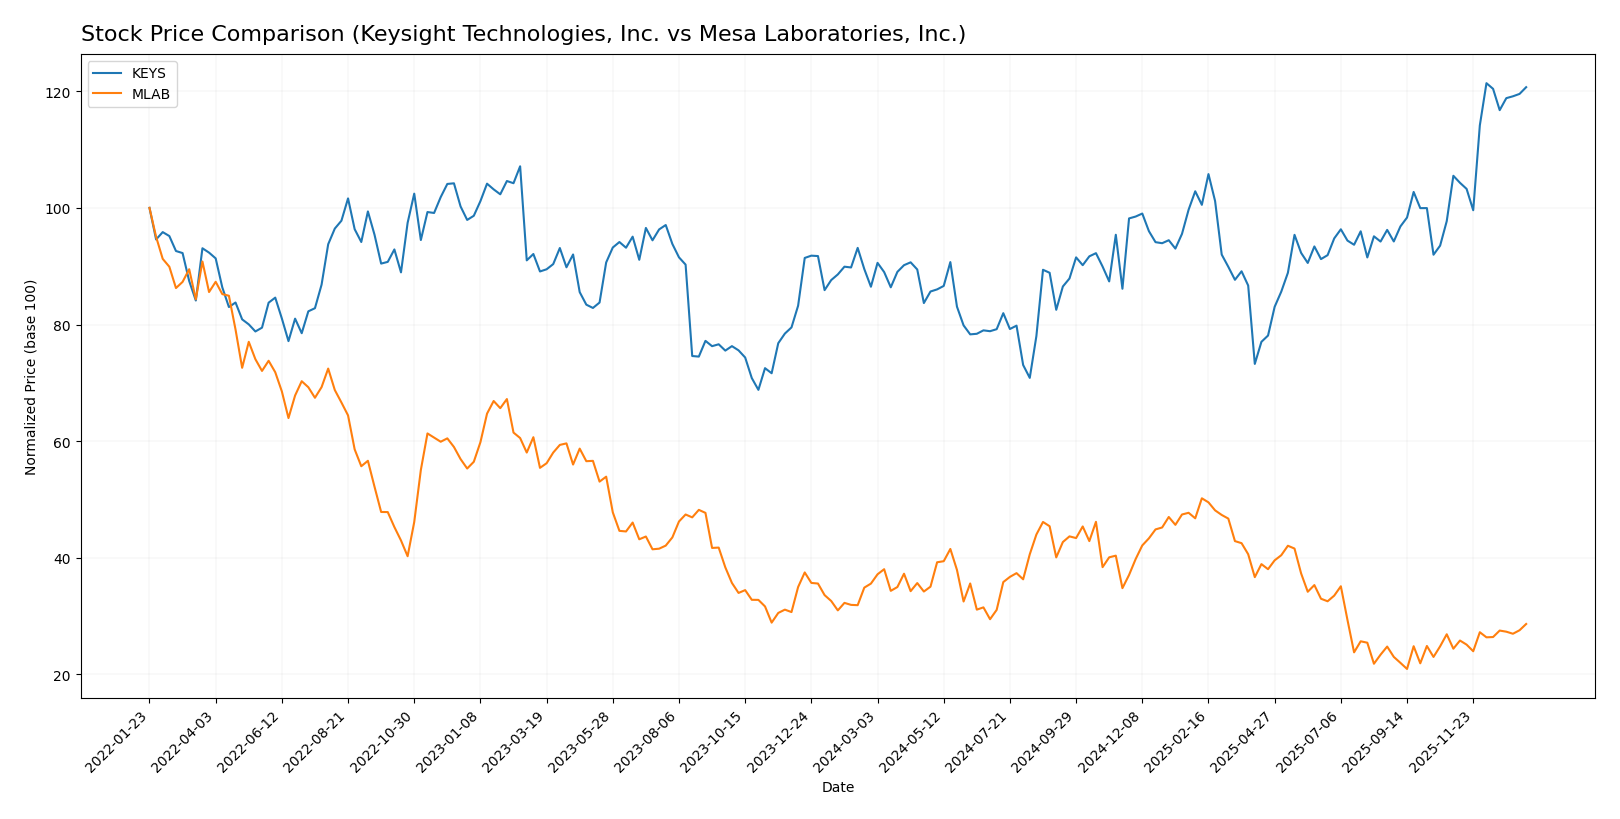
Trend Analysis
Keysight Technologies, Inc. demonstrated a bullish trend over the past 12 months, with a 39.56% price increase and accelerating momentum. The stock showed notable volatility, ranging from 122.87 to 210.49, supported by a standard deviation of 18.51.
Mesa Laboratories, Inc. exhibited a bearish trend with a 19.46% price decline over the same period, despite acceleration. The stock ranged between 61.66 and 147.79, showing higher volatility with a standard deviation of 23.27.
Comparing the two, Keysight Technologies clearly outperformed Mesa Laboratories in market returns over the past year, delivering the highest price appreciation amid diverging trend directions.
Target Prices
Analysts present a clear target price consensus for Keysight Technologies, Inc. and Mesa Laboratories, Inc.
| Company | Target High | Target Low | Consensus |
|---|---|---|---|
| Keysight Technologies, Inc. | 232 | 210 | 225.13 |
| Mesa Laboratories, Inc. | 83 | 83 | 83 |
The consensus target for Keysight is above its current price of 209.3 USD, suggesting moderate upside potential. Mesa Laboratories’ target is slightly below its current price of 84.36 USD, indicating a neutral to cautious outlook.
Analyst Opinions Comparison
This section compares analysts’ ratings and grades for Keysight Technologies, Inc. and Mesa Laboratories, Inc.:
Rating Comparison
KEYS Rating
- Rating: B, considered very favorable overall.
- Discounted Cash Flow Score: Moderate valuation indicator with a score of 3.
- ROE Score: Favorable efficiency in generating profit with a score of 4.
- ROA Score: Favorable asset utilization, scored 4.
- Debt To Equity Score: Moderate financial risk with a score of 2.
- Overall Score: Moderate overall financial standing with a 3 score.
MLAB Rating
- Rating: C+, also considered very favorable overall.
- Discounted Cash Flow Score: Very favorable valuation with a high score of 5.
- ROE Score: Very unfavorable at 1, indicating low profit generation from shareholders’ equity.
- ROA Score: Very unfavorable at 1, showing poor asset effectiveness.
- Debt To Equity Score: Very unfavorable at 1, indicating higher financial risk.
- Overall Score: Moderate overall financial standing with a 2 score.
Which one is the best rated?
Based strictly on the data, KEYS holds a higher rating (B vs. C+) and stronger scores in ROE, ROA, and debt management, while MLAB excels only in discounted cash flow valuation. Overall, KEYS is better rated.
Scores Comparison
The following table compares the Altman Z-Score and Piotroski Score of Keysight Technologies, Inc. and Mesa Laboratories, Inc.:
Keys Scores
- Altman Z-Score: 5.94, indicating a safe zone and low bankruptcy risk.
- Piotroski Score: 4, reflecting average financial strength.
MLAB Scores
- Altman Z-Score: 1.36, indicating distress zone and high bankruptcy risk.
- Piotroski Score: 5, reflecting average financial strength.
Which company has the best scores?
Keys has a significantly higher Altman Z-Score, placing it in the safe zone versus MLAB’s distress zone. Piotroski Scores are close, both in the average range, with MLAB slightly higher. Overall, Keys shows stronger financial stability by Altman’s metric.
Grades Comparison
Here is a detailed comparison of the latest grades assigned to Keysight Technologies, Inc. and Mesa Laboratories, Inc.:
Keysight Technologies, Inc. Grades
The following table summarizes recent grades from verified grading companies for Keysight Technologies, Inc.:
| Grading Company | Action | New Grade | Date |
|---|---|---|---|
| Morgan Stanley | Maintain | Equal Weight | 2025-12-17 |
| Jefferies | Maintain | Hold | 2025-12-10 |
| Baird | Maintain | Outperform | 2025-11-26 |
| Barclays | Maintain | Overweight | 2025-11-25 |
| JP Morgan | Maintain | Overweight | 2025-11-25 |
| Jefferies | Maintain | Hold | 2025-11-25 |
| Citigroup | Maintain | Buy | 2025-11-25 |
| UBS | Maintain | Buy | 2025-11-25 |
| Wells Fargo | Maintain | Overweight | 2025-11-25 |
| Susquehanna | Maintain | Positive | 2025-11-25 |
Keysight Technologies shows a predominantly positive trend with multiple “Buy,” “Overweight,” and “Outperform” ratings, indicating broad analyst confidence.
Mesa Laboratories, Inc. Grades
The following table summarizes recent grades from verified grading companies for Mesa Laboratories, Inc.:
| Grading Company | Action | New Grade | Date |
|---|---|---|---|
| Wells Fargo | Maintain | Equal Weight | 2025-12-15 |
| Wells Fargo | Upgrade | Equal Weight | 2025-08-08 |
| Wells Fargo | Maintain | Underweight | 2025-05-30 |
| Evercore ISI Group | Maintain | Outperform | 2024-10-01 |
| Evercore ISI Group | Maintain | Outperform | 2024-08-06 |
| Evercore ISI Group | Maintain | Outperform | 2024-07-02 |
| Evercore ISI Group | Maintain | Outperform | 2024-04-04 |
| Evercore ISI Group | Upgrade | Outperform | 2024-01-04 |
| Evercore ISI Group | Downgrade | In Line | 2021-01-04 |
| Evercore ISI Group | Downgrade | In Line | 2021-01-03 |
Mesa Laboratories’ ratings are mixed, with earlier downgrades to “In Line,” more recent upgrades to “Outperform,” and a current “Equal Weight” from Wells Fargo, reflecting moderate analyst sentiment.
Which company has the best grades?
Keysight Technologies, Inc. holds stronger and more consistent positive grades, including multiple “Buy” and “Overweight” ratings, while Mesa Laboratories, Inc. presents a more varied picture with a consensus at “Hold.” This suggests that Keysight may be viewed as having better growth prospects or stability by analysts, potentially influencing investor confidence accordingly.
Strengths and Weaknesses
Below is a comparative table highlighting the strengths and weaknesses of Keysight Technologies, Inc. (KEYS) and Mesa Laboratories, Inc. (MLAB) based on their recent financial performance, market position, and operational metrics.
| Criterion | Keysight Technologies, Inc. (KEYS) | Mesa Laboratories, Inc. (MLAB) |
|---|---|---|
| Diversification | Strong diversification with two main segments: Communications Solutions ($3.42B in 2024) and Electronic Industrial Solutions ($1.56B in 2024). | Moderate diversification with products and services in biopharmaceutical and calibration solutions, but smaller revenue scale ($198M product & $43M service in 2025). |
| Profitability | Favorable net margin (15.74%), neutral ROIC (7.98%) close to WACC (8.84%), showing stable profitability but limited value creation. | Unfavorable net margin (-0.82%) and ROIC (-1.45%) below WACC (6.6%), indicating value destruction and weak profitability. |
| Innovation | Moderate asset turnover (0.48) but strong fixed asset turnover (5.21), supporting efficient use of assets in innovation-driven markets. | Higher fixed asset turnover (7.45) but overall low profitability suggests innovation investments may not be paying off yet. |
| Global presence | Established global presence reflected in large revenues and stable operations across sectors. | Smaller scale and likely more regional focus with limited global footprint. |
| Market Share | Large market share in test and measurement industry with revenues exceeding $5B. | Niche market presence with revenues under $250M and modest growth prospects. |
Key takeaway: Keysight Technologies exhibits stronger diversification, profitability, and scale, though its ROIC slightly trails WACC, signaling caution. Mesa Laboratories struggles with profitability and value creation despite operational efficiency in fixed assets, making it a riskier choice for investors.
Risk Analysis
Below is a comparative table of key risks for Keysight Technologies, Inc. (KEYS) and Mesa Laboratories, Inc. (MLAB) based on the most recent 2025 data:
| Metric | Keysight Technologies, Inc. (KEYS) | Mesa Laboratories, Inc. (MLAB) |
|---|---|---|
| Market Risk | Moderate (Beta 1.18, tech sector volatility) | Lower (Beta 0.89, niche markets) |
| Debt Level | Moderate (Debt/Equity 0.51, manageable) | High (Debt/Equity 1.14, financial strain) |
| Regulatory Risk | Moderate (Global tech compliance requirements) | Moderate (Medical and pharma regulations) |
| Operational Risk | Moderate (Complex product lines, global supply chain) | Moderate (Specialized manufacturing risks) |
| Environmental Risk | Low (Tech hardware with standard compliance) | Low (Lab equipment, minimal emissions) |
| Geopolitical Risk | Moderate (Global sales exposure, supply chain) | Moderate (International markets presence) |
The most likely and impactful risks are market volatility and debt levels. Keysight shows solid financial stability with favorable liquidity and interest coverage, reducing bankruptcy risk (Altman Z-Score 5.94, safe zone). Mesa Laboratories faces higher financial distress risk (Altman Z-Score 1.36, distress zone) due to negative profitability and high debt, increasing vulnerability to market and operational shocks. Investors should weigh these risks carefully when considering these stocks.
Which Stock to Choose?
Keysight Technologies, Inc. (KEYS) shows steady income growth with a 7.95% revenue increase last year and favorable profitability metrics, including a 15.74% net margin. Its financial ratios are slightly favorable overall, supported by strong liquidity and moderate debt levels. The company holds a very favorable B rating despite a declining ROIC trend indicating value erosion.
Mesa Laboratories, Inc. (MLAB) demonstrates higher revenue growth at 11.47% last year but reports negative net margins and profitability ratios. Its financial ratios appear unfavorable, with significant leverage and liquidity concerns. The rating is very favorable C+ mainly due to a strong discounted cash flow score, yet its ROIC trend is also declining, signaling value destruction.
For investors prioritizing financial stability and profitability, Keysight’s strong income statement and favorable ratios might appear more attractive, while those focused on growth potential might be interested in Mesa’s revenue expansion despite its challenges. Both companies exhibit declining ROIC trends, implying caution regarding value creation.
Disclaimer: Investment carries a risk of loss of initial capital. The past performance is not a reliable indicator of future results. Be sure to understand risks before making an investment decision.
Go Further
I encourage you to read the complete analyses of Keysight Technologies, Inc. and Mesa Laboratories, Inc. to enhance your investment decisions: