Home > Comparison > Financial Services > USB vs KEY
The strategic rivalry between U.S. Bancorp and KeyCorp defines the current trajectory of regional banking in the U.S. U.S. Bancorp operates as a diversified financial services giant with extensive commercial and wealth management operations. KeyCorp focuses on retail and commercial banking with a strong regional emphasis and streamlined branches. This analysis will assess which business model delivers superior risk-adjusted returns, guiding investors aiming to optimize portfolio exposure to the financial services sector.

Table of contents
Companies Overview
U.S. Bancorp and KeyCorp both play pivotal roles in the U.S. regional banking sector, commanding significant market footprints.
U.S. Bancorp: Diversified Financial Services Powerhouse
U.S. Bancorp stands as a leading financial services holding company with a broad portfolio spanning corporate banking, wealth management, and payment services. It generates revenue through diversified banking products including lending, deposit accounts, and asset management. In 2021, the company focused on expanding digital channels and optimizing its Midwest and West regional presence.
KeyCorp: Regional Bank with Comprehensive Client Solutions
KeyCorp operates primarily as a retail and commercial banking leader serving individuals and SMEs across 15 states. Its revenue engine centers on deposits, lending, and wealth management services, bolstered by commercial finance and capital markets offerings. The 2021 strategy emphasized community development financing and expanding its multi-channel banking footprint.
Strategic Collision: Similarities & Divergences
Both banks champion regional banking with diversified services but differ in scale and branch density. U.S. Bancorp leverages a larger branch and ATM network, while KeyCorp focuses on specialized commercial and community banking. Their rivalry unfolds mainly in deposit gathering and lending to mid-sized businesses. These distinctions create unique risk and growth profiles for investors monitoring the regional banking space.
Income Statement Comparison
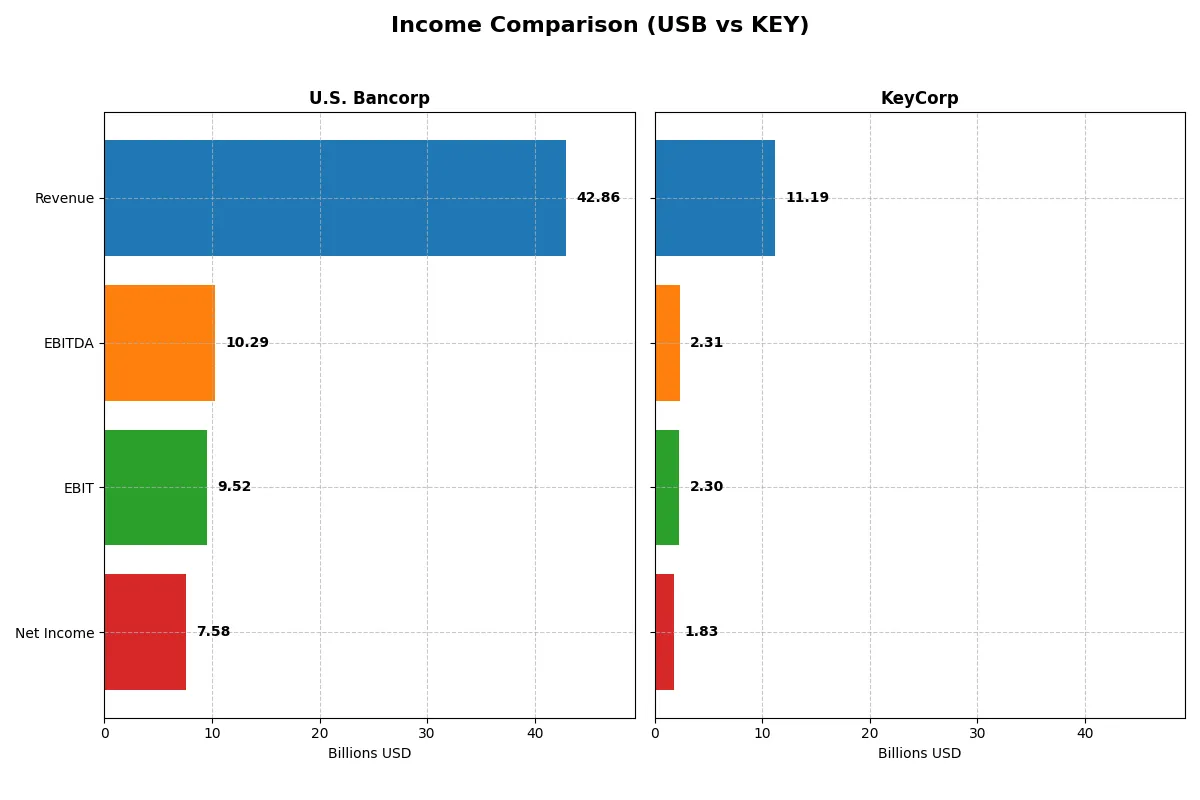
This data dissects the core profitability and scalability of both corporate engines, revealing who dominates the bottom line for the most recent fiscal year:
| Metric | U.S. Bancorp (USB) | KeyCorp (KEY) |
|---|---|---|
| Revenue | 42.9B | 11.2B |
| Cost of Revenue | 15.9B | 4.2B |
| Operating Expenses | 17.4B | 4.7B |
| Gross Profit | 26.9B | 7.0B |
| EBITDA | 10.3B | 2.3B |
| EBIT | 9.5B | 2.3B |
| Interest Expense | 14.3B | 3.8B |
| Net Income | 7.6B | 1.8B |
| EPS | 4.62 | 1.66 |
| Fiscal Year | 2025 | 2025 |
Income Statement Analysis: The Bottom-Line Duel
This income statement comparison reveals which company runs its financial engine with superior efficiency and sustainable momentum.
U.S. Bancorp Analysis
U.S. Bancorp’s revenue climbed steadily from $23.7B in 2021 to $42.9B in 2025, showing robust top-line growth. Its gross margin holds a healthy 62.8%, while the net margin improved to 17.7%, signaling strong profitability. The 2025 year saw a 20% EBIT surge and a 21.6% EPS increase, underlining operational efficiency and profitable momentum.
KeyCorp Analysis
KeyCorp’s revenue increased from $7.3B in 2021 to $11.2B in 2025, marking solid growth but at a smaller scale. The gross margin stayed favorable at 62.3%, with net margin rising to 16.4%. KeyCorp achieved a remarkable 852.9% EBIT growth and over 1000% net margin growth in 2025, reflecting a sharp rebound and accelerating profitability after prior challenges.
Steady Growth vs. Sharp Rebound
U.S. Bancorp dominates in scale and margin stability, delivering consistent revenue and profit expansion. KeyCorp impresses with extraordinary recent margin improvements and earnings growth, albeit from a lower base. Investors seeking reliable scale and profitability may favor U.S. Bancorp, while those drawn to high momentum could find KeyCorp’s turnaround compelling.
Financial Ratios Comparison
These vital ratios act as a diagnostic tool to expose the underlying fiscal health, valuation premiums, and capital efficiency of the companies compared below:
| Ratios | U.S. Bancorp (USB) | KeyCorp (KEY) |
|---|---|---|
| ROE | 11.62% | 8.97% |
| ROIC | 11.14% | 5.83% |
| P/E | 10.95 | 12.36 |
| P/B | 1.27 | 1.11 |
| Current Ratio | 2.73 | 0.77 |
| Quick Ratio | 2.73 | 0.77 |
| D/E | 1.20 | 0.54 |
| Debt-to-Assets | 11.3% | 6.0% |
| Interest Coverage | 0.66 | 0.61 |
| Asset Turnover | 0.062 | 0.061 |
| Fixed Asset Turnover | 11.38 | 17.82 |
| Payout ratio | 41.46% | 49.10% |
| Dividend yield | 3.79% | 3.97% |
| Fiscal Year | 2025 | 2025 |
Efficiency & Valuation Duel: The Vital Signs
Financial ratios serve as a company’s DNA, uncovering hidden risks and revealing operational strength in a concise, quantifiable manner.
U.S. Bancorp
U.S. Bancorp displays solid profitability with an 11.62% ROE and a favorable 17.68% net margin. Its valuation remains attractive, trading at a P/E of 10.95 and P/B of 1.27, indicating efficiency without overstretching. The company rewards shareholders with a 3.79% dividend yield, balancing returns and stability.
KeyCorp
KeyCorp posts a lower ROE at 8.97% yet maintains a strong net margin of 16.35%. Its P/E ratio of 12.36 and P/B of 1.11 suggest a fairly valued stock, though operational efficiency lags behind peers. Dividend yield at 3.97% slightly exceeds U.S. Bancorp’s, reflecting steady shareholder income despite weaker profitability.
Balanced Profitability vs. Dividend Stability
U.S. Bancorp offers a better harmony of profitability and valuation, supported by a higher ROE and robust dividend yield. KeyCorp, while offering a marginally higher dividend, shows less operational strength and efficiency. Investors seeking balanced growth and income may favor U.S. Bancorp’s profile.
Which one offers the Superior Shareholder Reward?
I see U.S. Bancorp (USB) delivers a higher dividend yield around 3.8%-4.9% with payout ratios between 36%-61%, signaling a balanced distribution backed by robust free cash flow. USB also executes steady buybacks, enhancing total return sustainably. KeyCorp (KEY) offers a slightly higher dividend yield near 4%-6.8%, but its payout ratios vary widely, including negative levels in 2024, reflecting earnings volatility. KEY’s buyback activity is limited, suggesting less aggressive capital return. USB’s stable dividends, consistent buybacks, and strong cash coverage form a more reliable shareholder reward model in 2026. I favor U.S. Bancorp for superior total return potential.
Comparative Score Analysis: The Strategic Profile
The radar chart reveals the fundamental DNA and trade-offs of U.S. Bancorp and KeyCorp across valuation, profitability, and leverage metrics:
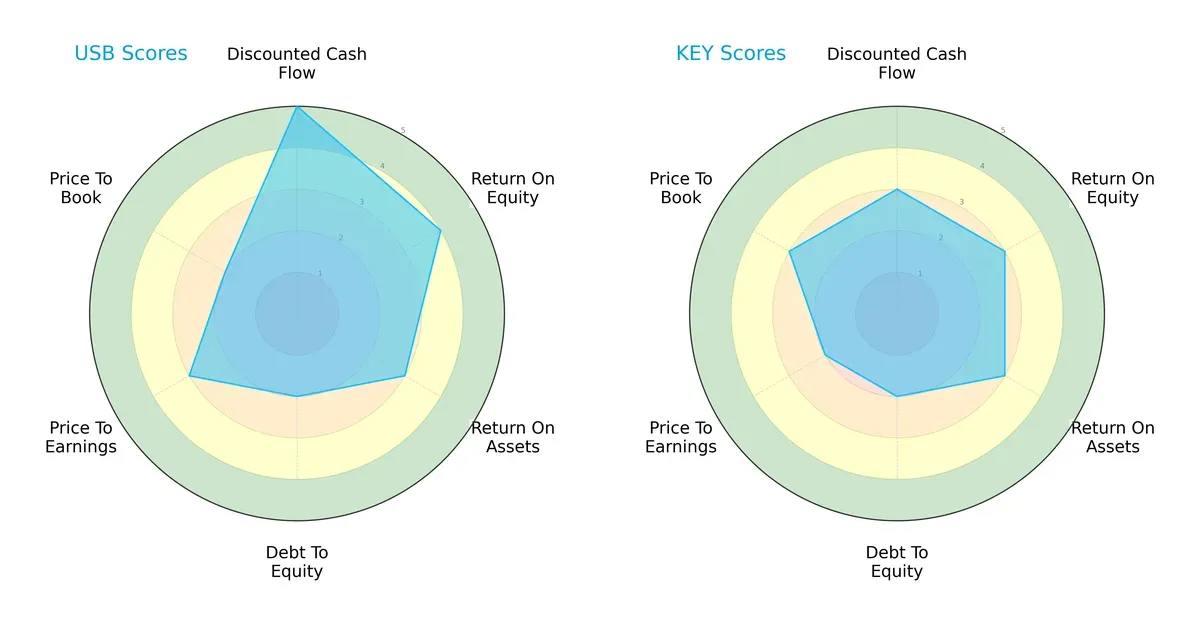
U.S. Bancorp leads with a superior discounted cash flow score (5 vs. 3) and higher return on equity (4 vs. 3), signaling stronger cash generation and shareholder efficiency. Both firms share moderate return on assets and debt-to-equity profiles (scores of 3 and 2, respectively). KeyCorp edges slightly in price-to-book valuation (3 vs. 2), suggesting a marginally better market value relative to book. Overall, U.S. Bancorp presents a more balanced profile by leveraging cash flow strength, while KeyCorp relies more on valuation appeal.
Bankruptcy Risk: Solvency Showdown
The Altman Z-Scores place both firms deep in the distress zone, indicating elevated bankruptcy risk in this cycle:
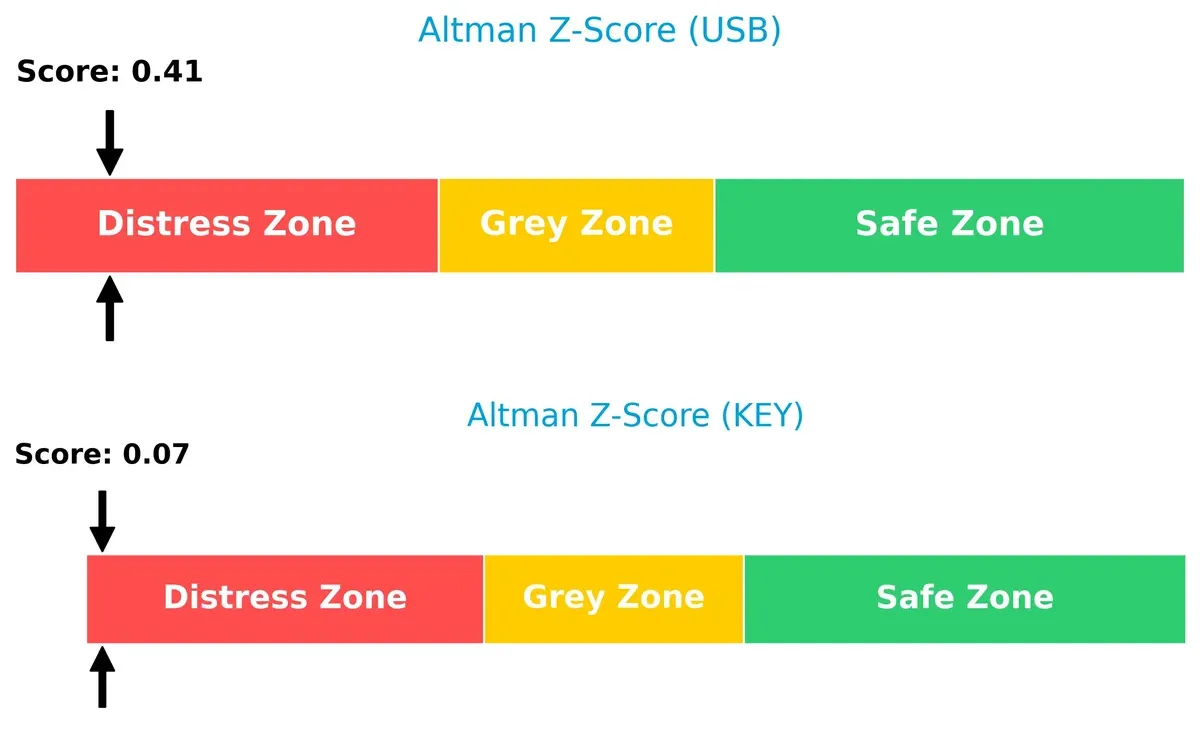
U.S. Bancorp scores 0.41, marginally higher than KeyCorp’s 0.07, but both fall far below the safe threshold of 3. This signals significant solvency concerns for investors to weigh carefully over the long term.
Financial Health: Quality of Operations
Piotroski F-Scores suggest KeyCorp operates with stronger financial health compared to U.S. Bancorp:
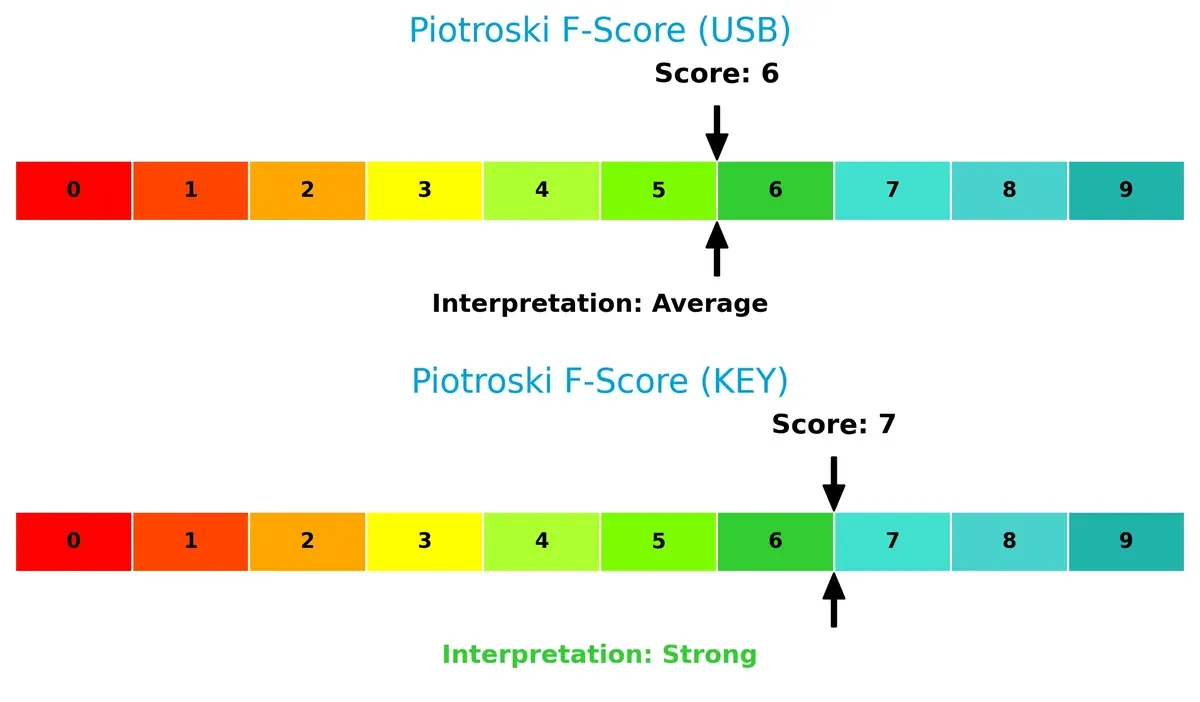
KeyCorp’s score of 7 indicates solid profitability, leverage, and efficiency metrics, while U.S. Bancorp’s 6 reflects average operational quality. Neither shows critical red flags, but KeyCorp’s internal fundamentals appear more robust for sustained performance.
How are the two companies positioned?
This section dissects the operational DNA of USB and KEY by comparing their revenue distribution and internal dynamics. The goal is to confront their economic moats and identify which model offers the most resilient, sustainable advantage today.
Revenue Segmentation: The Strategic Mix
This visual comparison dissects how U.S. Bancorp and KeyCorp diversify their income streams and reveals where their primary sector bets lie:
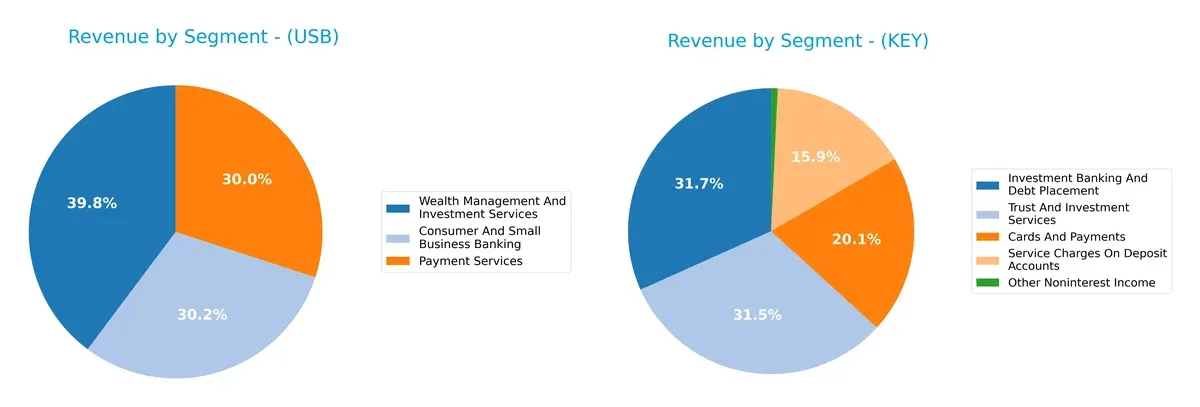
U.S. Bancorp pivots on Wealth Management and Investment Services, generating $12.2B, dwarfing its Payment Services and Consumer Banking at ~$9.2B each. This mix signals strong ecosystem lock-in through wealth and payment infrastructure. KeyCorp shows a more balanced approach, splitting roughly evenly between Investment Banking ($521M), Trust Services ($518M), and Cards & Payments ($331M). KeyCorp’s diversified portfolio mitigates concentration risk but lacks U.S. Bancorp’s dominant infrastructure foothold.
Strengths and Weaknesses Comparison
This table compares the strengths and weaknesses of U.S. Bancorp and KeyCorp based on key financial and operational metrics:
U.S. Bancorp Strengths
- Higher net margin at 17.68%
- Favorable P/E of 10.95 and P/B of 1.27
- Strong current and quick ratios at 2.73
- Lower debt-to-assets ratio at 11.26%
- Higher fixed asset turnover at 11.38
- Diversified revenue with significant wealth management income
KeyCorp Strengths
- Favorable net margin at 16.35%
- Favorable P/E of 12.36 and P/B of 1.11
- Lower debt-to-assets ratio at 5.97%
- Higher fixed asset turnover at 17.82
- Slightly higher dividend yield at 3.97%
- Consistent community and corporate banking revenue
U.S. Bancorp Weaknesses
- Unfavorable ROIC (11.14%) below WACC (11.59%)
- Elevated debt-to-equity ratio at 1.2
- Low interest coverage ratio at 0.66
- Low asset turnover at 0.06
- Negative contribution from treasury and corporate support segment
- Neutral ROE at 11.62%
KeyCorp Weaknesses
- Unfavorable ROE at 8.97%
- Higher WACC at 14.27% vs. ROIC at 5.83%
- Low current and quick ratios at 0.77
- Low interest coverage ratio at 0.61
- Low asset turnover at 0.06
- Heavy reliance on net interest income despite lower diversification
U.S. Bancorp demonstrates stronger profitability and liquidity metrics, benefiting from diversified revenue streams, especially in wealth management. KeyCorp has a leaner balance sheet but faces challenges in profitability and liquidity, with a narrower revenue base. Each company’s financial profile suggests different strategic priorities in managing growth and risk.
The Moat Duel: Analyzing Competitive Defensibility
A structural moat is the only shield protecting long-term profits from relentless competitive pressures. Here’s how U.S. Bancorp and KeyCorp defend their turf:
U.S. Bancorp: Efficiency-Driven Operational Moat
U.S. Bancorp’s primary moat stems from operational efficiency and scale, reflected in its improving ROIC trend despite ROIC below WACC. Stable margins and growing profitability signal strengthening defenses. New digital banking initiatives could deepen this moat in 2026.
KeyCorp: Struggling Capital Efficiency Moat
KeyCorp relies on regional presence and diversified services but suffers a declining ROIC well below WACC, indicating value destruction. Though recent revenue growth shines, persistent profitability erosion threatens its competitive position. Expansion in niche lending might provide future relief.
Efficiency vs. Sustainability: Who Defends Better?
U.S. Bancorp’s improving ROIC trend marks a deeper, more resilient moat than KeyCorp’s deteriorating capital returns. Despite current value destruction, U.S. Bancorp is better positioned to defend market share through operational enhancements and innovation.
Which stock offers better returns?
Over the past year, both U.S. Bancorp and KeyCorp experienced strong upward price movements with accelerating bullish trends and notable highs, reflecting robust market interest and increasing buyer dominance.
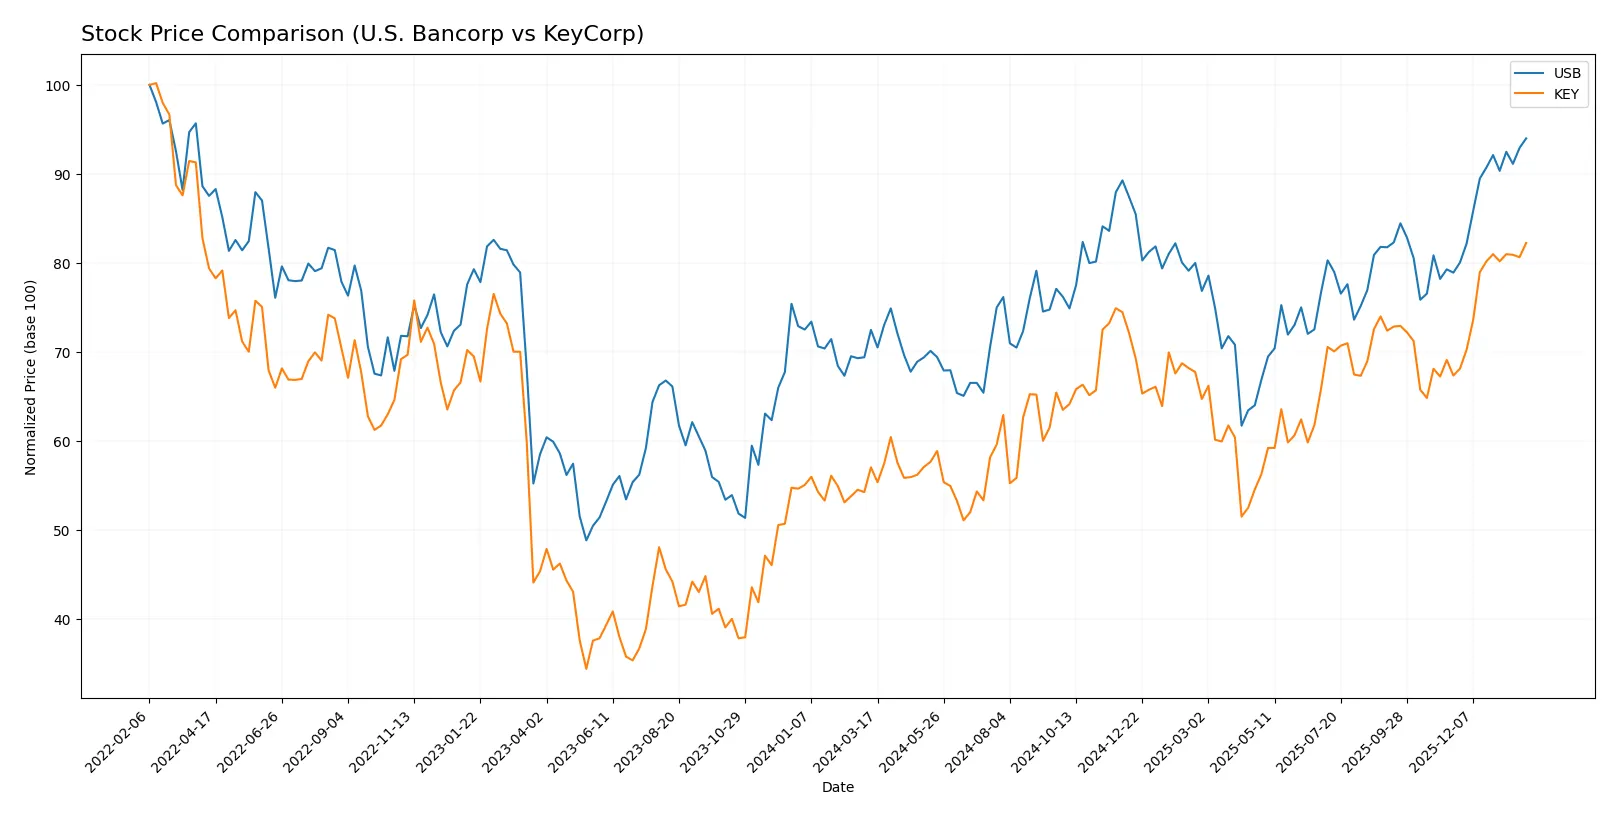
Trend Comparison
U.S. Bancorp’s stock rose 29.7% over 12 months, showing acceleration with volatility at 4.33%. It reached a high of 56.11 and a low of 36.83, signaling strong momentum.
KeyCorp’s stock gained 44.24% over the same period, also accelerating but with lower volatility at 2.0%. It recorded a high of 21.52 and a low of 13.36, underscoring steady bullish strength.
KeyCorp outperformed U.S. Bancorp in price appreciation, delivering the highest market returns in the analyzed 12-month span.
Target Prices
Analyst consensus suggests moderate upside potential for both U.S. Bancorp and KeyCorp.
| Company | Target Low | Target High | Consensus |
|---|---|---|---|
| U.S. Bancorp | 50 | 65 | 58.13 |
| KeyCorp | 18 | 25 | 23.38 |
U.S. Bancorp’s consensus target of 58.13 slightly exceeds its current price of 56.11, indicating modest appreciation potential. KeyCorp’s target consensus of 23.38 also implies upside from its 21.52 current price, reflecting cautious optimism from analysts.

Don’t Let Luck Decide Your Entry Point
Optimize your entry points with our advanced ProRealTime indicators. You’ll get efficient buy signals with precise price targets for maximum performance. Start outperforming now!
How do institutions grade them?
U.S. Bancorp Grades
The following table summarizes recent institutional grades for U.S. Bancorp:
| Grading Company | Action | New Grade | Date |
|---|---|---|---|
| Argus Research | Maintain | Buy | 2026-01-22 |
| DA Davidson | Maintain | Buy | 2026-01-21 |
| Keefe, Bruyette & Woods | Maintain | Market Perform | 2026-01-21 |
| Truist Securities | Maintain | Hold | 2026-01-21 |
| TD Cowen | Maintain | Buy | 2026-01-21 |
| RBC Capital | Maintain | Outperform | 2026-01-21 |
| Oppenheimer | Maintain | Outperform | 2026-01-21 |
| TD Cowen | Maintain | Buy | 2026-01-07 |
| Wolfe Research | Downgrade | Peer Perform | 2026-01-07 |
| Barclays | Maintain | Overweight | 2026-01-05 |
KeyCorp Grades
The following table summarizes recent institutional grades for KeyCorp:
| Grading Company | Action | New Grade | Date |
|---|---|---|---|
| Truist Securities | Maintain | Hold | 2026-01-26 |
| TD Cowen | Maintain | Buy | 2026-01-07 |
| Baird | Downgrade | Underperform | 2026-01-06 |
| Barclays | Maintain | Equal Weight | 2026-01-05 |
| Truist Securities | Maintain | Hold | 2025-12-22 |
| Keefe, Bruyette & Woods | Maintain | Outperform | 2025-12-17 |
| DA Davidson | Maintain | Buy | 2025-12-10 |
| Truist Securities | Maintain | Hold | 2025-10-17 |
| DA Davidson | Maintain | Buy | 2025-10-17 |
| UBS | Maintain | Buy | 2025-10-07 |
Which company has the best grades?
U.S. Bancorp generally holds stronger grades, including multiple Buy and Outperform ratings. KeyCorp shows more Hold and some downgrades, indicating a less favorable outlook. Investors may interpret these grades as a signal of relative institutional confidence.
Risks specific to each company
The following categories identify the critical pressure points and systemic threats facing both firms in the 2026 market environment:
1. Market & Competition
U.S. Bancorp
- Larger market cap (87B) gives USB scale advantages but faces intense regional bank competition.
KeyCorp
- Smaller market cap (23.7B) limits scale; competitive pressure from larger regional peers and national banks.
2. Capital Structure & Debt
U.S. Bancorp
- Higher debt-to-equity ratio (1.2) signals more leverage risk, though debt-to-assets remains moderate (11.3%).
KeyCorp
- More conservative leverage (D/E 0.54) reduces financial risk but may constrain growth flexibility.
3. Stock Volatility
U.S. Bancorp
- Beta 1.09 indicates market-like volatility; trading near 52-week high suggests limited downside buffer.
KeyCorp
- Beta 1.08 shows similar volatility; share price near upper range but with higher recent volume, implying investor caution.
4. Regulatory & Legal
U.S. Bancorp
- Operating across multiple states with a complex regulatory environment increases compliance costs and legal risks.
KeyCorp
- Concentrated in 15 states, potentially reducing regulatory complexity but still exposed to strict banking oversight.
5. Supply Chain & Operations
U.S. Bancorp
- Large ATM and branch network (2,230 offices, 4,059 ATMs) requires significant operational maintenance and digital transition investment.
KeyCorp
- Smaller branch (999) and ATM (1,317) network, easing operational costs but limiting market reach.
6. ESG & Climate Transition
U.S. Bancorp
- Increasing pressure to align lending and investments with climate goals may raise compliance and capital costs.
KeyCorp
- Similar ESG challenges but less scale may hamper ability to invest in green initiatives effectively.
7. Geopolitical Exposure
U.S. Bancorp
- Primarily US-focused, limiting direct geopolitical risk but sensitive to domestic economic policies and inflationary pressures.
KeyCorp
- Also domestically focused; regional economic disparities pose risks amid inflation and interest rate shifts.
Which company shows a better risk-adjusted profile?
U.S. Bancorp’s primary risk is its elevated leverage, which could amplify financial stress during downturns. KeyCorp’s critical risk lies in its weak liquidity ratios, signaling potential short-term funding challenges. Despite USB’s leverage concerns, its larger scale and favorable ratio profile offer a better risk-adjusted position than KeyCorp, whose current ratio below 1 is a notable red flag. The distress zone Altman Z-scores for both firms underscore financial vulnerability, but KeyCorp’s stronger Piotroski score suggests marginally better operational resilience. Overall, USB’s diversified operations and stronger financial ratios justify a cautiously optimistic stance amid sector headwinds.
Final Verdict: Which stock to choose?
U.S. Bancorp’s superpower lies in its robust liquidity and consistent margin strength, making it a reliable cash generator. However, its moderate leverage and interest coverage ratios warrant vigilance. It fits a portfolio seeking steady income with moderate risk tolerance.
KeyCorp’s strategic moat is its pronounced operational efficiency and improving profitability amid challenging market conditions. It offers a more aggressive growth profile but with higher financial risk than U.S. Bancorp. It suits investors prioritizing growth potential tempered by caution.
If you prioritize steady income and strong liquidity, U.S. Bancorp is the compelling choice due to its favorable margin and dividend profile. However, if you seek growth with operational momentum, KeyCorp offers better upside, albeit with elevated financial risk and volatility. Both present distinct scenarios tailored to different investor appetites.
Disclaimer: Investment carries a risk of loss of initial capital. The past performance is not a reliable indicator of future results. Be sure to understand risks before making an investment decision.
Go Further
I encourage you to read the complete analyses of U.S. Bancorp and KeyCorp to enhance your investment decisions: