Home > Comparison > Financial Services > TFC vs KEY
The strategic rivalry between Truist Financial Corporation and KeyCorp shapes the regional banking landscape in the U.S. Truist, a capital-rich financial services powerhouse, operates across three segments including insurance and wealth management. KeyCorp, a focused regional bank, emphasizes retail and commercial banking with a strong community presence. This analysis scrutinizes their distinct operational models to identify which offers superior risk-adjusted returns for diversified portfolios amid evolving sector dynamics.
Table of contents
Companies Overview
Truist Financial Corporation and KeyCorp stand as major regional banks shaping the US financial services landscape.
Truist Financial Corporation: Regional Banking Powerhouse
Truist dominates consumer and corporate banking in the Southeastern and Mid-Atlantic US. Its revenue stems from diversified banking products, including deposits, lending, insurance, and wealth management. In 2021, the company emphasized expanding digital banking and integrated financial solutions across its 2,517 offices. This broad footprint underpins its competitive advantage in scale and service variety.
KeyCorp: Midwest Banking Specialist
KeyCorp focuses on retail and commercial banking through approximately 999 branches across 15 states. Revenue comes from deposits, lending, wealth management, and capital markets. The bank’s 2021 strategy prioritized enhancing digital capabilities and community development financing. Its mid-sized network and targeted regional approach offer a distinct market presence in the Midwest.
Strategic Collision: Similarities & Divergences
Both banks pursue growth via diversified financial services and digital innovation, yet Truist favors scale with a large branch network while KeyCorp targets regional depth. Their primary battleground lies in middle-market lending and wealth management, where customer relationships drive success. Truist offers a broader service spectrum and higher market cap, whereas KeyCorp’s profile reflects focused regional strength and a leaner cost structure.
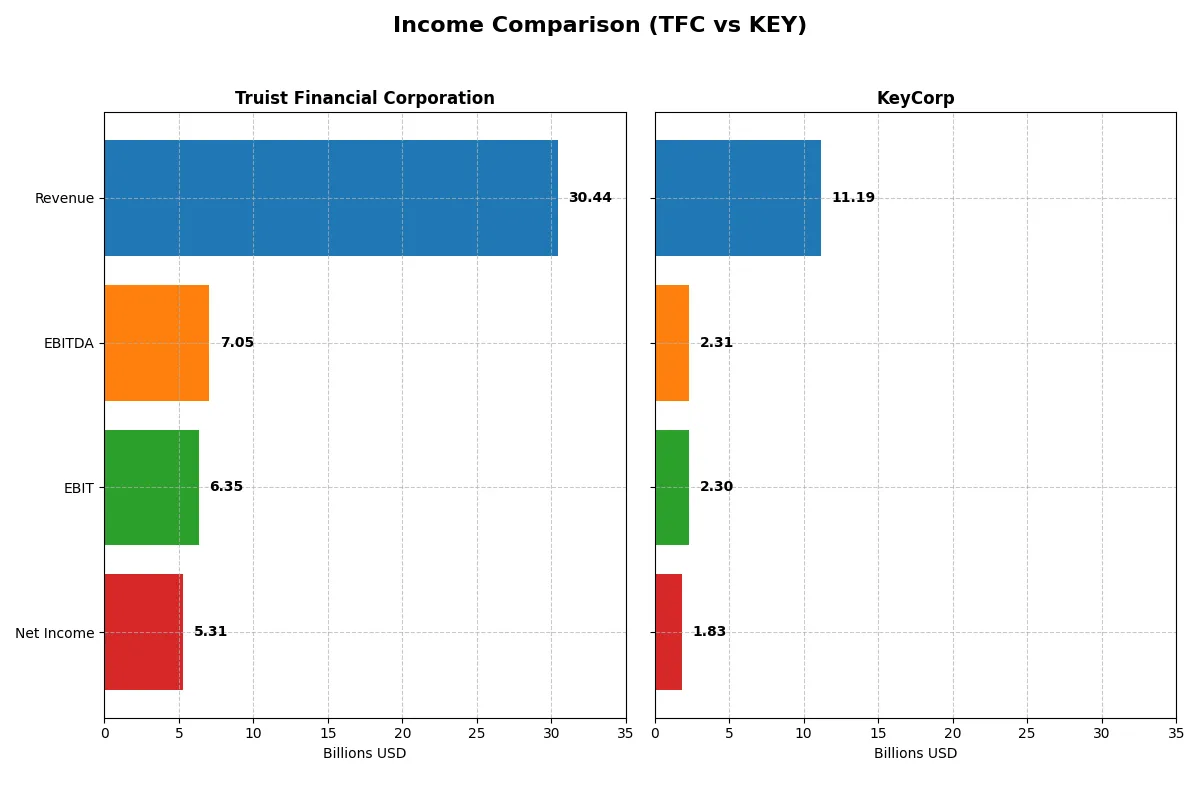
Income Statement Comparison
This data dissects the core profitability and scalability of both corporate engines to reveal who dominates the bottom line:
| Metric | Truist Financial Corporation (TFC) | KeyCorp (KEY) |
|---|---|---|
| Revenue | 30.4B | 11.2B |
| Cost of Revenue | 11.5B | 4.2B |
| Operating Expenses | 12.6B | 4.7B |
| Gross Profit | 18.9B | 7.0B |
| EBITDA | 7.1B | 2.3B |
| EBIT | 6.3B | 2.3B |
| Interest Expense | 10.1B | 3.7B |
| Net Income | 5.3B | 1.8B |
| EPS | 3.86 | 1.66 |
| Fiscal Year | 2025 | 2025 |
Income Statement Analysis: The Bottom-Line Duel
This income statement comparison unveils the true operational efficiency and profitability momentum of two leading financial institutions.
Truist Financial Corporation (TFC) Analysis
TFC’s revenue climbed from $23B in 2021 to $30.4B in 2025, reflecting steady top-line growth. Gross margin remains robust at 62.2%, supporting a solid net margin near 17.4%. Despite rising interest expenses at 33.2% of revenue, TFC reversed prior losses with a $5.3B net income in 2025, signaling a strong operational rebound.
KeyCorp (KEY) Analysis
KEY’s revenue expanded from $7.3B in 2021 to $11.2B in 2025, outperforming TFC in growth rate with a 52.6% increase. Gross margin holds steady at 62.3%, and net margin improved significantly to 16.4% in 2025. KEY posted $1.8B net income in 2025, recovering from losses in 2024, driven by impressive EBIT growth and margin expansion.
Margin Strength vs. Growth Trajectory
Both banks maintain comparable gross and EBIT margins around 62% and 20%, respectively, but TFC delivers higher absolute profits with $5.3B net income versus KEY’s $1.8B. KEY outpaces TFC in revenue growth rate, yet TFC’s scale and operational leverage convert revenue into stronger net earnings. For investors, TFC’s profile offers greater profitability stability, while KEY’s rapid growth hints at emerging momentum.
Financial Ratios Comparison
These vital ratios act as a diagnostic tool to expose the underlying fiscal health, valuation premiums, and capital efficiency of the companies compared below:
| Ratios | Truist Financial Corporation (TFC) | KeyCorp (KEY) |
|---|---|---|
| ROE | 8.14% | 8.97% |
| ROIC | 3.61% | 5.83% |
| P/E | 11.75 | 12.36 |
| P/B | 0.96 | 1.11 |
| Current Ratio | 0.87 | 0.77 |
| Quick Ratio | 0.87 | 0.77 |
| D/E | 1.07 | 0.54 |
| Debt-to-Assets | 12.75% | 5.97% |
| Interest Coverage | 0.63 | 0.61 |
| Asset Turnover | 0.056 | 0.061 |
| Fixed Asset Turnover | 9.60 | 17.82 |
| Payout ratio | 49.67% | 49.10% |
| Dividend yield | 4.23% | 3.97% |
| Fiscal Year | 2025 | 2025 |
Efficiency & Valuation Duel: The Vital Signs
Financial ratios act as a company’s DNA, revealing hidden risks and operational excellence that shape investor confidence and valuation.
Truist Financial Corporation
Truist shows moderate profitability with an 8.14% ROE and a strong 17.44% net margin. Its P/E of 11.75 and P/B near 1 suggest the stock remains reasonably priced. However, a low current ratio and an interest coverage below 1 raise liquidity concerns. The 4.23% dividend yield reflects shareholder returns through steady payouts.
KeyCorp
KeyCorp records a slightly higher 8.97% ROE and a solid 16.35% net margin. Valuation multiples are close, with a P/E of 12.36 and P/B at 1.11, indicating fair pricing. Key’s conservative debt levels and a 3.97% dividend yield also reward shareholders, though its liquidity ratios and interest coverage signal caution.
Balanced Valuation with Comparable Risks
Both companies deliver attractive valuations and similar profitability, but Truist offers a marginally higher dividend yield while KeyCorp maintains a stronger return on invested capital. Investors seeking moderate income may prefer Truist, while those focused on capital efficiency might lean toward KeyCorp’s profile.
Which one offers the Superior Shareholder Reward?
I see Truist Financial Corporation (TFC) delivers a 4.2% dividend yield with a 50% payout ratio, signaling balanced cash return and retention. KeyCorp (KEY) yields 4.0% with a similar 49% payout but shows lower free cash flow support for dividends. TFC also supports buybacks more aggressively, enhancing shareholder return. Historically in banking, sustainable dividends backed by strong free cash flow and buybacks create superior total rewards. I conclude TFC offers a more attractive and sustainable shareholder return profile for 2026 investors.
Comparative Score Analysis: The Strategic Profile
The radar chart reveals the fundamental DNA and trade-offs of Truist Financial Corporation and KeyCorp, highlighting their financial strengths and valuation nuances:
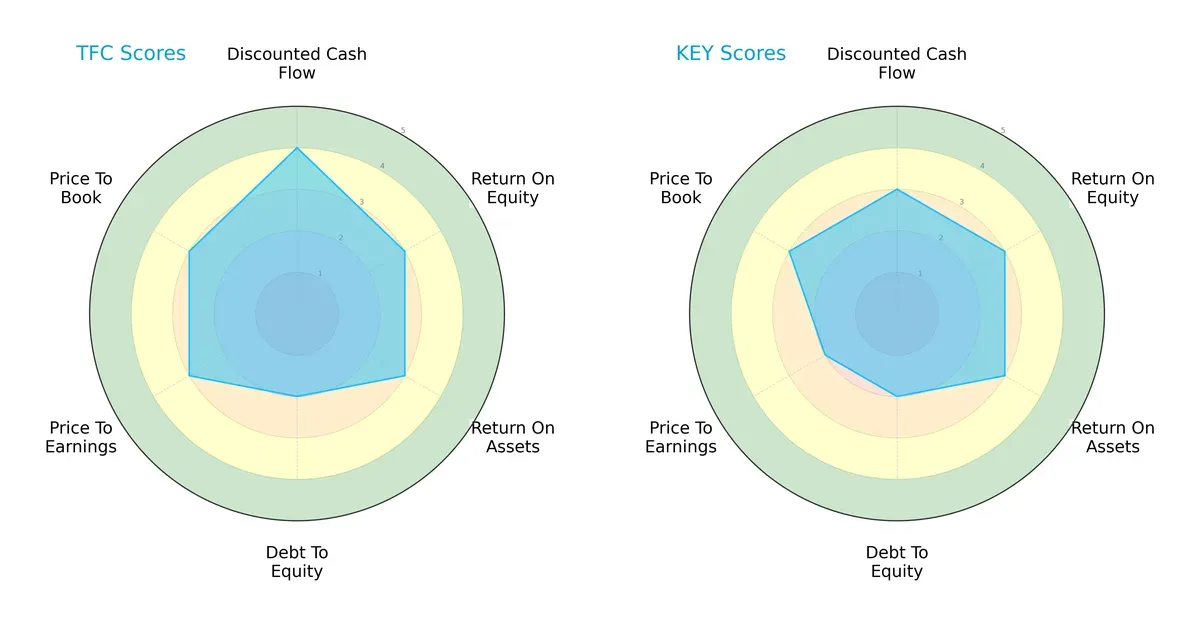
Truist leads with a stronger discounted cash flow score (4 vs. 3), suggesting better future cash flow projections. Both firms share moderate efficiency metrics (ROE and ROA at 3) and identical debt-to-equity risk (2). Truist slightly outperforms KeyCorp in valuation (P/E score 3 vs. 2), indicating a more balanced profile. KeyCorp appears to rely more on stable asset returns with less valuation appeal.
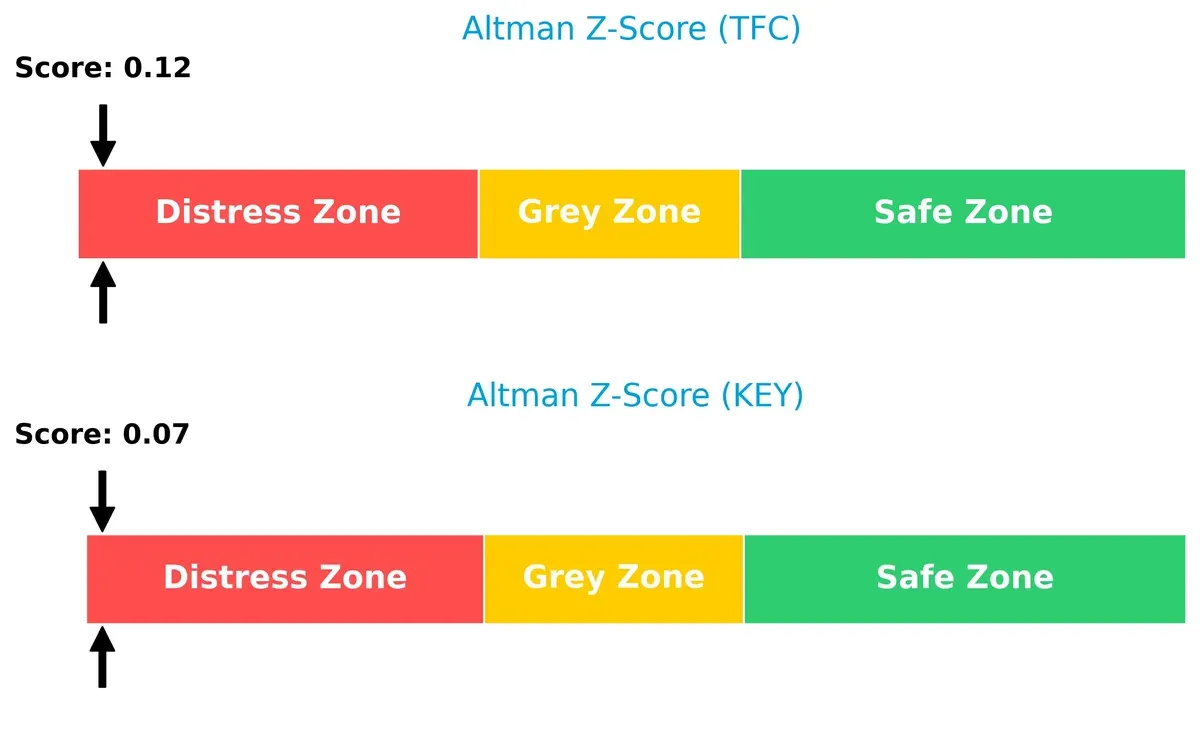
Bankruptcy Risk: Solvency Showdown
Both Truist and KeyCorp fall deep into the distress zone with Altman Z-Scores near 0.1, signaling high bankruptcy risk under current economic pressures:
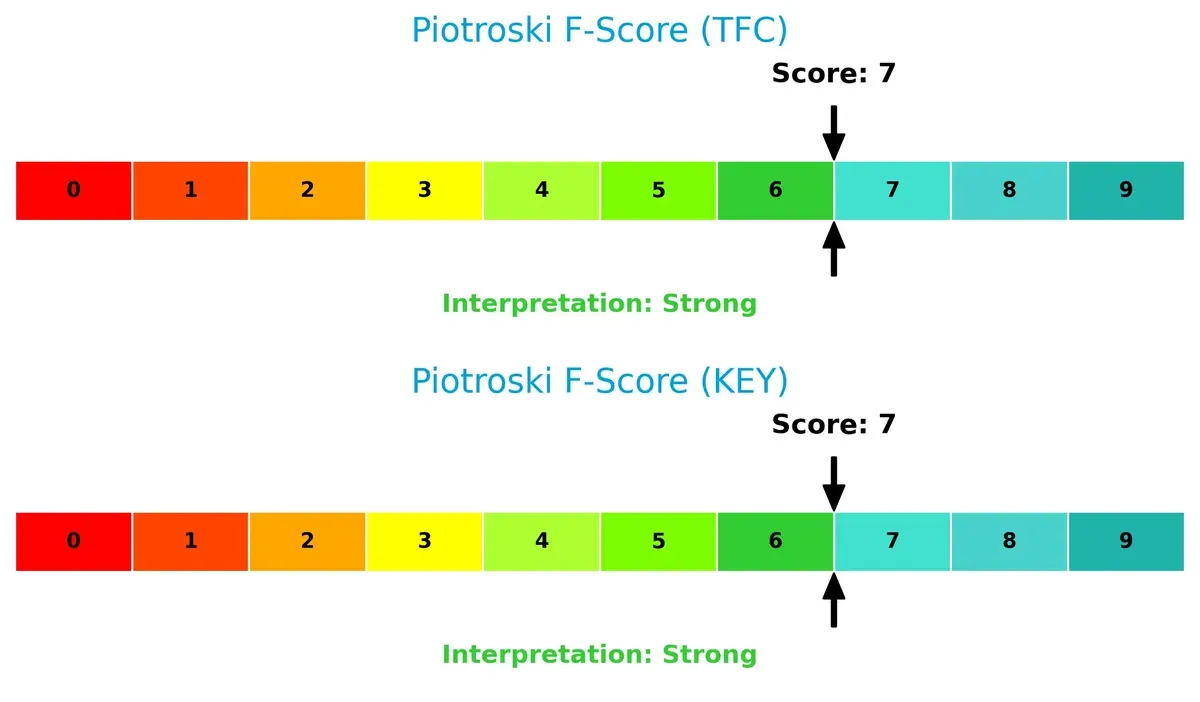
Financial Health: Quality of Operations
Truist and KeyCorp each score a 7 on the Piotroski F-Score, reflecting strong internal financial health and operational quality. Neither shows immediate red flags compared to the other:
How are the two companies positioned?
This section dissects Truist Financial Corporation and KeyCorp’s operational DNA by comparing revenue distribution and internal strengths and weaknesses. The goal is to confront their economic moats to identify which model offers the most resilient, sustainable competitive advantage today.
Revenue Segmentation: The Strategic Mix
The following visual comparison dissects how Truist Financial Corporation and KeyCorp diversify their income streams and where their primary sector bets lie:
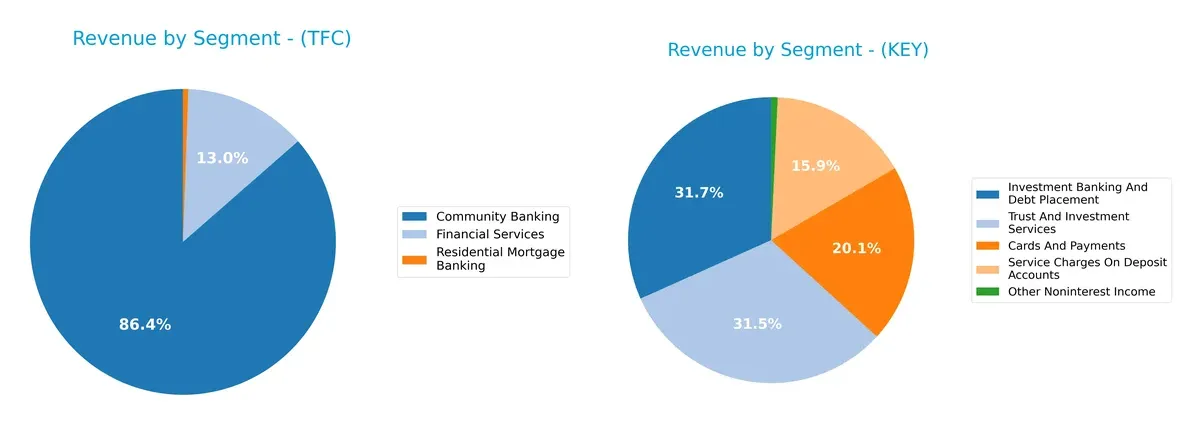
Truist leans heavily on Community Banking with $153M in 2016, while other segments remain marginal or negative, signaling concentration risk and limited diversification. KeyCorp, in contrast, showcases a balanced mix with $521M in Investment Banking, $518M Trust Services, $331M Cards & Payments, and $261M Service Charges, illustrating a diversified revenue base that supports ecosystem lock-in and reduces dependency on any single segment.
Strengths and Weaknesses Comparison
This table compares the strengths and weaknesses of Truist Financial Corporation (TFC) and KeyCorp (KEY):
TFC Strengths
- Favorable net margin at 17.44%
- Strong fixed asset turnover at 9.6
- Dividend yield of 4.23% supports income investors
- Favorable P/E and P/B ratios indicating attractive valuation
- Favorable low debt to assets ratio at 12.75%
KEY Strengths
- Favorable net margin at 16.35%
- Highest fixed asset turnover at 17.82
- Favorable dividend yield of 3.97%
- Diverse revenue streams including cards, investment banking, and trust services
- P/E and P/B ratios favorable, suggesting market confidence
TFC Weaknesses
- Unfavorable ROE of 8.14% below cost of capital
- Current ratio below 1 at 0.87 signals liquidity risk
- Debt to equity ratio above 1 at 1.07 indicates leverage concerns
- Low interest coverage ratio at 0.63 raises solvency questions
- Unfavorable asset turnover limits operational efficiency
KEY Weaknesses
- ROE at 8.97% still unfavorable relative to WACC
- Elevated WACC at 14.27% weighs on capital returns
- Current and quick ratios at 0.77 indicate liquidity constraints
- Interest coverage ratio low at 0.61
- Asset turnover low, reflecting operational inefficiencies
Both companies show balanced strengths in profitability and valuation metrics but face liquidity and efficiency challenges. Their financial leverage and capital costs suggest cautious capital allocation strategies remain essential.
The Moat Duel: Analyzing Competitive Defensibility
A structural moat stands as the critical barrier protecting a company’s long-term profits from relentless competitive erosion:
Truist Financial Corporation: Scale and Diversification Moat
Truist leverages a broad regional footprint and diversified financial services. Its moat shows in stable margins despite rising interest expenses. New digital products could deepen customer retention in 2026.
KeyCorp: Focused Regional Niche Moat
KeyCorp’s moat derives from targeted commercial banking and personal finance niches. It maintains comparable margins but faces sharper ROIC declines than Truist. Expansion into tech lending may offer growth in 2026.
Scale Breadth vs. Niche Focus: Who Defends Better?
Both firms suffer declining ROIC well below WACC, signaling value erosion. Truist’s wider service scope offers more resilience. I see Truist better positioned to defend market share amid intensifying competition.
Which stock offers better returns?
Over the past year, both Truist Financial Corporation and KeyCorp exhibited strong bullish price movements, with accelerating trends and notable gains in market value.
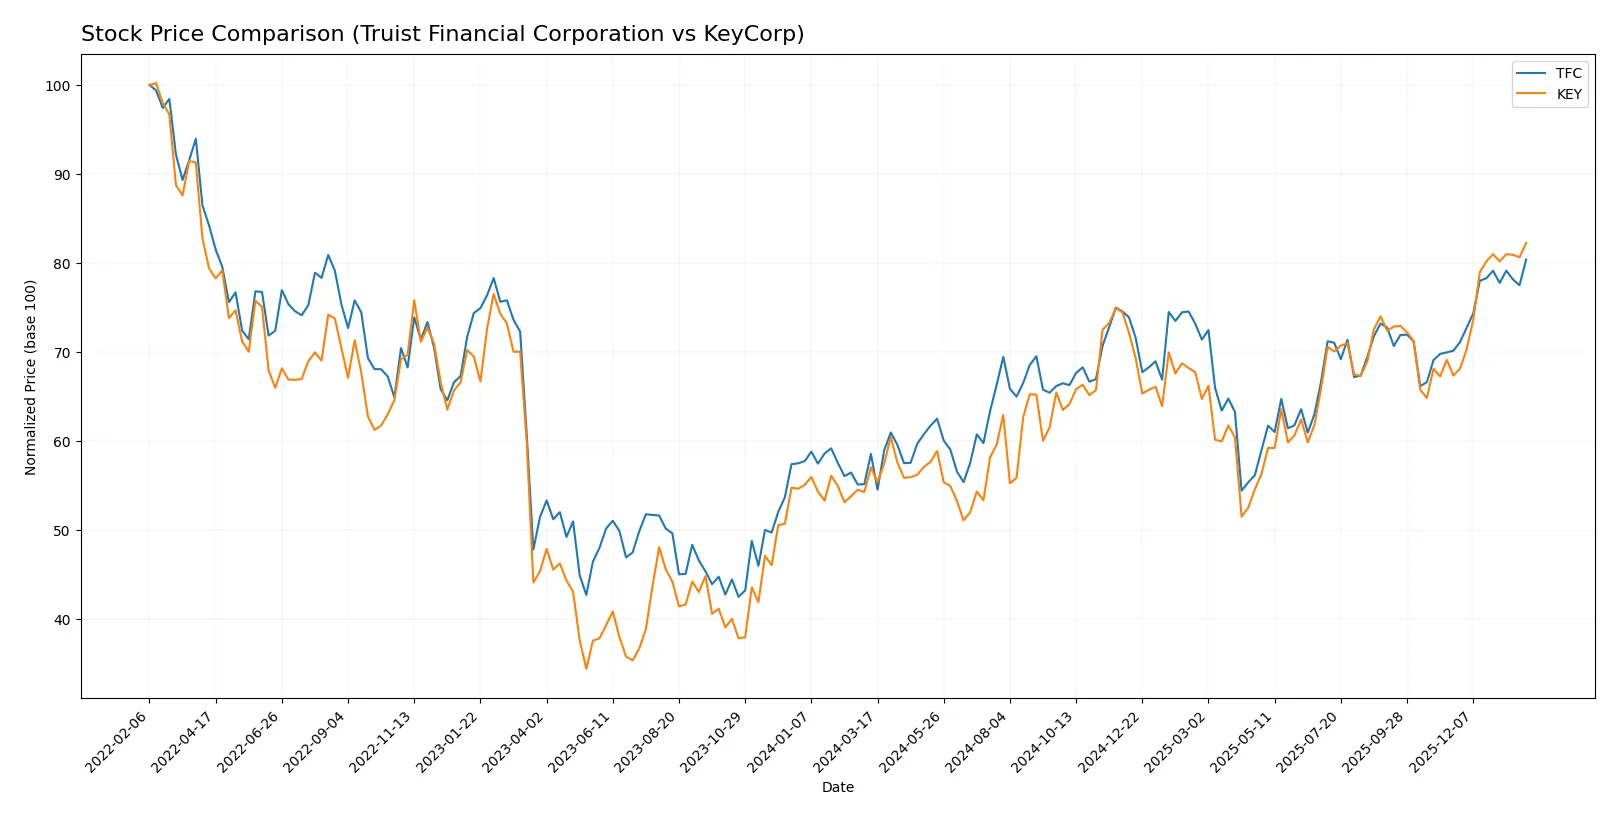
Trend Comparison
Truist Financial Corporation’s stock rose 37.34% over the past 12 months, showing an accelerating bullish trend with a high of 51.42 and low of 34.79. Recent momentum remains positive with a 14.62% gain.
KeyCorp’s stock gained 44.24% over the same period, also in acceleration. The price ranged between 13.36 and 21.52, with a recent 22.13% increase. Volatility here is lower than Truist’s.
KeyCorp outperformed Truist financially with a higher total return and steadier price movement, delivering the strongest market performance in the last year.
Target Prices
Analysts project moderate upside for Truist Financial Corporation and KeyCorp based on current consensus targets.
| Company | Target Low | Target High | Consensus |
|---|---|---|---|
| Truist Financial Corporation | 50 | 58 | 54.38 |
| KeyCorp | 18 | 25 | 23.38 |
The consensus targets for Truist and KeyCorp suggest potential gains of roughly 5.7% and 8.6%, respectively, above current prices. This reflects cautious optimism within regional banking amid ongoing economic shifts.

Don’t Let Luck Decide Your Entry Point
Optimize your entry points with our advanced ProRealTime indicators. You’ll get efficient buy signals with precise price targets for maximum performance. Start outperforming now!
How do institutions grade them?
Here is a summary of recent institutional grades for Truist Financial Corporation and KeyCorp:
Truist Financial Corporation Grades
The table below shows Truist’s latest grades from leading investment firms.
| Grading Company | Action | New Grade | Date |
|---|---|---|---|
| Argus Research | Maintain | Buy | 2026-01-23 |
| Piper Sandler | Maintain | Neutral | 2026-01-22 |
| TD Cowen | Maintain | Buy | 2026-01-22 |
| TD Cowen | Maintain | Buy | 2026-01-07 |
| Raymond James | Maintain | Outperform | 2026-01-07 |
| Evercore ISI Group | Upgrade | Outperform | 2026-01-06 |
| Barclays | Downgrade | Underweight | 2026-01-05 |
| Citigroup | Maintain | Buy | 2025-12-31 |
| Keefe, Bruyette & Woods | Maintain | Market Perform | 2025-12-17 |
| Morgan Stanley | Maintain | Equal Weight | 2025-12-17 |
KeyCorp Grades
Below are the recent grades for KeyCorp from established grading firms.
| Grading Company | Action | New Grade | Date |
|---|---|---|---|
| Truist Securities | Maintain | Hold | 2026-01-26 |
| TD Cowen | Maintain | Buy | 2026-01-07 |
| Baird | Downgrade | Underperform | 2026-01-06 |
| Barclays | Maintain | Equal Weight | 2026-01-05 |
| Truist Securities | Maintain | Hold | 2025-12-22 |
| Keefe, Bruyette & Woods | Maintain | Outperform | 2025-12-17 |
| DA Davidson | Maintain | Buy | 2025-12-10 |
| Truist Securities | Maintain | Hold | 2025-10-17 |
| DA Davidson | Maintain | Buy | 2025-10-17 |
| UBS | Maintain | Buy | 2025-10-07 |
Which company has the best grades?
Truist Financial generally receives stronger grades, including multiple “Buy” and “Outperform” ratings. KeyCorp’s ratings mix “Buy” and “Hold,” with some downgrades. Investors may view Truist’s higher grades as a sign of greater confidence from analysts.
Risks specific to each company
The following categories identify the critical pressure points and systemic threats facing both firms in the 2026 market environment:
1. Market & Competition
Truist Financial Corporation (TFC)
- Operates in competitive Southeastern and Mid-Atlantic banking markets with diversified services.
KeyCorp (KEY)
- Serves 15 states with a smaller branch network, facing intense regional competition.
2. Capital Structure & Debt
Truist Financial Corporation (TFC)
- Debt-to-equity ratio at 1.07 signals higher leverage; interest coverage weak at 0.63.
KeyCorp (KEY)
- Lower debt-to-equity at 0.54, moderate leverage, but similar weak interest coverage at 0.61.
3. Stock Volatility
Truist Financial Corporation (TFC)
- Beta of 0.874 indicates lower volatility than market, offering relative stability.
KeyCorp (KEY)
- Beta of 1.082 suggests above-market volatility, increasing investor risk.
4. Regulatory & Legal
Truist Financial Corporation (TFC)
- Subject to stringent US regional banking regulations; complexity from insurance and investment operations.
KeyCorp (KEY)
- Similar regulatory environment; smaller scale may reduce exposure but limits diversification.
5. Supply Chain & Operations
Truist Financial Corporation (TFC)
- Large branch network (2,517 offices) demands robust operational management.
KeyCorp (KEY)
- Smaller network (999 branches) eases operational burden but limits growth opportunities.
6. ESG & Climate Transition
Truist Financial Corporation (TFC)
- No explicit ESG data, but large footprint necessitates aggressive climate risk mitigation.
KeyCorp (KEY)
- Similar ESG challenges; smaller size may allow faster adaptation but less influence.
7. Geopolitical Exposure
Truist Financial Corporation (TFC)
- Concentrated in US Southeast and Mid-Atlantic; limited international risk.
KeyCorp (KEY)
- Concentrated in US Midwest and Northeast; also limited geopolitical exposure.
Which company shows a better risk-adjusted profile?
The biggest risk for Truist is its heavier leverage and weak interest coverage, heightening financial distress risk. KeyCorp’s elevated stock volatility and unfavorable weighted average cost of capital (WACC) represent its main concerns. Both firms hover in a financial “distress zone” per Altman Z-scores, but KeyCorp’s lower leverage and stronger asset turnover offer a marginally better risk-adjusted profile. Recent data showing Truist’s debt-to-equity exceeding 1.0 justifies caution on its capital structure.
Final Verdict: Which stock to choose?
Truist Financial Corporation’s superpower lies in its robust income growth and operational efficiency, driving solid cash flows. Its main point of vigilance is the stretched liquidity position, which could pressure short-term resilience. This stock fits an aggressive growth portfolio willing to tolerate some financial strain for upside potential.
KeyCorp offers a strategic moat through a more conservative capital structure and faster asset turnover, delivering better operational leverage. Compared to Truist, it provides a slightly safer profile with less liquidity risk and steadier dividend yield. It suits a GARP (Growth at a Reasonable Price) portfolio balancing growth and stability.
If you prioritize aggressive expansion and can manage liquidity risk, Truist outshines with stronger earnings momentum. However, if you seek better financial stability and a more durable operational moat, KeyCorp offers superior risk management at a moderate premium. Both present neutral overall ratings, so your choice hinges on your risk tolerance and portfolio strategy.
Disclaimer: Investment carries a risk of loss of initial capital. The past performance is not a reliable indicator of future results. Be sure to understand risks before making an investment decision.
Go Further
I encourage you to read the complete analyses of Truist Financial Corporation and KeyCorp to enhance your investment decisions: