Home > Comparison > Financial Services > PNC vs KEY
The strategic rivalry between The PNC Financial Services Group, Inc. and KeyCorp shapes the regional banking landscape in the U.S. PNC operates as a diversified financial services powerhouse with a broad institutional focus, while KeyCorp emphasizes community banking with strong ties to small and medium-sized enterprises. This head-to-head highlights a contest between scale-driven diversification and targeted regional specialization. This analysis will clarify which trajectory offers superior risk-adjusted returns for a balanced portfolio.
Table of contents
Companies Overview
The PNC Financial Services Group and KeyCorp both hold significant positions in the competitive regional banking sector.
The PNC Financial Services Group, Inc.: Diversified Financial Powerhouse
PNC dominates as a diversified financial services company in the US, generating revenue through retail banking, corporate and institutional banking, and asset management. Its core strength lies in serving consumers, small businesses, and large corporations. In 2026, PNC focuses on expanding digital channels and enhancing integrated financial solutions across 2,591 branches and 9,502 ATMs.
KeyCorp: Regional Banking Specialist
KeyCorp operates primarily through retail and commercial banking, targeting individuals and small to medium-sized businesses. It earns revenue from deposits, lending, wealth management, and capital markets services. In 2026, its strategic emphasis is on growing middle-market commercial loans and improving technology-driven customer experiences across 999 branches and 1,317 ATMs in 15 states.
Strategic Collision: Similarities & Divergences
Both banks emphasize retail and commercial banking but differ sharply in scale and scope. PNC pursues a broad, integrated financial platform, while KeyCorp remains more focused on regional, middle-market lending. Their primary battleground is customer acquisition through technology and service innovation. PNC’s scale offers diversified growth, whereas KeyCorp presents a leaner, regionally concentrated investment profile.
Income Statement Comparison
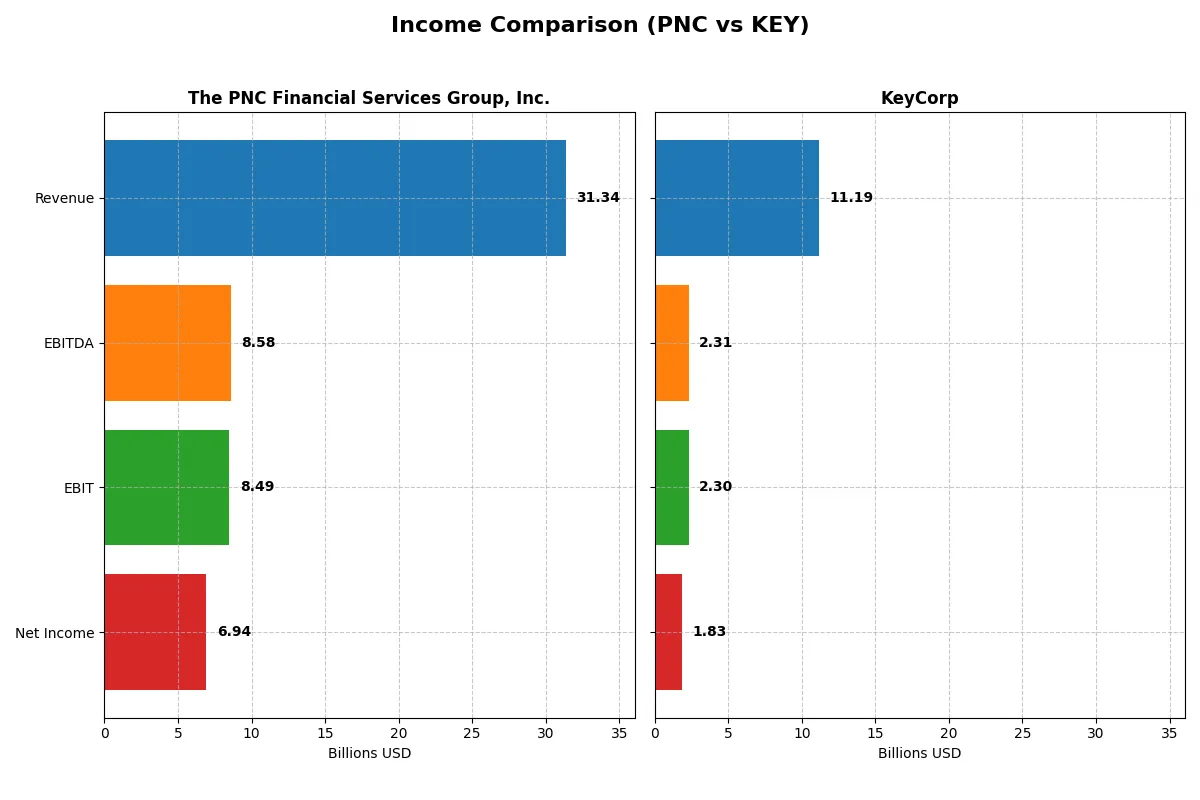
This data dissects the core profitability and scalability of both corporate engines to reveal who dominates the bottom line:
| Metric | The PNC Financial Services Group, Inc. (PNC) | KeyCorp (KEY) |
|---|---|---|
| Revenue | 31.3B | 11.2B |
| Cost of Revenue | 8.9B | 4.2B |
| Operating Expenses | 13.9B | 4.7B |
| Gross Profit | 22.5B | 7.0B |
| EBITDA | 8.6B | 2.3B |
| EBIT | 8.5B | 2.3B |
| Interest Expense | 10.9B | 3.8B |
| Net Income | 6.9B | 1.8B |
| EPS | 16.62 | 1.66 |
| Fiscal Year | 2025 | 2025 |
Income Statement Analysis: The Bottom-Line Duel
This income statement comparison reveals which company operates its financial engine with greater efficiency and momentum in recent years.
The PNC Financial Services Group, Inc. Analysis
PNC’s revenue grew 59% from 2021 to 2025 but dipped nearly 7% in the last year. Net income rose steadily, hitting $6.9B in 2025. Its gross margin remains strong at 71.7%, reflecting efficient cost control. The latest year shows robust EBIT and net margin growth, signaling improved profitability despite revenue softness.
KeyCorp Analysis
KeyCorp’s revenue surged 23.6% in 2025 after a 52.5% rise since 2021. Net income, however, declined over the period, recovering to $1.8B in 2025 from a 2024 loss. Gross margin at 62.3% is solid but below PNC’s. The sharp EBIT and net margin rebound last year points to a dramatic operational turnaround.
Margin Strength vs. Revenue Scale
PNC impresses with superior margin health and consistent net income growth, outperforming KeyCorp’s profitability. KeyCorp shows stronger recent revenue and earnings momentum but lags in long-term income growth. Investors seeking steady margin dominance will favor PNC, while those focused on a turnaround story may watch KeyCorp closely.
Financial Ratios Comparison
These vital ratios act as a diagnostic tool to expose the underlying fiscal health, valuation premiums, and capital efficiency of the companies compared below:
| Ratios | The PNC Financial Services Group, Inc. (PNC) | KeyCorp (KEY) |
|---|---|---|
| ROE | 11.45% | 8.97% |
| ROIC | 7.65% | 5.83% |
| P/E | 11.86 | 12.36 |
| P/B | 1.36 | 1.11 |
| Current Ratio | 0.81 | 0.77 |
| Quick Ratio | 0.81 | 0.77 |
| D/E | 0.94 | 0.54 |
| Debt-to-Assets | 9.96% | 5.97% |
| Interest Coverage | 0.78 | 0.61 |
| Asset Turnover | 0.05 | 0.06 |
| Fixed Asset Turnover | 0 | 17.82 |
| Payout ratio | 37.49% | 49.10% |
| Dividend yield | 3.16% | 3.97% |
| Fiscal Year | 2025 | 2025 |
Efficiency & Valuation Duel: The Vital Signs
Financial ratios serve as a company’s DNA, exposing hidden risks and operational strengths that shape investor decisions.
The PNC Financial Services Group, Inc.
PNC demonstrates solid profitability with an 11.45% ROE and a strong 22.13% net margin, signaling efficient earnings generation. Its P/E of 11.86 and P/B of 1.36 indicate a reasonably valued stock. The firm supports shareholders with a 3.16% dividend yield, reflecting a balanced capital allocation between returns and reinvestment.
KeyCorp
KeyCorp posts a lower 8.97% ROE and a 16.35% net margin, suggesting less profitability compared to PNC. Its P/E of 12.36 and P/B of 1.11 show a slightly cheaper valuation. KeyCorp offers a higher dividend yield at 3.97%, signaling a focus on income distribution despite a weaker return profile.
Valuation and Efficiency: Balanced Trade-offs
PNC delivers higher profitability and a fair valuation, while KeyCorp offers a more attractive dividend yield but lower returns. Investors prioritizing earnings efficiency may prefer PNC, whereas those seeking income might lean toward KeyCorp’s dividend profile.
Which one offers the Superior Shareholder Reward?
I observe that PNC yields 3.16% with a payout ratio near 37%, supported by stable free cash flow coverage. PNC’s buyback activity complements dividends to enhance total returns. KeyCorp offers a higher 3.97% dividend yield but with a near 49% payout ratio, straining sustainability amid volatile earnings. KeyCorp’s buyback program is modest, signaling reliance on dividends. Historically, PNC’s balanced distribution via dividends and buybacks sustains long-term value better. I conclude PNC presents a superior total shareholder reward in 2026 due to its prudent capital allocation and sustainable payout approach.
Comparative Score Analysis: The Strategic Profile
The radar chart below reveals the fundamental DNA and trade-offs of The PNC Financial Services Group, Inc. and KeyCorp:
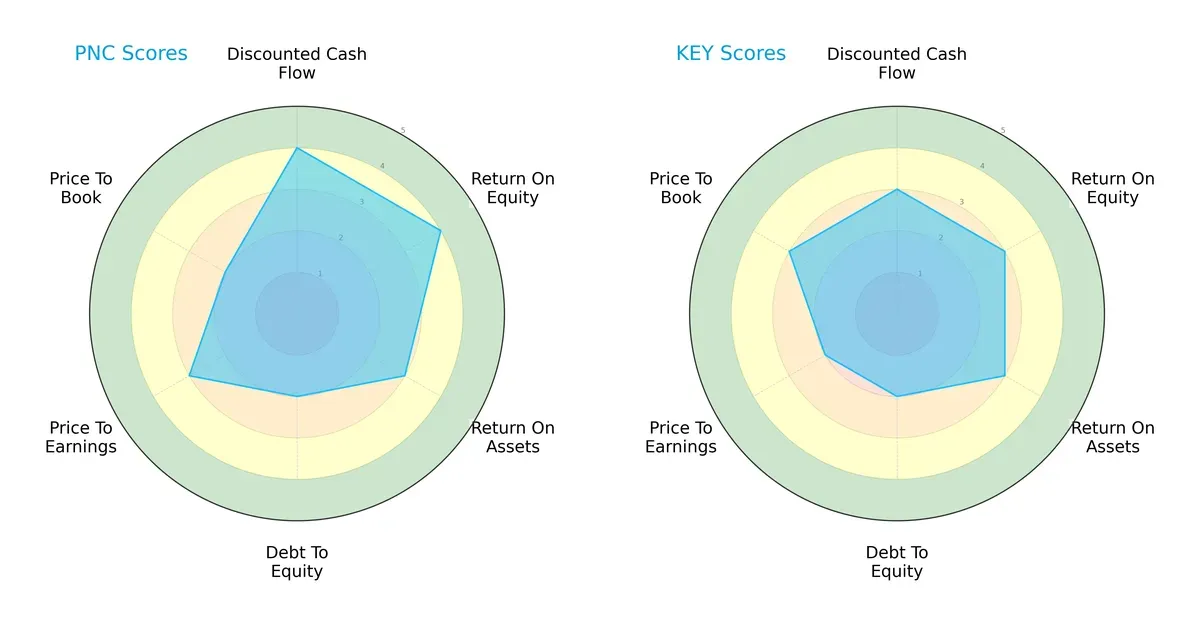
PNC leads with a stronger discounted cash flow score (4 vs. 3) and higher return on equity (4 vs. 3), indicating more efficient capital use. Both firms share moderate return on assets and debt-to-equity scores, reflecting similar operational efficiency and financial risk. KeyCorp edges out PNC slightly on price-to-book valuation (3 vs. 2), suggesting a more attractive market price relative to book value. Overall, PNC presents a more balanced profile focused on profitability, while KeyCorp relies more on valuation appeal.
Bankruptcy Risk: Solvency Showdown
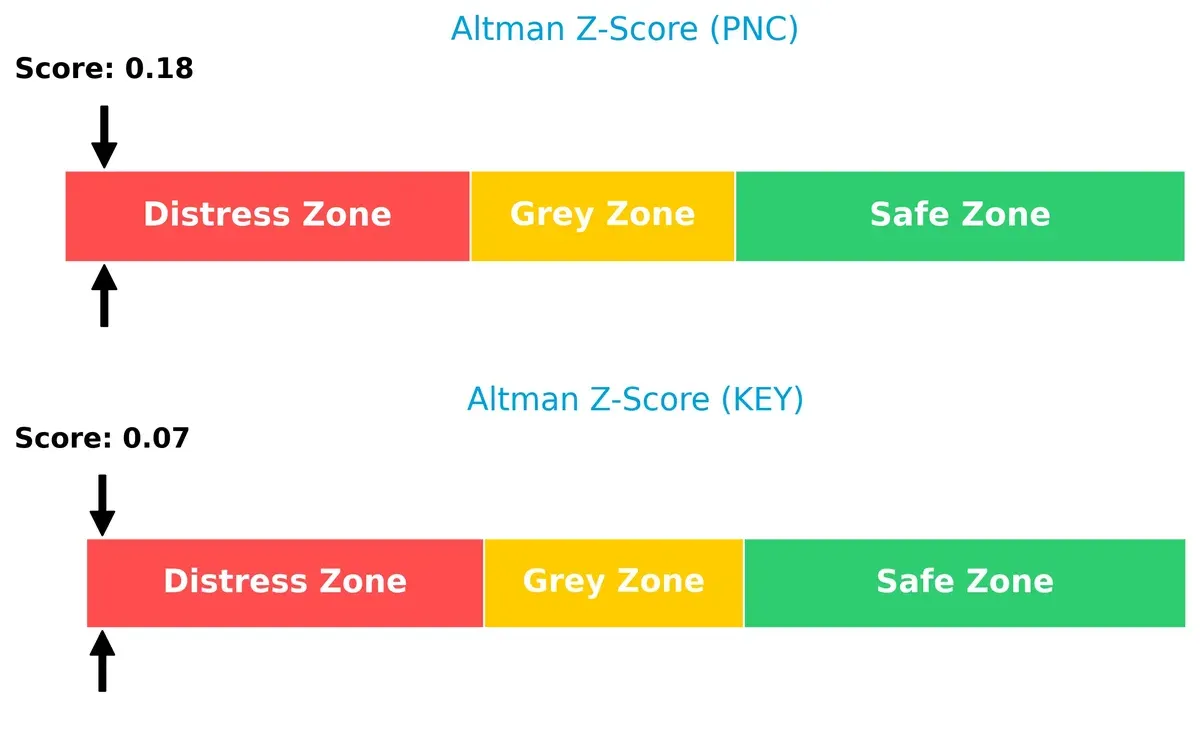
The Altman Z-Scores for both firms place them in the distress zone, with PNC at 0.18 and KeyCorp at 0.07, signaling elevated bankruptcy risk in this volatile cycle:
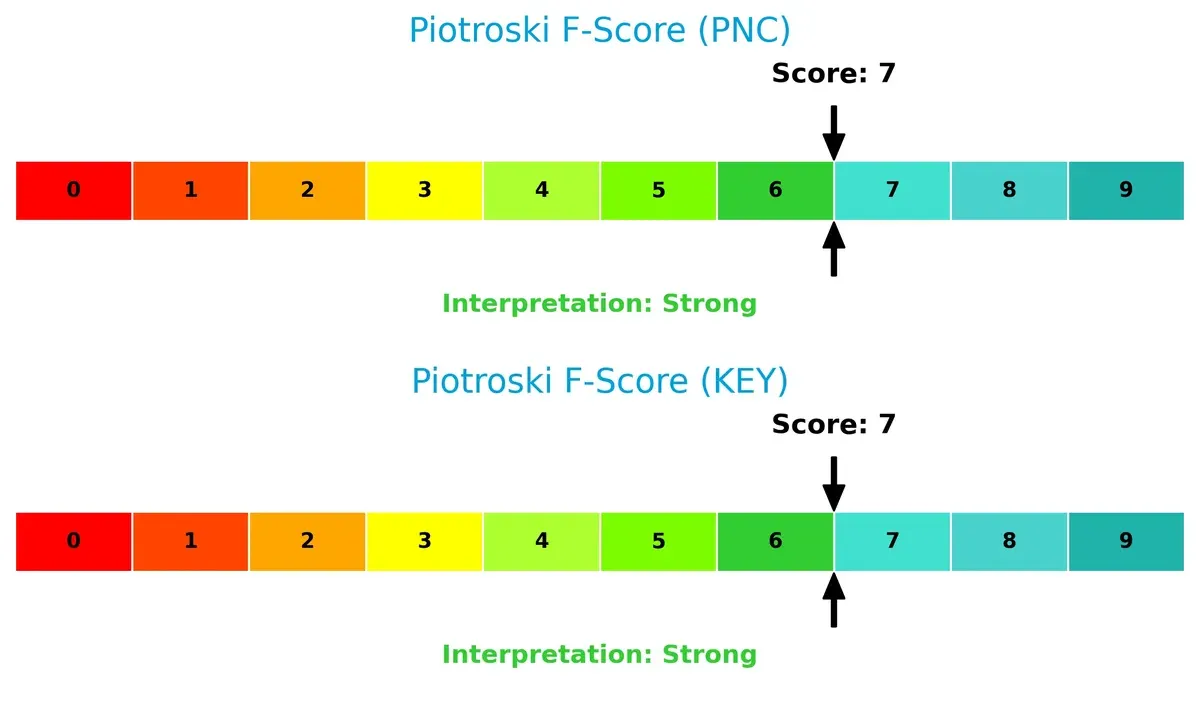
Financial Health: Quality of Operations
Both firms score a strong 7 on the Piotroski F-Score, demonstrating robust financial health with no significant red flags detected in internal metrics:
How are the two companies positioned?
This section dissects the operational DNA of PNC and KEY by comparing their revenue distribution and internal dynamics. The goal is to confront their economic moats to identify which model offers the most resilient and sustainable competitive advantage today.
Revenue Segmentation: The Strategic Mix
The following visual comparison dissects how The PNC Financial Services Group and KeyCorp diversify their income streams and where their primary sector bets lie:
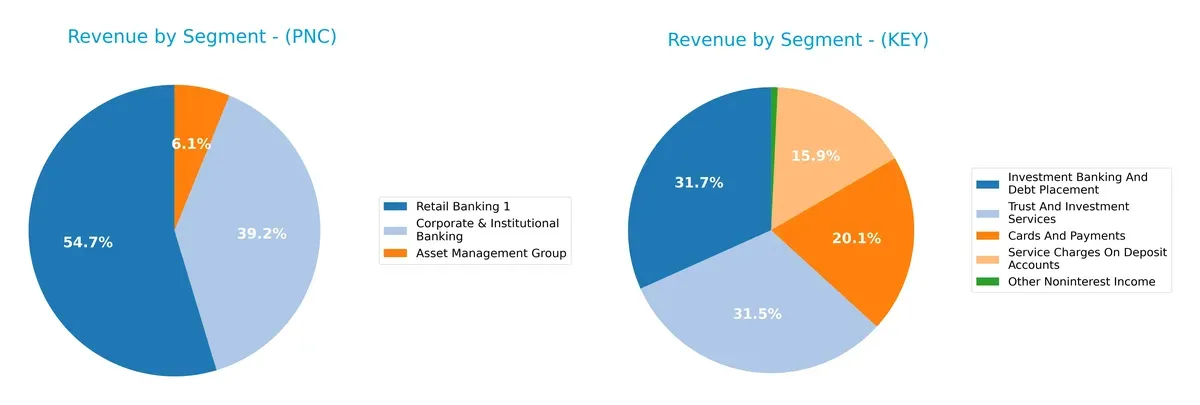
PNC anchors its revenue in Retail Banking at $12.9B, with Corporate & Institutional Banking contributing $9.3B, and Asset Management at $1.45B. This mix shows a balanced focus but leans heavily on retail. KeyCorp pivots on Net Interest Income at $7.9B, supplemented by $2.47B in Non-Interest Income, reflecting a more concentrated banking model. PNC’s broader segmentation suggests stronger ecosystem lock-in, while Key’s concentration signals higher sector risk but operational focus.
Strengths and Weaknesses Comparison
This table compares the Strengths and Weaknesses of PNC and KeyCorp based on diversification, profitability, financial statements, innovation, global presence, and market share:
PNC Strengths
- Diverse revenue streams across asset management, corporate, and retail banking
- Favorable net margin at 22.13%
- Strong dividend yield at 3.16%
- Low debt-to-assets ratio at 9.96%
- Favorable P/E of 11.86 and P/B of 1.36
KeyCorp Strengths
- Favorable net margin at 16.35%
- Higher dividend yield at 3.97%
- Favorable fixed asset turnover at 17.82
- Low debt-to-assets ratio at 5.97%
- Favorable P/E of 12.36 and P/B of 1.11
PNC Weaknesses
- Unfavorable current ratio at 0.81 and interest coverage at 0.78
- Unfavorable asset and fixed asset turnover
- ROIC (7.65%) below WACC (11.27%) signals capital inefficiency
- Neutral ROE at 11.45%
- Exposure to neutral and unfavorable ratios totals 64.28%
KeyCorp Weaknesses
- Unfavorable current and quick ratios at 0.77
- ROE at 8.97% below sector average
- Unfavorable WACC at 14.27% exceeds ROIC (5.83%)
- Weak interest coverage at 0.61
- Higher unfavorable ratio percentage at 42.86%
PNC shows stronger diversification and profitability margins but struggles with capital efficiency and liquidity. KeyCorp has a solid dividend and asset utilization but faces pressure from profitability and liquidity metrics. Both companies maintain neutral overall financial health with distinct operational challenges.
The Moat Duel: Analyzing Competitive Defensibility
A structural moat is the only thing protecting long-term profits from the erosion of competition. Let’s dissect the moats of two regional banks:
The PNC Financial Services Group, Inc.: Expanding Intangible Assets Moat
PNC leverages a broad branch network and diversified services, creating high switching costs. Its growing ROIC trend signals improving capital efficiency despite current value destruction. New digital products could deepen this moat in 2026.
KeyCorp: Narrow Cost Advantage Facing Profit Pressure
KeyCorp’s moat centers on cost efficiency and regional focus but suffers declining ROIC and profitability. Unlike PNC, Key struggles to convert revenue growth into sustainable returns. Market disruption may further pressure its competitive edge.
Moat Resilience: Capital Efficiency vs. Cost Discipline
PNC’s intangible asset moat offers a deeper competitive advantage through scale and service diversity. Key’s shrinking ROIC reveals a weaker moat. I see PNC better positioned to defend and extend market share in 2026.
Which stock offers better returns?
Both The PNC Financial Services Group, Inc. and KeyCorp have exhibited strong bullish trends over the past year, with significant price gains and increasing buyer dominance fueling upward momentum.
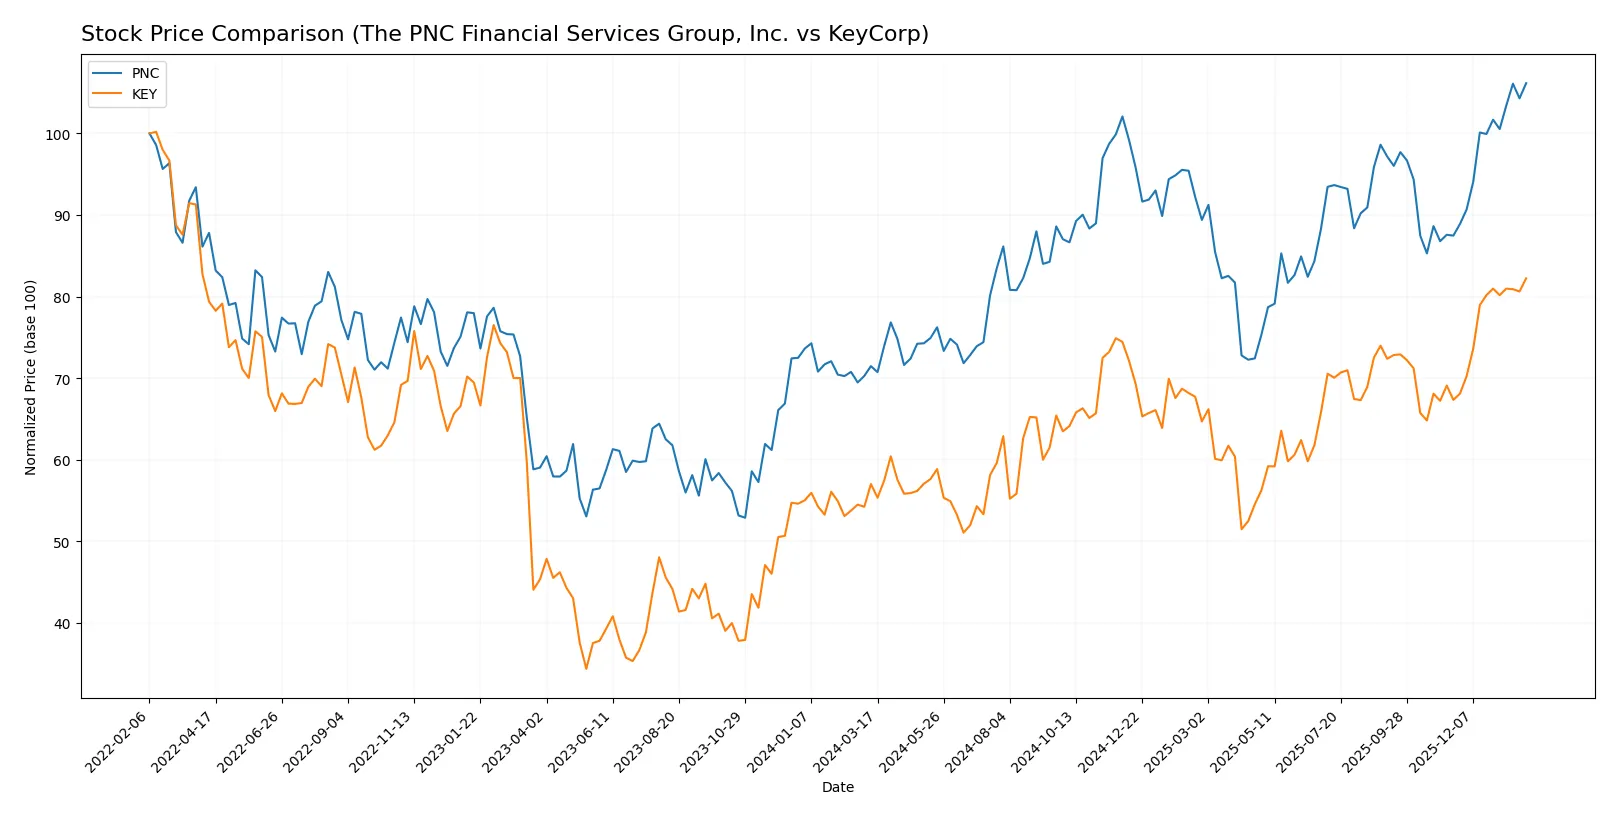
Trend Comparison
PNC’s stock rose 48.54% over the last 12 months, showing acceleration and high volatility with a 19.63 standard deviation. It reached a high of 223.3 and a low of 148.78.
KEY’s stock gained 44.24% over the same period, also accelerating but with much lower volatility at a 2.0 standard deviation. Its price ranged between 13.36 and 21.52.
PNC led with a higher 12-month gain, though both stocks display bullish momentum and increasing buyer dominance, PNC delivered the strongest market performance.
Target Prices
Analysts present a clear target consensus for The PNC Financial Services Group, Inc. and KeyCorp, reflecting moderate upside potential.
| Company | Target Low | Target High | Consensus |
|---|---|---|---|
| The PNC Financial Services Group, Inc. | 206 | 284 | 239.1 |
| KeyCorp | 18 | 25 | 23.38 |
The consensus target for PNC stands about 7% above its current price of 223.3, signaling modest growth expectations. KeyCorp’s target consensus exceeds its current 21.52 price by nearly 9%, indicating a slightly more bullish analyst outlook.

Don’t Let Luck Decide Your Entry Point
Optimize your entry points with our advanced ProRealTime indicators. You’ll get efficient buy signals with precise price targets for maximum performance. Start outperforming now!
How do institutions grade them?
The following tables summarize recent institutional grades for both companies:
The PNC Financial Services Group, Inc. Grades
The table below presents the latest grades from established grading firms for PNC:
| Grading Company | Action | New Grade | Date |
|---|---|---|---|
| Keefe, Bruyette & Woods | maintain | Market Perform | 2026-01-20 |
| Wells Fargo | maintain | Overweight | 2026-01-20 |
| Oppenheimer | maintain | Outperform | 2026-01-20 |
| RBC Capital | maintain | Outperform | 2026-01-20 |
| TD Cowen | maintain | Buy | 2026-01-20 |
| Morgan Stanley | maintain | Underweight | 2026-01-20 |
| TD Cowen | maintain | Buy | 2026-01-07 |
| Barclays | maintain | Overweight | 2026-01-05 |
| Truist Securities | maintain | Hold | 2025-12-18 |
| Keefe, Bruyette & Woods | maintain | Market Perform | 2025-12-17 |
KeyCorp Grades
Below are the most recent grades from credible grading companies for KeyCorp:
| Grading Company | Action | New Grade | Date |
|---|---|---|---|
| Truist Securities | maintain | Hold | 2026-01-26 |
| TD Cowen | maintain | Buy | 2026-01-07 |
| Baird | downgrade | Underperform | 2026-01-06 |
| Barclays | maintain | Equal Weight | 2026-01-05 |
| Truist Securities | maintain | Hold | 2025-12-22 |
| Keefe, Bruyette & Woods | maintain | Outperform | 2025-12-17 |
| DA Davidson | maintain | Buy | 2025-12-10 |
| Truist Securities | maintain | Hold | 2025-10-17 |
| DA Davidson | maintain | Buy | 2025-10-17 |
| UBS | maintain | Buy | 2025-10-07 |
Which company has the best grades?
PNC shows a broader mix of positive grades, including multiple “Outperform” and “Buy” ratings, with few negative signals. KeyCorp has solid “Buy” and “Outperform” grades but also an “Underperform” downgrade. PNC’s generally more favorable institutional sentiment could influence investor perception positively, though risks remain given some mixed opinions.
Risks specific to each company
The following categories identify critical pressure points and systemic threats facing both firms in the 2026 market environment:
1. Market & Competition
The PNC Financial Services Group, Inc.
- Larger market cap at $87B provides scale advantages but faces intense regional banking competition.
KeyCorp
- Smaller $23.7B market cap limits scale but focuses on niche regional markets in 15 states.
2. Capital Structure & Debt
The PNC Financial Services Group, Inc.
- Debt-to-assets at 9.96% is favorable; interest coverage at 0.78 signals stress in covering debt costs.
KeyCorp
- Lower debt-to-assets at 5.97% but weaker interest coverage at 0.61 increases default risk concerns.
3. Stock Volatility
The PNC Financial Services Group, Inc.
- Beta near market (0.99) suggests stock moves closely with overall market, moderate volatility.
KeyCorp
- Beta of 1.08 indicates slightly higher volatility than PNC, increasing risk during market swings.
4. Regulatory & Legal
The PNC Financial Services Group, Inc.
- Large branch network of 2,591 exposes it to diverse regulatory regimes, raising compliance complexity.
KeyCorp
- Smaller footprint with 999 branches limits regulatory exposure but still faces banking regulations in multiple states.
5. Supply Chain & Operations
The PNC Financial Services Group, Inc.
- Extensive ATM and branch network requires robust operational management; asset turnover at 0.05 is low.
KeyCorp
- Asset turnover slightly better (0.06) but operational efficiency remains a challenge given fixed asset turnover disparity.
6. ESG & Climate Transition
The PNC Financial Services Group, Inc.
- ESG risks may be elevated due to scale and diverse client base; climate transition policies impact loan portfolios.
KeyCorp
- Smaller scale and regional focus may enable more targeted ESG initiatives but still vulnerable to climate-finance risks.
7. Geopolitical Exposure
The PNC Financial Services Group, Inc.
- Primarily US-focused, geopolitical risk limited but sensitive to national economic policy shifts.
KeyCorp
- Similar US-centric profile with moderate exposure to regional economic fluctuations and policy changes.
Which company shows a better risk-adjusted profile?
PNC faces its biggest risk in debt servicing pressure, evidenced by weak interest coverage despite favorable debt ratios. KeyCorp’s main concern is even weaker interest coverage combined with higher volatility. PNC’s larger scale and somewhat better capital structure give it a modestly superior risk-adjusted profile. Notably, both firms’ Altman Z-Scores place them in distress zones, underscoring elevated bankruptcy risk in this sector despite strong Piotroski scores.
Final Verdict: Which stock to choose?
The PNC Financial Services Group, Inc. impresses with its resilience and improving profitability, signaling a cash-generating engine despite operating in a value-destroying environment. Its main point of vigilance is the weak liquidity ratio, which could pressure short-term flexibility. PNC suits portfolios focused on aggressive growth with some tolerance for operational risk.
KeyCorp’s strategic moat lies in its solid fixed asset efficiency and more conservative leverage, offering a steadier risk profile compared to PNC. Although its profitability and ROIC trend are weaker, KeyCorp appeals to investors seeking a GARP (Growth at a Reasonable Price) profile with a preference for relative stability over rapid expansion.
If you prioritize dynamic growth backed by improving returns, PNC is the compelling choice due to its accelerating profitability and market momentum. However, if you seek better stability and a more conservative capital structure, KeyCorp offers superior risk management despite lagging in value creation. Both present analytical scenarios worth considering based on your risk appetite and investment horizon.
Disclaimer: Investment carries a risk of loss of initial capital. The past performance is not a reliable indicator of future results. Be sure to understand risks before making an investment decision.
Go Further
I encourage you to read the complete analyses of The PNC Financial Services Group, Inc. and KeyCorp to enhance your investment decisions: