Home > Comparison > Financial Services > MTB vs KEY
The strategic rivalry between M&T Bank Corporation and KeyCorp shapes the competitive landscape of regional banking. M&T operates as a diversified commercial and retail bank with a strong emphasis on middle-market clients. KeyCorp combines consumer and commercial banking with a broad capital markets suite. This analysis contrasts their operational models to identify which offers superior risk-adjusted returns for a diversified portfolio in the evolving financial services sector.
Table of contents
Companies Overview
M&T Bank Corporation and KeyCorp stand as pivotal players in the US regional banking landscape.
M&T Bank Corporation: Deep-Rooted Regional Powerhouse
M&T Bank Corporation commands a strong market position in regional banking, generating revenue through diversified commercial and retail banking services. Its core strength lies in serving small businesses and commercial clients with deposit, lending, and cash management solutions. In 2021, M&T focused strategically on expanding its commercial real estate loans and wealth management offerings, enhancing client retention and fee income.
KeyCorp: Broad-Reach Banking Innovator
KeyCorp operates as a significant regional bank with an emphasis on consumer and commercial banking across 15 states. It gains revenue by delivering deposits, lending, asset management, and capital market products. In 2021, KeyCorp prioritized expanding its community development financing and investment banking services, driving growth through a comprehensive product suite and digital banking channels.
Strategic Collision: Similarities & Divergences
Both banks emphasize regional dominance and diversified financial services, yet M&T leans toward a more traditional commercial real estate and wealth management model. KeyCorp adopts a broader product mix including capital markets and community financing, competing fiercely in middle-market lending. Their distinct strategies create contrasting investment profiles: M&T offers stability with lower volatility, while KeyCorp presents growth potential with higher beta risk.
Income Statement Comparison
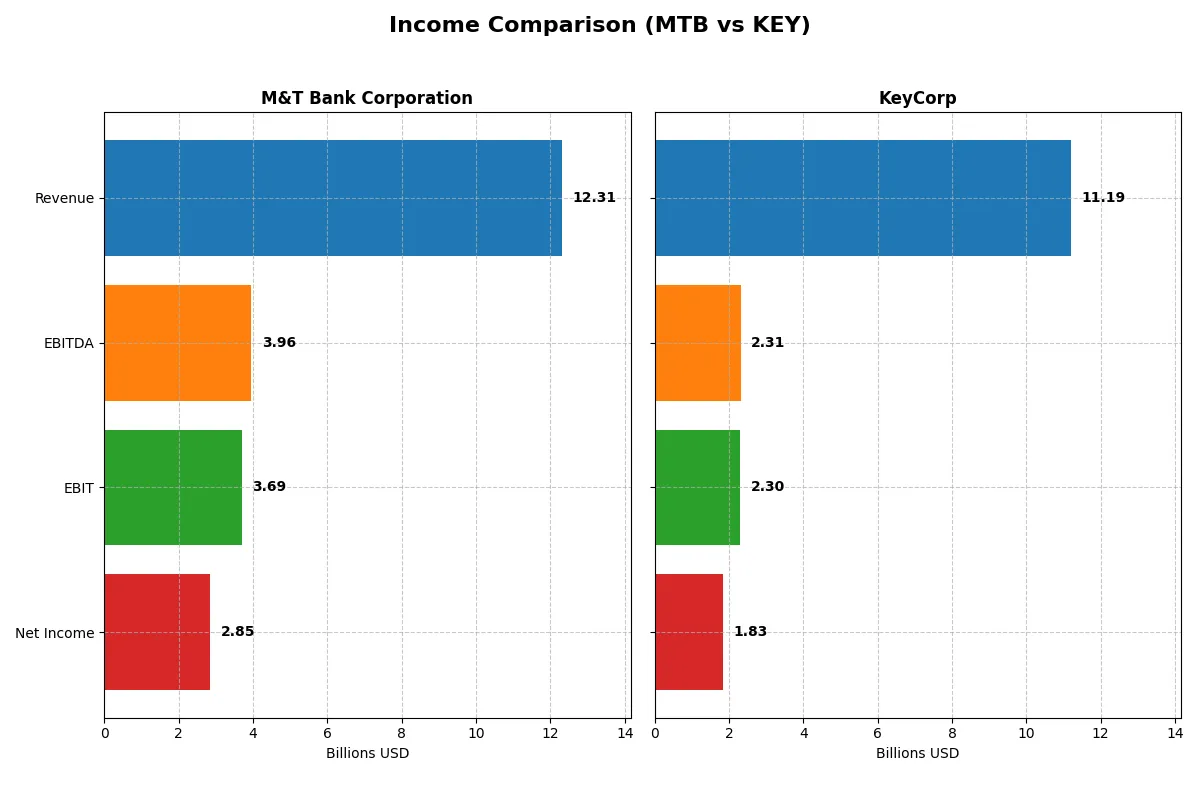
This data dissects the core profitability and scalability of both corporate engines, revealing who dominates the bottom line in the most recent fiscal year:
| Metric | M&T Bank Corporation (MTB) | KeyCorp (KEY) |
|---|---|---|
| Revenue | 12.3B | 11.2B |
| Cost of Revenue | 3.12B | 4.22B |
| Operating Expenses | 5.49B | 4.66B |
| Gross Profit | 9.19B | 6.97B |
| EBITDA | 3.96B | 2.32B |
| EBIT | 3.69B | 2.30B |
| Interest Expense | 3.54B | 3.75B |
| Net Income | 2.85B | 1.83B |
| EPS | 17.1 | 1.66 |
| Fiscal Year | 2025 | 2025 |
Income Statement Analysis: The Bottom-Line Duel
This income statement comparison reveals each bank’s operational efficiency and profitability momentum over recent years.
M&T Bank Corporation Analysis
M&T Bank’s revenue grew robustly over 2021-2025, peaking at $13.4B in 2024 before a slight dip to $12.3B in 2025. Net income rose steadily, reaching $2.73B in 2025, supported by strong gross margins of 74.6% and net margins above 23%. The bank improved EBIT by 11.5% year-over-year, demonstrating operational resilience despite a modest revenue decline.
KeyCorp Analysis
KeyCorp posted significant revenue growth of 23.6% in 2025, reaching $11.2B from $9.1B the prior year. Gross margin expanded sharply to 62.3%, and EBIT surged over 850%, signaling strong operational leverage. However, net income remains below 2021 levels at $1.72B, reflecting margin compression and historically volatile profitability despite recent momentum.
Margin Strength vs. Growth Momentum
M&T Bank delivers a steadier profit profile with higher margins and consistent net income growth, reflecting efficient cost control. In contrast, KeyCorp shows impressive top-line and EBIT acceleration but struggles with net margin sustainability. For investors prioritizing stable profitability, M&T’s disciplined margin profile appears more attractive.
Financial Ratios Comparison
These vital ratios act as a diagnostic tool to expose underlying fiscal health, valuation premiums, and capital efficiency for these financial institutions:
| Ratios | M&T Bank Corporation (MTB) | KeyCorp (KEY) |
|---|---|---|
| ROE | 9.77% | 8.97% |
| ROIC | 6.75% | 5.83% |
| P/E | 11.54 | 12.36 |
| P/B | 1.13 | 1.11 |
| Current Ratio | 0.32 | 0.77 |
| Quick Ratio | 0.32 | 0.77 |
| D/E | 0.45 | 0.54 |
| Debt-to-Assets | 6.12% | 5.97% |
| Interest Coverage | 1.04 | 0.61 |
| Asset Turnover | 0.058 | 0.061 |
| Fixed Asset Turnover | 0 | 17.82 |
| Payout ratio | 32.65% | 49.10% |
| Dividend yield | 2.83% | 3.97% |
| Fiscal Year | 2025 | 2025 |
Efficiency & Valuation Duel: The Vital Signs
Ratios act as the company’s DNA, uncovering hidden risks and operational excellence that define investment potential.
M&T Bank Corporation
M&T Bank shows a decent net margin at 23.16% but a modest ROE of 9.77%, signaling moderate profitability. Its P/E at 11.54 and P/B at 1.13 indicate a fairly valued stock. The 2.83% dividend yield rewards shareholders, balancing moderate returns with cautious capital allocation.
KeyCorp
KeyCorp posts a lower net margin of 16.35% and an ROE of 8.97%, reflecting restrained profitability. Its P/E of 12.36 and P/B of 1.11 suggest a neutral valuation. A higher dividend yield at 3.97% offers attractive income, supported by stable operational efficiency despite some leverage concerns.
Valuation Stability vs. Income Appeal
M&T Bank offers a better margin profile with a slightly more favorable valuation, while KeyCorp provides stronger dividend income. M&T suits investors prioritizing operational strength; KeyCorp fits those seeking higher yield with balanced risk.
Which one offers the Superior Shareholder Reward?
I compare M&T Bank Corporation (MTB) and KeyCorp (KEY) on dividends and buybacks. MTB yields 2.83% with a 33% payout ratio, showing sustainable dividend coverage and consistent buybacks. KEY yields 3.97% but with a 49% payout ratio and volatile buybacks. MTB’s disciplined capital allocation and healthier free cash flow coverage give it a more reliable total return profile in 2026. I favor MTB for superior long-term shareholder reward.
Comparative Score Analysis: The Strategic Profile
The radar chart reveals the fundamental DNA and trade-offs shaping the financial profiles of M&T Bank Corporation and KeyCorp:
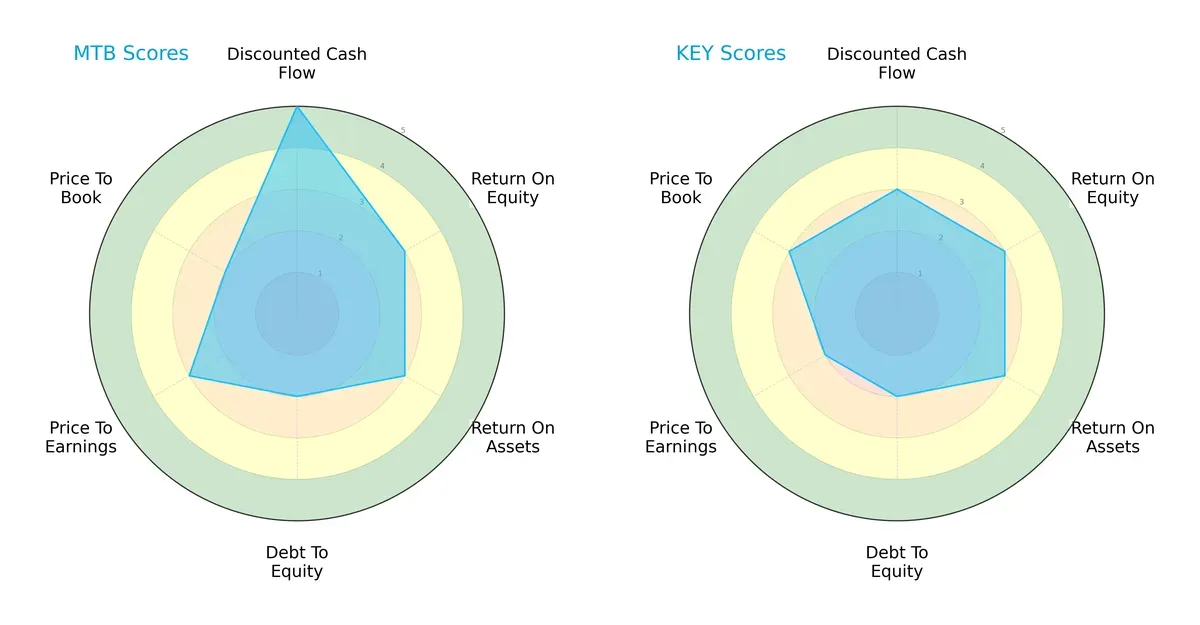
M&T Bank leads with a very favorable discounted cash flow score (5 vs. 3), signaling better valuation based on future cash flows. Both firms show moderate returns on equity and assets (3 each), reflecting similar operational efficiency. Debt-to-equity scores are identical (2), indicating comparable leverage risk. KeyCorp edges M&T slightly on price-to-book (3 vs. 2), suggesting a more attractive book value valuation. Overall, M&T offers a more balanced profile with a clear strength in cash flow, while KeyCorp relies more on valuation multiples.
Bankruptcy Risk: Solvency Showdown
The Altman Z-Score comparison highlights material distress signals for both banks in this economic cycle:
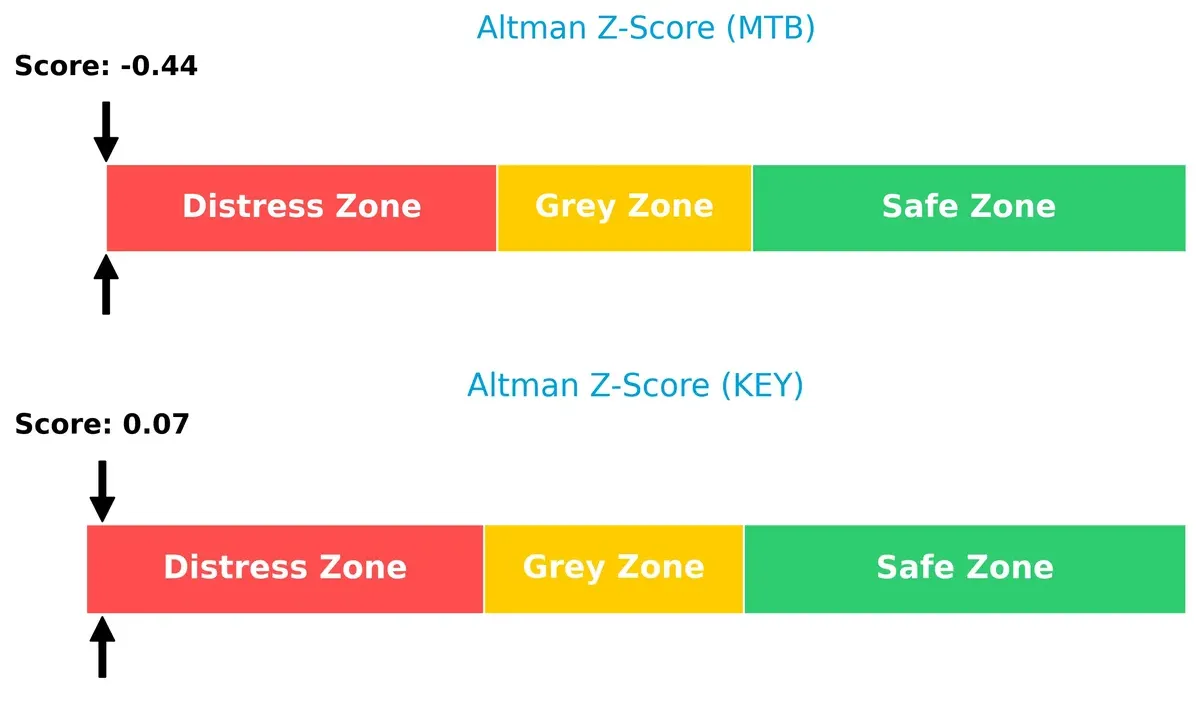
M&T Bank’s score of -0.44 places it deep in the distress zone, raising serious concerns about its long-term solvency. KeyCorp, with a slightly higher score of 0.07, also remains in distress but marginally less vulnerable. Historically, banks in this range face significant default risks during downturns, demanding cautious exposure from investors.
Financial Health: Quality of Operations
Piotroski F-Scores reveal the internal financial robustness of both banks:
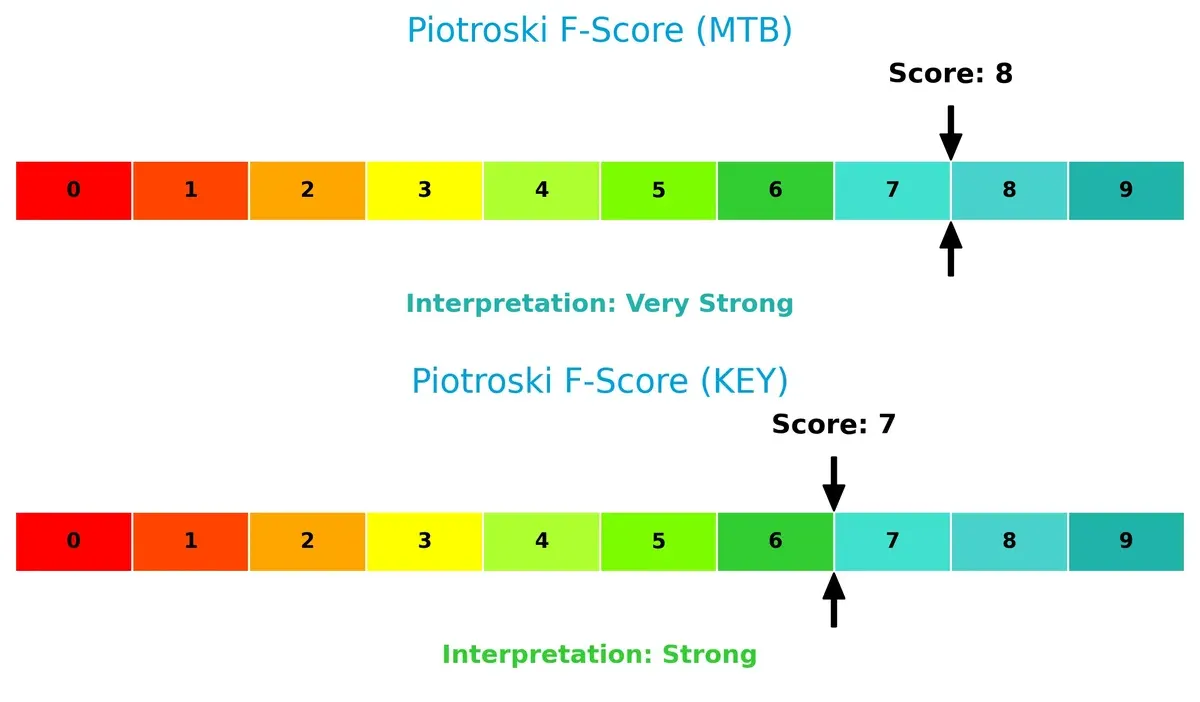
M&T Bank scores an impressive 8, indicating very strong financial health and operational quality. KeyCorp follows closely with a 7, signaling strong but slightly less resilient fundamentals. Neither firm shows red flags, but M&T’s higher score suggests superior profitability, liquidity, and efficiency metrics, making it the safer operational bet.
How are the two companies positioned?
This section dissects MTB and KEY’s operational DNA by comparing revenue distribution by segment and internal strengths and weaknesses. The goal is to confront their economic moats to identify which model delivers the most resilient and sustainable competitive advantage today.
Revenue Segmentation: The Strategic Mix
The following visual comparison dissects how M&T Bank Corporation and KeyCorp diversify their income streams and where their primary sector bets lie:
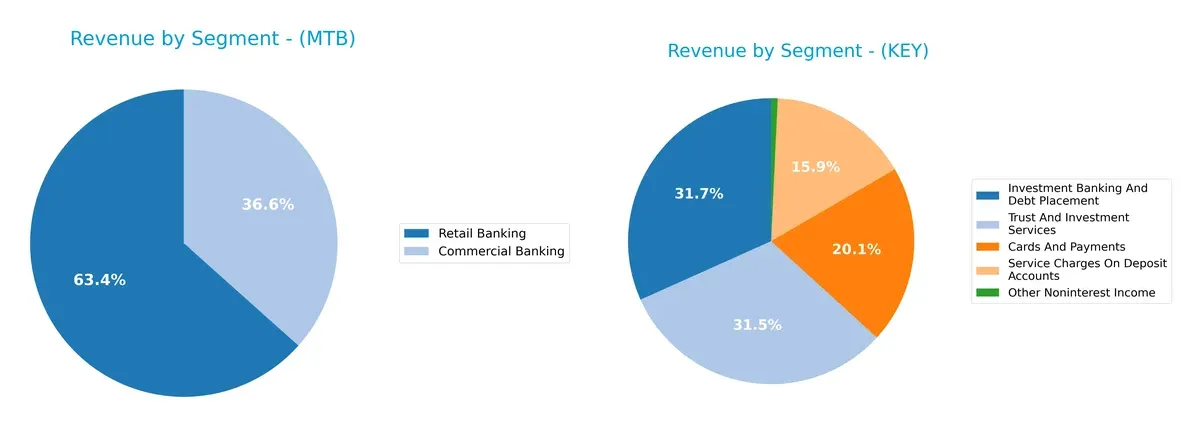
M&T Bank anchors its revenue in Retail Banking at $471M and Commercial Banking at $272M, showing moderate diversification within core banking services. In contrast, KeyCorp splits its 2024 revenue across Investment Banking ($521M), Trust Services ($518M), Cards and Payments ($331M), and Service Charges ($261M), reflecting a broader, more balanced mix. KeyCorp’s diversification reduces concentration risk, while M&T’s focus may leverage deep sector expertise but risks volatility from narrower exposure.
Strengths and Weaknesses Comparison
This table compares the strengths and weaknesses of M&T Bank Corporation (MTB) and KeyCorp (KEY):
MTB Strengths
- Diverse revenue streams including commercial, retail, fiduciary, and mortgage banking
- Favorable net margin of 23.16%
- Low debt to assets at 6.12%
- Favorable price-to-earnings (11.54) and price-to-book (1.13) ratios
- Dividend yield at 2.83% supports shareholder returns
KEY Strengths
- Broad revenue base with cards, payments, investment banking, and trust services
- Favorable net margin of 16.35%
- Strong fixed asset turnover at 17.82 indicates efficient asset use
- Favorable price-to-earnings (12.36) and price-to-book (1.11) ratios
- Higher dividend yield at 3.97%
MTB Weaknesses
- Unfavorable return on equity (9.77%) below cost of capital (WACC 10.43%)
- Very low current and quick ratios (0.32) signal liquidity concerns
- Interest coverage barely above 1, indicating risk managing debt costs
- Low asset turnover ratios reduce operational efficiency
KEY Weaknesses
- Return on equity (8.97%) below WACC (14.27%), raising capital allocation concerns
- Current and quick ratios (0.77) remain weak for liquidity
- Low interest coverage ratio (0.61) heightens risk of difficulty covering interest expenses
- Asset turnover low at 0.06, signaling inefficiency
Overall, MTB shows stronger profitability margins and conservative leverage but suffers from liquidity and efficiency challenges. KEY demonstrates efficient asset use and stronger dividend yield but faces greater cost of capital and liquidity risks. Both banks must balance operational efficiency with prudent capital and liquidity management in their strategies.
The Moat Duel: Analyzing Competitive Defensibility
A structural moat is the only true defense against profit erosion from competition over the long term. Let’s dissect how M&T Bank and KeyCorp protect their earnings:
M&T Bank Corporation: Intangible Assets and Relationship Moat
M&T leverages deep client relationships and regional brand strength, evident in stable margins despite revenue dips. Yet, declining ROIC signals rising competitive pressure in 2026.
KeyCorp: Cost Advantage with Expanding Scale
KeyCorp contrasts with M&T by aggressively growing revenue and margins, driven by operational efficiency. Still, its deteriorating ROIC warns of value destruction despite recent growth bursts.
Verdict: Relationship Intangibles vs. Cost Efficiency Battle
Both firms destroy value with falling ROIC, but M&T’s intangible asset moat offers more durable profit defense. I see M&T better positioned to sustain market share amid rising competition.
Which stock offers better returns?
Over the past year, both M&T Bank Corporation and KeyCorp showed strong bullish trends with accelerating price gains, reflecting robust investor demand and notable price appreciation.
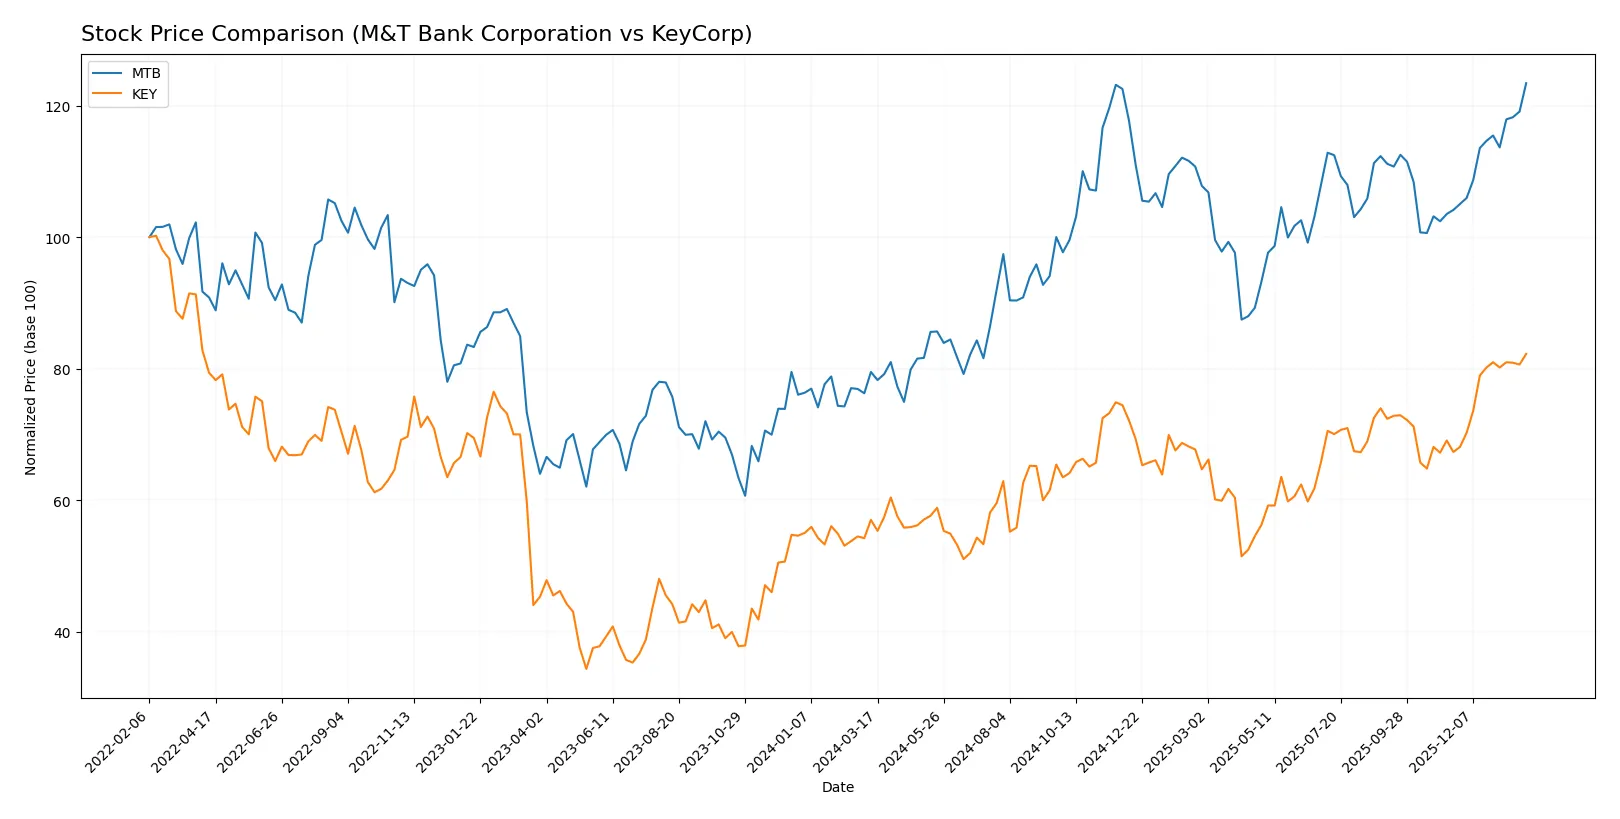
Trend Comparison
M&T Bank Corporation’s stock rose 55.23% over the last 12 months, marking a bullish trend with accelerating momentum and notable volatility at a 21.88% standard deviation. The price ranged from a low of 134.56 to a high of 221.57.
KeyCorp’s stock gained 44.24% in the same period, also bullish and accelerating, but with much lower volatility at a 2.0% standard deviation. Its price moved between 13.36 and 21.52.
M&T Bank outperformed KeyCorp by over 10% in price appreciation, delivering the highest market performance despite higher volatility during the analyzed period.
Target Prices
Analysts present a moderately bullish consensus for M&T Bank Corporation and KeyCorp, reflecting cautious optimism in regional banks.
| Company | Target Low | Target High | Consensus |
|---|---|---|---|
| M&T Bank Corporation | 208 | 255 | 230.8 |
| KeyCorp | 18 | 25 | 23.38 |
M&T’s consensus target of 230.8 suggests a 4% upside from the current 221.57 price. KeyCorp’s 23.38 target implies about 9% potential gain versus today’s 21.52 price. The targets reflect steady confidence despite banking sector volatility.

Don’t Let Luck Decide Your Entry Point
Optimize your entry points with our advanced ProRealTime indicators. You’ll get efficient buy signals with precise price targets for maximum performance. Start outperforming now!
How do institutions grade them?
The following tables summarize the latest institutional grades for M&T Bank Corporation and KeyCorp:
M&T Bank Corporation Grades
This table shows recent analyst grades and actions from key grading firms for M&T Bank Corporation.
| Grading Company | Action | New Grade | Date |
|---|---|---|---|
| RBC Capital | maintain | Outperform | 2026-01-20 |
| Jefferies | maintain | Buy | 2026-01-16 |
| Wolfe Research | downgrade | Peer Perform | 2026-01-07 |
| TD Cowen | maintain | Buy | 2026-01-07 |
| B of A Securities | downgrade | Neutral | 2026-01-07 |
| Evercore ISI Group | downgrade | In Line | 2026-01-06 |
| Barclays | maintain | Equal Weight | 2026-01-05 |
| Keefe, Bruyette & Woods | maintain | Market Perform | 2025-12-17 |
| Truist Securities | downgrade | Hold | 2025-12-12 |
| TD Cowen | maintain | Buy | 2025-10-20 |
KeyCorp Grades
Below is a summary of recent analyst grades and rating adjustments for KeyCorp.
| Grading Company | Action | New Grade | Date |
|---|---|---|---|
| Truist Securities | maintain | Hold | 2026-01-26 |
| TD Cowen | maintain | Buy | 2026-01-07 |
| Baird | downgrade | Underperform | 2026-01-06 |
| Barclays | maintain | Equal Weight | 2026-01-05 |
| Truist Securities | maintain | Hold | 2025-12-22 |
| Keefe, Bruyette & Woods | maintain | Outperform | 2025-12-17 |
| DA Davidson | maintain | Buy | 2025-12-10 |
| Truist Securities | maintain | Hold | 2025-10-17 |
| DA Davidson | maintain | Buy | 2025-10-17 |
| UBS | maintain | Buy | 2025-10-07 |
Which company has the best grades?
M&T Bank displays a mix of Outperform and Buy ratings but also several downgrades to Neutral and Hold. KeyCorp maintains more consistent Buy and Hold ratings with fewer downgrades. Investors may see KeyCorp’s steadier grades as a sign of more stable analyst sentiment.
Risks specific to each company
The following categories identify the critical pressure points and systemic threats facing both firms in the 2026 market environment:
1. Market & Competition
M&T Bank Corporation
- Strong regional presence but faces intense competition from larger banks and fintech startups.
KeyCorp
- Broader geographic footprint but higher competition in diverse markets pressures margins.
2. Capital Structure & Debt
M&T Bank Corporation
- Moderate debt-to-equity ratio (0.45) with favorable debt management but weak interest coverage (1.04).
KeyCorp
- Slightly higher leverage (0.54) and weaker interest coverage (0.61) increase refinancing risk.
3. Stock Volatility
M&T Bank Corporation
- Low beta (0.58) indicates lower stock volatility and market sensitivity.
KeyCorp
- Higher beta (1.08) suggests greater stock price fluctuations and market risk.
4. Regulatory & Legal
M&T Bank Corporation
- Subject to stringent US banking regulations; regional focus limits regulatory complexity.
KeyCorp
- Operates in 15 states, increasing regulatory compliance costs and legal exposure.
5. Supply Chain & Operations
M&T Bank Corporation
- Relies on traditional banking channels with gradual digital transition risks.
KeyCorp
- Invests heavily in digital platforms but faces operational risks from integration and legacy systems.
6. ESG & Climate Transition
M&T Bank Corporation
- Moderate ESG focus with exposure to fossil-fuel-related commercial loans.
KeyCorp
- Increasing commitment to green financing but still exposed to carbon-intensive sectors.
7. Geopolitical Exposure
M&T Bank Corporation
- Primarily US-centric operations limit geopolitical risk but constrain growth.
KeyCorp
- US focus with some exposure to macroeconomic shifts across multiple states.
Which company shows a better risk-adjusted profile?
M&T Bank’s most impactful risk is its weak interest coverage and poor liquidity ratios, signaling refinancing and short-term liquidity risks. KeyCorp faces greater stock volatility and weaker interest coverage, raising financial stability concerns. However, KeyCorp’s stronger operational diversification and digital investments provide a more balanced risk-adjusted profile. Notably, M&T’s Altman Z-Score in the distress zone (-0.44) versus KeyCorp’s marginally better score (0.07) underlines M&T’s elevated financial distress risk in 2026.
Final Verdict: Which stock to choose?
M&T Bank Corporation’s superpower lies in its resilient profitability and disciplined capital allocation. It operates as a cash machine with solid net margins and favorable valuation multiples. However, its liquidity ratios signal a point of vigilance, suggesting tighter working capital management is needed. MTB suits aggressive growth portfolios willing to navigate short-term liquidity risks for long-term value.
KeyCorp’s strategic moat is found in its more stable asset turnover and higher dividend yield, appealing to investors favoring income and operational consistency. While its value creation is challenged, it offers better balance sheet safety compared to MTB. KEY fits well within GARP portfolios that seek growth tempered by reasonable risk controls.
If you prioritize robust profitability and market momentum, MTB outshines due to its superior cash generation and valuation appeal despite liquidity concerns. However, if you seek steadier dividend income and a more conservative risk profile, KEY offers better stability and a strategic moat that commands a premium for income-focused investors. Both stocks require careful monitoring of their value destruction trends.
Disclaimer: Investment carries a risk of loss of initial capital. The past performance is not a reliable indicator of future results. Be sure to understand risks before making an investment decision.
Go Further
I encourage you to read the complete analyses of M&T Bank Corporation and KeyCorp to enhance your investment decisions: