Unilever PLC and Kenvue Inc. stand as prominent players in the Household & Personal Products industry, each with distinct market footprints and innovation strategies. Unilever, a century-old giant, offers a broad portfolio from foods to personal care, while Kenvue, a newer spin-off, focuses on consumer health and beauty products. This comparison aims to help investors discern which company aligns better with their portfolio goals in today’s evolving market landscape. Let’s explore which one presents the most compelling investment opportunity.
Table of contents
Companies Overview
I will begin the comparison between Unilever PLC and Kenvue Inc. by providing an overview of these two companies and their main differences.
Unilever PLC Overview
Unilever PLC is a global fast-moving consumer goods company headquartered in London, UK. It operates through Beauty & Personal Care, Foods & Refreshment, and Home Care segments, offering a diverse portfolio including skin care, hair care, ice cream, soups, cleaning products, and more. Founded in 1894, Unilever is a well-established player in the household and personal products industry with a market cap of 140.6B USD.
Kenvue Inc. Overview
Kenvue Inc., incorporated in 2022 and based in Skillman, New Jersey, operates as a consumer health company worldwide. It is a subsidiary of Johnson & Johnson and manages three segments: Self Care, Skin Health and Beauty, and Essential Health. Kenvue offers products under brands like Tylenol, Neutrogena, and Listerine. Its market cap stands at 32.6B USD, reflecting its more recent establishment in the consumer defensive sector.
Key similarities and differences
Both Unilever and Kenvue operate in the consumer defensive sector focusing on household and personal products, with strong brand portfolios in health, beauty, and care categories. However, Unilever has a broader product mix including food and home care, while Kenvue concentrates primarily on consumer health products. Unilever is a long-established multinational with a larger workforce and market cap, contrasting with Kenvue’s more recent market entry and smaller scale.
Income Statement Comparison
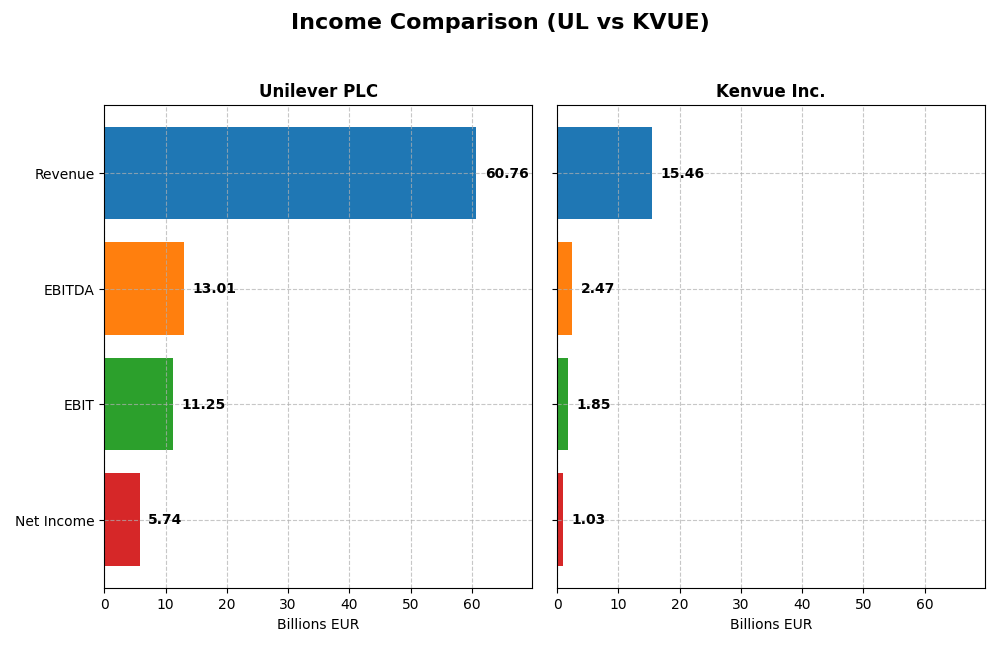
This table presents a side-by-side comparison of key income statement metrics for Unilever PLC and Kenvue Inc. for the fiscal year 2024, providing a snapshot of their financial performance.
| Metric | Unilever PLC (UL) | Kenvue Inc. (KVUE) |
|---|---|---|
| Market Cap | 141B EUR | 33B USD |
| Revenue | 60.8B EUR | 15.5B USD |
| EBITDA | 13.0B EUR | 2.47B USD |
| EBIT | 11.3B EUR | 1.85B USD |
| Net Income | 5.74B EUR | 1.03B USD |
| EPS | 2.30 EUR | 0.54 USD |
| Fiscal Year | 2024 | 2024 |
Income Statement Interpretations
Unilever PLC
Unilever PLC’s revenue showed a steady increase from 50.7B EUR in 2020 to 60.8B EUR in 2024, reflecting a favorable overall growth of 19.8%. Net income, however, was more volatile, peaking at 7.6B EUR in 2022 before declining to 5.7B EUR in 2024. Margins remained generally favorable, though net margin contracted by 14.1% over the period. The latest year saw slower revenue growth at 1.9% and a net margin decline, signaling margin pressure despite a solid EBIT improvement.
Kenvue Inc.
Kenvue Inc. experienced modest revenue growth from 14.5B USD in 2020 to 15.5B USD in 2024, a neutral 6.8% increase. Net income surged significantly, rising from a loss of 879M USD in 2020 to a profit of 1.0B USD in 2024, with margins improving notably over the period. However, 2024 saw earnings decline sharply with net income down 38.2% and EBIT falling 27.6%, indicating short-term profitability challenges despite favorable longer-term margin expansion.
Which one has the stronger fundamentals?
Unilever demonstrates stable revenue growth and consistently favorable margins, though recent declines in net income and margins suggest emerging challenges. Kenvue shows impressive net income and margin improvements over the longer term but faces significant earnings contraction in the latest year. Both companies have favorable income statement evaluations, with Unilever showing greater revenue stability and Kenvue exhibiting stronger net income growth, reflecting different fundamental strengths and short-term risks.
Financial Ratios Comparison
The following table presents a side-by-side comparison of key financial ratios for Unilever PLC and Kenvue Inc. based on their most recent fiscal year data (2024).
| Ratios | Unilever PLC (UL) | Kenvue Inc. (KVUE) |
|---|---|---|
| ROE | 28.7% | 10.7% |
| ROIC | 11.1% | 6.2% |
| P/E | 23.9 | 39.4 |
| P/B | 6.9 | 4.2 |
| Current Ratio | 0.76 | 0.96 |
| Quick Ratio | 0.56 | 0.69 |
| D/E | 1.53 | 0.90 |
| Debt-to-Assets | 38.4% | 34.1% |
| Interest Coverage | 8.41 | 4.27 |
| Asset Turnover | 0.76 | 0.60 |
| Fixed Asset Turnover | 5.21 | 8.36 |
| Payout Ratio | 75.2% | 150.7% |
| Dividend Yield | 3.14% | 3.83% |
Interpretation of the Ratios
Unilever PLC
Unilever exhibits a mix of strengths and weaknesses in its ratios. The company shows favorable returns on equity (28.73%) and invested capital (11.12%), supported by a low WACC of 4.42%. However, liquidity ratios like current (0.76) and quick ratios (0.56) are weak, and the price-to-book ratio (6.87) is unfavorable, indicating potential valuation concerns. Unilever pays dividends with a 3.14% yield, reflecting a stable shareholder return policy, but investors should watch for payout sustainability given some liquidity pressures.
Kenvue Inc.
Kenvue’s financial ratios reveal neutral to slightly unfavorable conditions. Its net margin (6.66%) and returns on equity (10.65%) and invested capital (6.25%) are moderate, while the WACC at 5.83% remains favorable. The company struggles with liquidity ratios below 1 and a high PE of 39.38, which is unfavorable. Kenvue offers a 3.83% dividend yield, suggesting ongoing shareholder returns, but elevated valuation multiples and liquidity metrics warrant attention.
Which one has the best ratios?
Comparing the two, Unilever presents a slightly more favorable overall ratio profile, with stronger profitability and capital efficiency metrics despite some liquidity weaknesses. Kenvue’s ratios are more mixed, with neutral profitability and less favorable valuation multiples. Both companies show dividend yields above 3%, but Unilever’s higher return metrics give it a relative edge in ratio strength.
Strategic Positioning
This section compares the strategic positioning of Unilever PLC and Kenvue Inc. including market position, key segments, and exposure to disruption:
Unilever PLC
- Large market cap of 140.6B with established competitive presence in fast-moving consumer goods.
- Diversified segments: Beauty & Personal Care, Foods & Refreshment, Home Care drive business.
- Exposure primarily in traditional FMCG sectors with moderate technological disruption risk.
Kenvue Inc.
- Market cap of 32.6B, operating as a consumer health subsidiary of Johnson & Johnson.
- Focused on Self Care, Skin Health & Beauty, and Essential Health segments with strong brand names.
- Operates in consumer health with potential disruption from evolving health product technologies.
Unilever PLC vs Kenvue Inc. Positioning
Unilever demonstrates a diversified portfolio across multiple consumer goods segments, providing broad market exposure. Kenvue concentrates on consumer health, leveraging strong brands but with narrower business scope and reliance on parent company support.
Which has the best competitive advantage?
Unilever shows a slightly favorable moat with value creation despite declining profitability. Kenvue also has a slightly favorable moat but currently sheds value, though its profitability is improving, indicating emerging competitive strength.
Stock Comparison
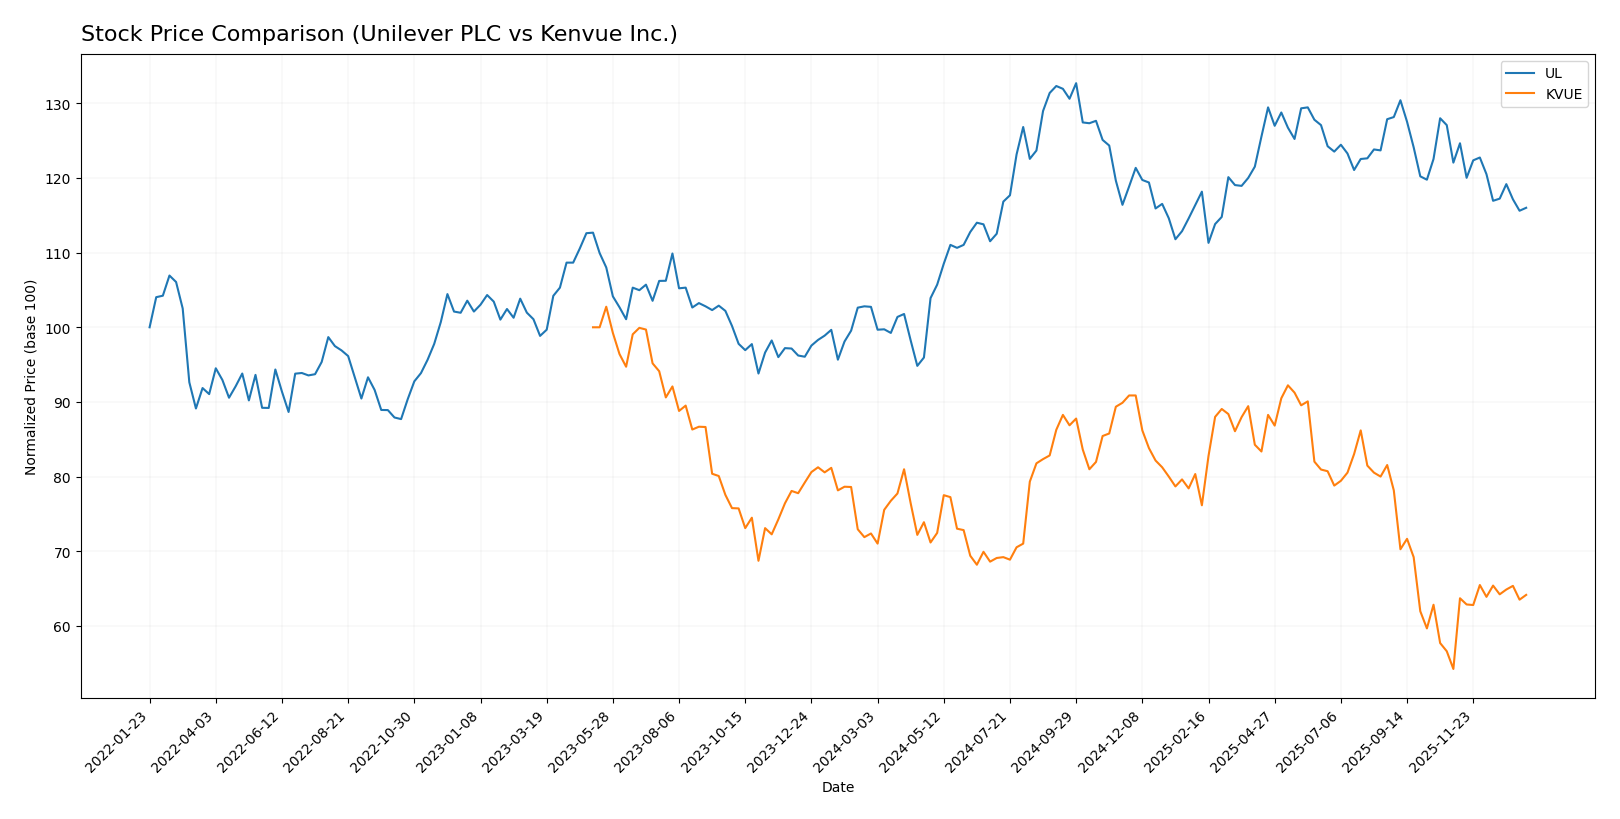
The stock prices of Unilever PLC (UL) and Kenvue Inc. (KVUE) have shown contrasting movements over the past 12 months, with UL exhibiting a bullish trend and KVUE a bearish one, while recent months indicate shifts in momentum for both.
Trend Analysis
Unilever PLC’s stock rose by 12.92% over the past year, indicating a bullish trend with deceleration in price gains and a high volatility level (std deviation 4.86). The stock peaked at 73.69 and bottomed at 52.66.
Kenvue Inc.’s stock declined by 11.37% over the past year, reflecting a bearish trend with accelerating downward momentum and moderate volatility (std deviation 2.47). The highest price reached was 24.44 and the lowest 14.37.
Comparing the two, Unilever PLC delivered the highest market performance with a positive 12.92% price change, while Kenvue Inc. experienced an 11.37% decline over the same period.
Target Prices
Here is the target price consensus from verified analysts for Unilever PLC and Kenvue Inc.
| Company | Target High | Target Low | Consensus |
|---|---|---|---|
| Unilever PLC | 71.00 | 60.10 | 65.55 |
| Kenvue Inc. | 23.00 | 15.00 | 18.57 |
Analysts expect Unilever’s stock to trade slightly above its current price of 64.42 USD, indicating moderate upside potential. Kenvue’s consensus target of 18.57 USD also suggests modest growth from its current 17 USD level.
Analyst Opinions Comparison
This section compares analysts’ ratings and grades for Unilever PLC and Kenvue Inc.:
Rating Comparison
Unilever PLC Rating
- Rating: B+, considered very favorable overall.
- Discounted Cash Flow Score: 5, very favorable.
- ROE Score: 5, very favorable indicating strong profit generation from equity.
- ROA Score: 4, favorable asset utilization.
- Debt To Equity Score: 1, very unfavorable, indicating higher financial risk.
- Overall Score: 3, moderate overall financial standing.
Kenvue Inc. Rating
- Rating: B+, also considered very favorable.
- Discounted Cash Flow Score: 4, favorable.
- ROE Score: 4, favorable profit generation efficiency.
- ROA Score: 4, favorable asset utilization.
- Debt To Equity Score: 2, moderate risk, better than Unilever.
- Overall Score: 3, moderate overall financial standing.
Which one is the best rated?
Both Unilever and Kenvue share the same overall rating of B+ and overall score of 3, indicating moderate financial standing. Unilever scores higher on DCF and ROE but has a weaker debt-to-equity position than Kenvue, which shows better financial stability.
Scores Comparison
Here is a comparison of the Altman Z-Score and Piotroski Score for both companies:
UL Scores
- Altman Z-Score: 4.85, indicating a safe zone with low bankruptcy risk.
- Piotroski Score: 6, showing average financial strength for value investing.
KVUE Scores
- Altman Z-Score: 1.95, placing it in the grey zone with moderate bankruptcy risk.
- Piotroski Score: 5, reflecting average financial strength for value investing.
Which company has the best scores?
UL has a higher Altman Z-Score in the safe zone versus KVUE’s grey zone score. Both have similar average Piotroski Scores, with UL slightly ahead at 6 compared to 5.
Grades Comparison
Here is a detailed comparison of the recent grades assigned to Unilever PLC and Kenvue Inc.:
Unilever PLC Grades
This table summarizes the latest grades and actions from notable grading companies for Unilever PLC.
| Grading Company | Action | New Grade | Date |
|---|---|---|---|
| Erste Group | Downgrade | Hold | 2024-11-19 |
| B of A Securities | Upgrade | Buy | 2024-08-22 |
| JP Morgan | Upgrade | Overweight | 2024-05-23 |
| Argus Research | Maintain | Buy | 2024-05-08 |
| Morgan Stanley | Downgrade | Underweight | 2024-02-27 |
| Bernstein | Upgrade | Market Perform | 2022-03-14 |
| Bernstein | Upgrade | Market Perform | 2022-03-13 |
| Bernstein | Upgrade | Market Perform | 2021-11-01 |
| Bernstein | Upgrade | Market Perform | 2021-10-31 |
| Deutsche Bank | Downgrade | Hold | 2021-09-16 |
Overall, Unilever’s grades show a mixed trend with several upgrades balanced by some recent downgrades, resulting in a general consensus of “Hold.”
Kenvue Inc. Grades
This table presents the recent grades and updates from recognized grading firms for Kenvue Inc.
| Grading Company | Action | New Grade | Date |
|---|---|---|---|
| Barclays | Maintain | Equal Weight | 2025-11-10 |
| Canaccord Genuity | Downgrade | Hold | 2025-10-29 |
| Jefferies | Maintain | Buy | 2025-10-27 |
| JP Morgan | Maintain | Overweight | 2025-10-10 |
| Citigroup | Maintain | Neutral | 2025-10-09 |
| B of A Securities | Maintain | Buy | 2025-10-08 |
| UBS | Maintain | Neutral | 2025-10-08 |
| Goldman Sachs | Maintain | Neutral | 2025-10-02 |
| Barclays | Maintain | Equal Weight | 2025-10-01 |
| Rothschild & Co | Upgrade | Buy | 2025-09-26 |
Kenvue’s grades largely indicate stability with multiple “Buy” and “Overweight” ratings, and no recent downgrades to sell ratings, reflecting a consensus of “Hold.”
Which company has the best grades?
Between the two, Kenvue Inc. has received relatively stronger and more stable grades with consistent Buy and Overweight ratings, while Unilever PLC shows a balance of upgrades and downgrades mostly centered around Hold. This difference could influence investors’ perception of risk and confidence in near-term performance.
Strengths and Weaknesses
Below is a comparative table highlighting key strengths and weaknesses of Unilever PLC and Kenvue Inc. based on the latest financial and strategic data.
| Criterion | Unilever PLC (UL) | Kenvue Inc. (KVUE) |
|---|---|---|
| Diversification | Highly diversified across consumer goods | Focused on health and beauty segments |
| Profitability | Strong profitability with ROIC 11.12%, ROE 28.73% | Moderate profitability, improving ROIC 6.25%, ROE 10.65% |
| Innovation | Moderate innovation, stable product portfolio | Growing innovation with increasing ROIC trend |
| Global presence | Extensive global footprint | Expanding global reach, but smaller scale |
| Market Share | Established market leader in multiple sectors | Emerging player with growing market share |
Unilever offers a stable and diversified investment with solid profitability, though its ROIC has been declining. Kenvue, while currently less profitable, shows promising growth in profitability and innovation, signaling potential future value creation. Investors should weigh stability versus growth potential carefully.
Risk Analysis
Below is a comparative risk table for Unilever PLC (UL) and Kenvue Inc. (KVUE) based on the latest 2024 financial and operational data.
| Metric | Unilever PLC (UL) | Kenvue Inc. (KVUE) |
|---|---|---|
| Market Risk | Low beta 0.223; stable consumer staples sector | Moderate beta 0.552; more volatility in consumer health |
| Debt level | DE 1.53 (unfavorable); debt-to-assets 38.44% (neutral) | DE 0.9 (neutral); debt-to-assets 34.06% (neutral) |
| Regulatory Risk | Moderate, global FMCG regulations, sustainability demands | Moderate, healthcare regulations and product approvals |
| Operational Risk | Large scale operations with 116K employees; supply chain complexity | Mid-size with 22K employees; integration risks post spin-off |
| Environmental Risk | Increasing pressure to reduce footprint; sustainability initiatives active | Emerging focus on eco-friendly products; moderate current risk |
| Geopolitical Risk | Exposure to multiple markets including emerging economies | US-centric with some global exposure; lower geopolitical risk |
In synthesis, Unilever’s most impactful risk lies in its relatively high debt level and operational complexities given its size, despite a very stable market position. Kenvue faces moderate market volatility and integration risks as a newer independent company, with debt levels more manageable but regulatory scrutiny in healthcare segments significant. Both companies maintain solid financial health but require vigilance on debt and regulatory environments.
Which Stock to Choose?
Unilever PLC (UL) shows a generally favorable income statement with strong profitability metrics, including a 28.7% ROE and 11.1% ROIC, despite a slight decline in ROIC trend. Its financial ratios are slightly favorable overall, though liquidity and valuation ratios appear less strong. The company maintains a very favorable B+ rating and is considered a value creator with a safe Altman Z-score.
Kenvue Inc. (KVUE) presents a favorable income statement with significant net income growth over the period, though recent yearly growth is weak. Its financial ratios are slightly unfavorable overall, with moderate ratings and neutral profitability metrics. KVUE’s ROIC is below WACC but shows a strong upward trend, indicating improving profitability, supported by a moderate B+ rating and a grey-zone Altman Z-score.
For investors prioritizing established value creation and stable profitability, Unilever’s profile could appear more attractive, while those focused on potential growth and improving profitability might find Kenvue’s improving ROIC and income growth of interest. The choice might depend on an investor’s risk tolerance and strategy focus.
Disclaimer: Investment carries a risk of loss of initial capital. The past performance is not a reliable indicator of future results. Be sure to understand risks before making an investment decision.
Go Further
I encourage you to read the complete analyses of Unilever PLC and Kenvue Inc. to enhance your investment decisions: