Home > Comparison > Consumer Defensive > PG vs KVUE
The strategic rivalry between The Procter & Gamble Company and Kenvue Inc. defines the current trajectory of the consumer defensive sector. P&G stands as a capital-intensive, diversified household products titan with a global footprint. Kenvue, a newer consumer health specialist, focuses on targeted self-care and skin health segments. This analysis pits broadscale industrial strength against niche innovation to determine which offers superior risk-adjusted returns for a diversified portfolio.
Table of contents
Companies Overview
The Procter & Gamble Company and Kenvue Inc. shape the global household and personal products market with distinct scale and focus.
The Procter & Gamble Company: Consumer Goods Titan
The Procter & Gamble Company dominates as a global leader in branded consumer packaged goods. It generates revenue through five diversified segments, including Beauty, Grooming, and Health Care, with flagship brands like Gillette and Tide. In 2026, its strategic focus remains on innovation and expanding e-commerce to strengthen its market position across mass merchandisers and specialty stores.
Kenvue Inc.: Emerging Health & Beauty Player
Kenvue Inc. operates as a consumer health company specializing in Self Care, Skin Health and Beauty, and Essential Health segments. It earns revenue from iconic brands such as Neutrogena, Tylenol, and Band-Aid. Since its 2023 spin-off, Kenvue emphasizes expanding its brand portfolio and global reach under the leadership of CEO Kirk Perry, targeting growth in essential health and personal care markets.
Strategic Collision: Similarities & Divergences
Both companies target household and personal products but differ philosophically. Procter & Gamble runs a diversified multi-segment powerhouse with deep retail penetration. Kenvue leans on a focused consumer health approach with strong brand specialization. Their primary battleground lies in health and beauty products. Investors face distinct profiles: P&G offers scale and stability, while Kenvue presents a growth-oriented, brand-centric play.
Income Statement Comparison
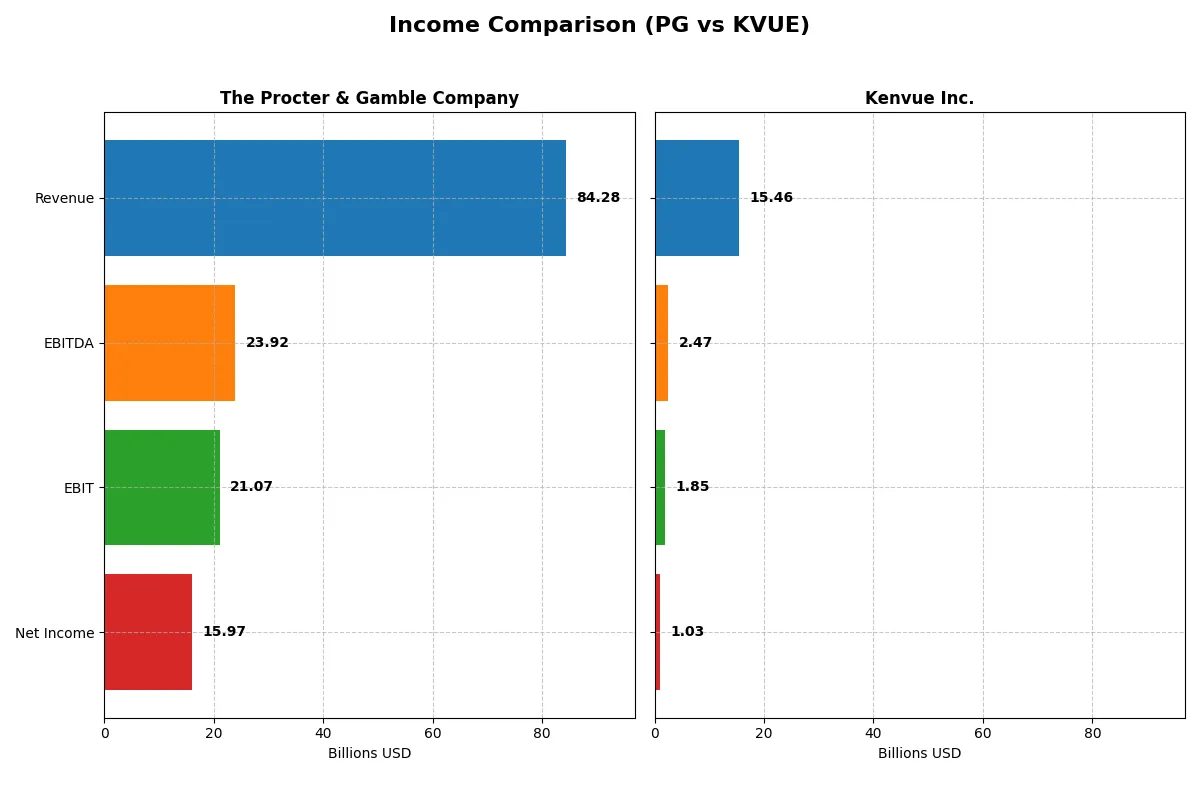
This data dissects the core profitability and scalability of both corporate engines to reveal who dominates the bottom line:
| Metric | The Procter & Gamble Company (PG) | Kenvue Inc. (KVUE) |
|---|---|---|
| Revenue | 84.3B | 15.5B |
| Cost of Revenue | 41.2B | 6.5B |
| Operating Expenses | 22.7B | 7.1B |
| Gross Profit | 43.1B | 8.9B |
| EBITDA | 23.9B | 2.5B |
| EBIT | 21.1B | 1.8B |
| Interest Expense | 0.9B | 0.4B |
| Net Income | 16.0B | 1.0B |
| EPS | 6.67 | 0.54 |
| Fiscal Year | 2025 | 2024 |
Income Statement Analysis: The Bottom-Line Duel
This income statement comparison reveals how effectively each company converts revenue into profit, showcasing their operational efficiency and growth momentum.
The Procter & Gamble Company Analysis
P&G’s revenue grew steadily from 76B in 2021 to 84.3B in 2025. Net income followed suit, rising from 14.3B to nearly 16B. The firm sustains strong gross (51.16%) and net margins (18.95%), reflecting efficient cost control. Despite a slight dip in revenue growth last year (0.29%), EBIT and net margin improved, signaling robust operational momentum.
Kenvue Inc. Analysis
Kenvue’s revenue edged up modestly from 14.5B in 2020 to 15.5B in 2024. Net income rebounded sharply from a loss in 2020 to 1.03B in 2024, reflecting a strong turnaround. The company boasts a higher gross margin (57.97%) but a weaker net margin (6.66%) compared to P&G. However, recent EBIT and net margin contracted significantly, highlighting near-term profitability pressures.
Margin Strength vs. Growth Resilience
P&G leads with superior and stable margins, underpinned by consistent revenue and profit growth over five years. Kenvue shows impressive net income recovery but struggles with margin compression and recent profit declines. For investors, P&G’s profile offers steady profitability, while Kenvue carries higher volatility but notable turnaround potential.
Financial Ratios Comparison
These vital ratios act as a diagnostic tool to expose the underlying fiscal health, valuation premiums, and capital efficiency of the companies compared below:
| Ratios | The Procter & Gamble Company (PG) | Kenvue Inc. (KVUE) |
|---|---|---|
| ROE | 30.7% | 10.7% |
| ROIC | 16.5% | 6.2% |
| P/E | 24.5 | 39.4 |
| P/B | 7.52 | 4.20 |
| Current Ratio | 0.70 | 0.96 |
| Quick Ratio | 0.49 | 0.69 |
| D/E (Debt-to-Equity) | 0.68 | 0.90 |
| Debt-to-Assets | 28.3% | 34.1% |
| Interest Coverage | 22.5 | 4.27 |
| Asset Turnover | 0.67 | 0.60 |
| Fixed Asset Turnover | 3.53 | 8.36 |
| Payout ratio | 61.8% | 150.7% |
| Dividend yield | 2.52% | 3.83% |
| Fiscal Year | 2025 | 2024 |
Efficiency & Valuation Duel: The Vital Signs
Financial ratios act as the company’s DNA, unveiling operational strengths and hidden risks critical for investment decisions.
The Procter & Gamble Company
Procter & Gamble delivers strong profitability with a 30.7% ROE and a solid 18.95% net margin, reflecting operational excellence. Its P/E ratio at 24.5 suggests a fairly valued stock, while a high P/B ratio of 7.52 appears stretched. The company rewards shareholders through a 2.52% dividend yield, signaling steady income distribution.
Kenvue Inc.
Kenvue shows modest profitability with a 10.65% ROE and 6.66% net margin, indicating moderate efficiency. Its P/E of 39.4 marks the stock as expensive compared to sector norms. Despite this, Kenvue offers a higher dividend yield of 3.83%, balancing valuation concerns with attractive income potential for investors.
Balanced Profitability vs. Elevated Valuation
Procter & Gamble exhibits superior profitability and a more reasonable valuation, offering a safer risk-reward profile. Kenvue’s expensive valuation and moderate returns suggest higher risk. Investors seeking operational strength may prefer Procter & Gamble, while those favoring income with growth tolerance might consider Kenvue.
Which one offers the Superior Shareholder Reward?
I compare Procter & Gamble (PG) and Kenvue Inc. (KVUE) on their shareholder return strategies. PG pays a stable 2.5% dividend yield with a 62% payout ratio, well covered by robust free cash flow (FCF) at 79%. PG’s buyback program steadily supports shareholder value. KVUE’s dividend yield is higher, reaching 3.8%, but payout ratios exceed 150%, raising sustainability concerns. KVUE’s buybacks are less consistent and free cash flow coverage is weaker. PG’s distribution model balances steady dividends and buybacks, ensuring long-term value. I conclude PG offers a more reliable and attractive total return profile for 2026 investors.
Comparative Score Analysis: The Strategic Profile
The radar chart reveals the fundamental DNA and trade-offs of The Procter & Gamble Company and Kenvue Inc., highlighting their financial strengths and vulnerabilities:
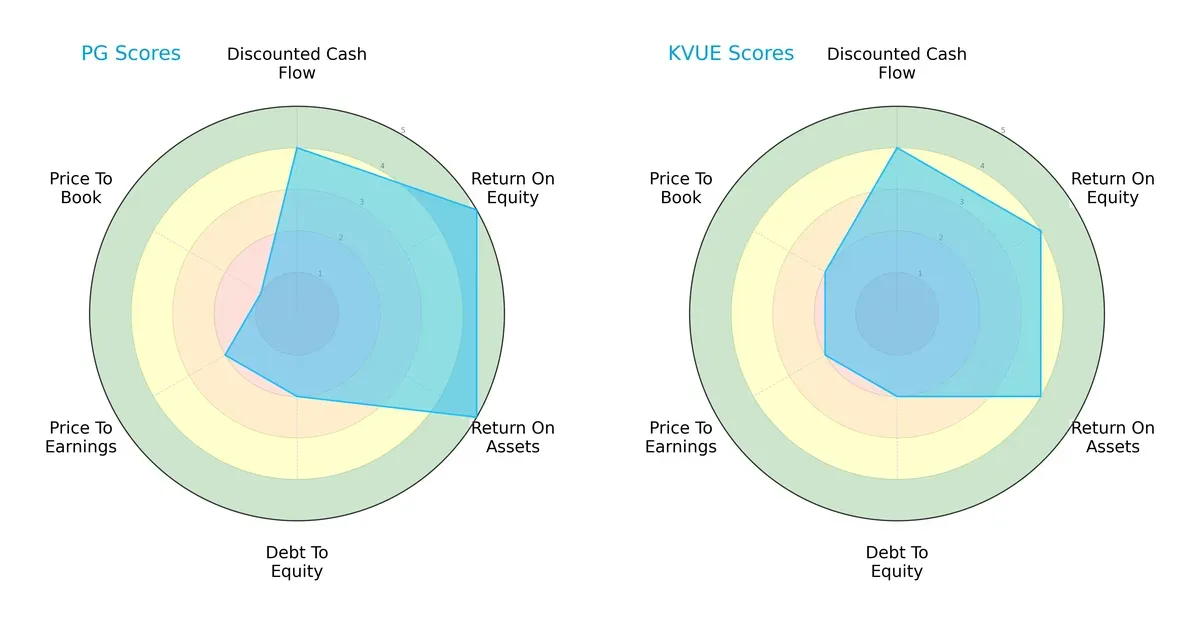
Procter & Gamble leads in return on equity and assets with top scores of 5, demonstrating strong profitability and asset utilization. Kenvue holds a slight edge in price-to-book valuation, suggesting better market pricing relative to book value. Both share moderate debt-to-equity and price-to-earnings scores. P&G’s profile is more polarized with a very unfavorable price-to-book score, while Kenvue presents a more balanced, albeit slightly lower, profitability footprint.
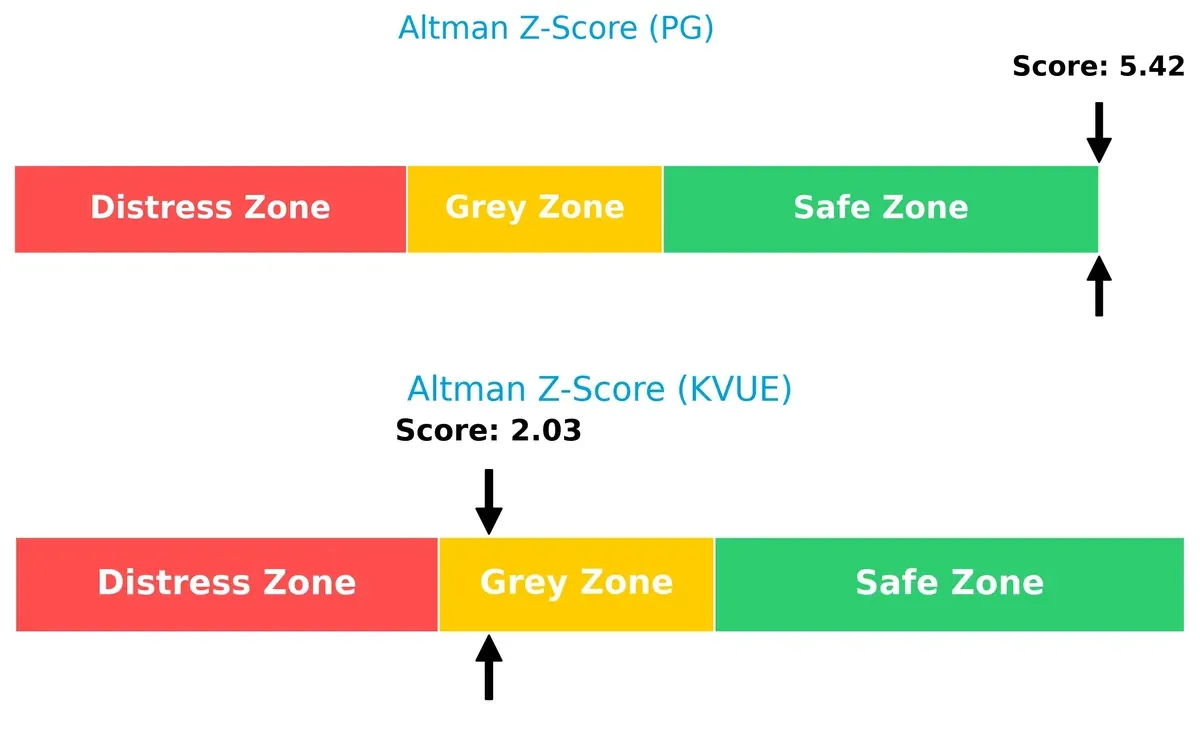
Bankruptcy Risk: Solvency Showdown
The Procter & Gamble Company’s Altman Z-Score of 5.42 places it firmly in the safe zone, indicating robust long-term survival prospects. Kenvue’s 2.03 score falls into the grey zone, signaling moderate bankruptcy risk amid current market conditions:
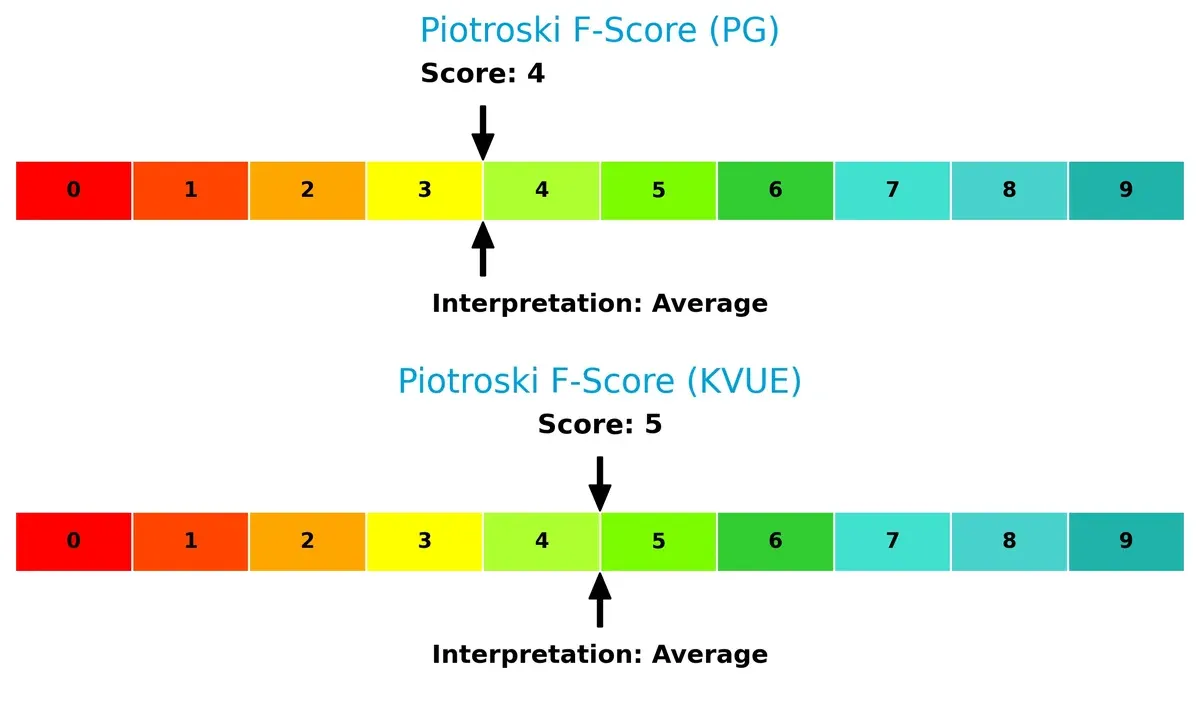
Financial Health: Quality of Operations
Both firms show average Piotroski F-Scores, with Kenvue at 5 and P&G at 4. This suggests comparable operational quality without significant red flags, though neither scores in peak financial health territory:
How are the two companies positioned?
This section dissects the operational DNA of PG and KVUE by comparing their revenue distribution and internal strengths and weaknesses. The goal is to confront their economic moats to identify which model offers the most resilient competitive advantage today.
Revenue Segmentation: The Strategic Mix
This visual comparison dissects how The Procter & Gamble Company and Kenvue Inc. diversify their income streams and where their primary sector bets lie:
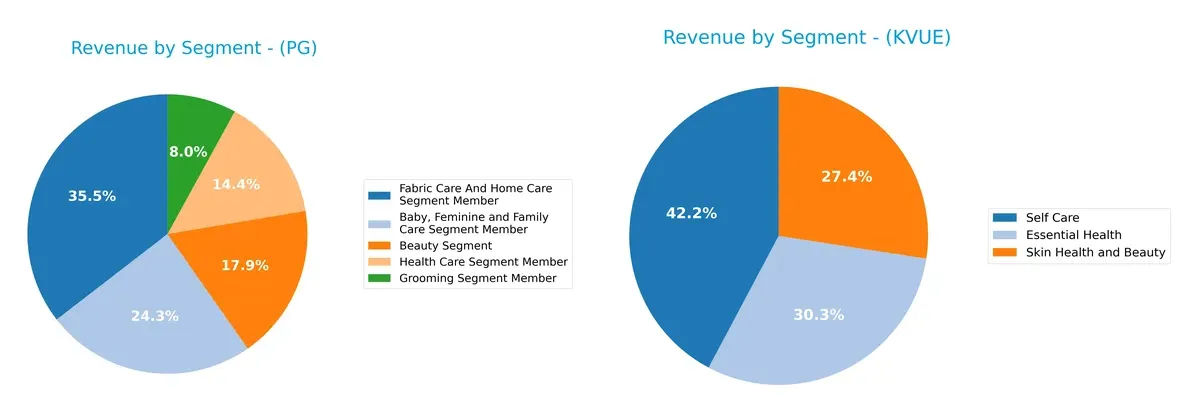
P&G anchors its revenue in Fabric Care and Home Care with $29.6B, followed by Baby, Feminine and Family Care at $20.2B, showing a broad portfolio. Kenvue relies more evenly on Self Care at $6.5B, Essential Health at $4.7B, and Skin Health and Beauty at $4.2B. P&G’s scale and segment diversity suggest ecosystem lock-in, while Kenvue’s balanced mix indicates targeted specialization but exposes it to sector-specific risks.
Strengths and Weaknesses Comparison
This table compares the Strengths and Weaknesses of The Procter & Gamble Company (PG) and Kenvue Inc. (KVUE):
PG Strengths
- Diversified product segments generating $93B+ revenue
- Strong global presence with $84B revenue split between US and Non-US markets
- High profitability metrics: 19% net margin, 31% ROE, 16% ROIC
- Favorable WACC at 5.4% indicating efficient capital allocation
- Strong interest coverage at 23x and solid fixed asset turnover of 3.53
- Consistent dividend yield at 2.5%
KVUE Strengths
- Niche product focus in essential health, self-care, and skin health generating $15B revenue
- Favorable WACC at 5.9% supports capital efficiency
- High fixed asset turnover at 8.36 signals operational efficiency
- Dividend yield at 3.8% offers attractive income
- Presence across Asia Pacific, EMEA, Latin America, and North America diversifies geographic risk
PG Weaknesses
- Low liquidity ratios: current ratio 0.7 and quick ratio 0.49 raise short-term solvency concerns
- High price-to-book ratio at 7.52 may indicate overvaluation risk
- Neutral debt-to-equity and asset turnover ratios suggest moderate leverage and efficiency
- Slightly unfavorable PB ratio could affect valuation appeal
KVUE Weaknesses
- Moderate profitability with 6.7% net margin and 10.7% ROE limits earnings power
- Elevated P/E ratio at 39.4 reflects high market expectations and valuation risk
- Unfavorable liquidity ratios below 1 (current 0.96, quick 0.69) may constrain flexibility
- Interest coverage at 4.3x is modest, indicating tighter debt service capacity
- Neutral debt-to-assets ratio at 34% suggests higher leverage risk than PG
Both companies exhibit distinct strategic strengths. PG leverages broad diversification and robust profitability to maintain competitive advantage. KVUE focuses on operational efficiency and geographic spread but faces challenges in profitability and liquidity. These factors will shape each firm’s capital allocation and growth strategies going forward.
The Moat Duel: Analyzing Competitive Defensibility
A structural moat is the only barrier safeguarding long-term profits from relentless competitive erosion. Let’s dissect the defensive advantages of these two titans:
The Procter & Gamble Company: Brand Power and Scale Economies
P&G’s moat stems from its formidable brand portfolio and scale-driven cost advantages. This translates into a very favorable ROIC exceeding WACC by 11%, sustaining margin stability. New product innovations and global market expansion in 2026 should reinforce this durable advantage.
Kenvue Inc.: Emerging Innovation with Margin Pressure
Kenvue leans on product innovation and niche consumer health brands but lacks P&G’s scale. Its ROIC barely surpasses WACC, indicating a fragile moat. Despite recent margin compression, its rapid ROIC growth hints at potential moat development through portfolio optimization and market penetration.
Defensive Moats in the Consumer Products Arena: Scale vs. Growth Potential
P&G commands a deeper moat through scale and brand equity, delivering consistent value creation. Kenvue shows promise but remains vulnerable to competitive pressures. P&G is better positioned to defend market share against both incumbents and disruptors in 2026.
Which stock offers better returns?
The past year shows contrasting price dynamics between The Procter & Gamble Company and Kenvue Inc., with both experiencing bearish trends but differing in volatility and recent momentum.
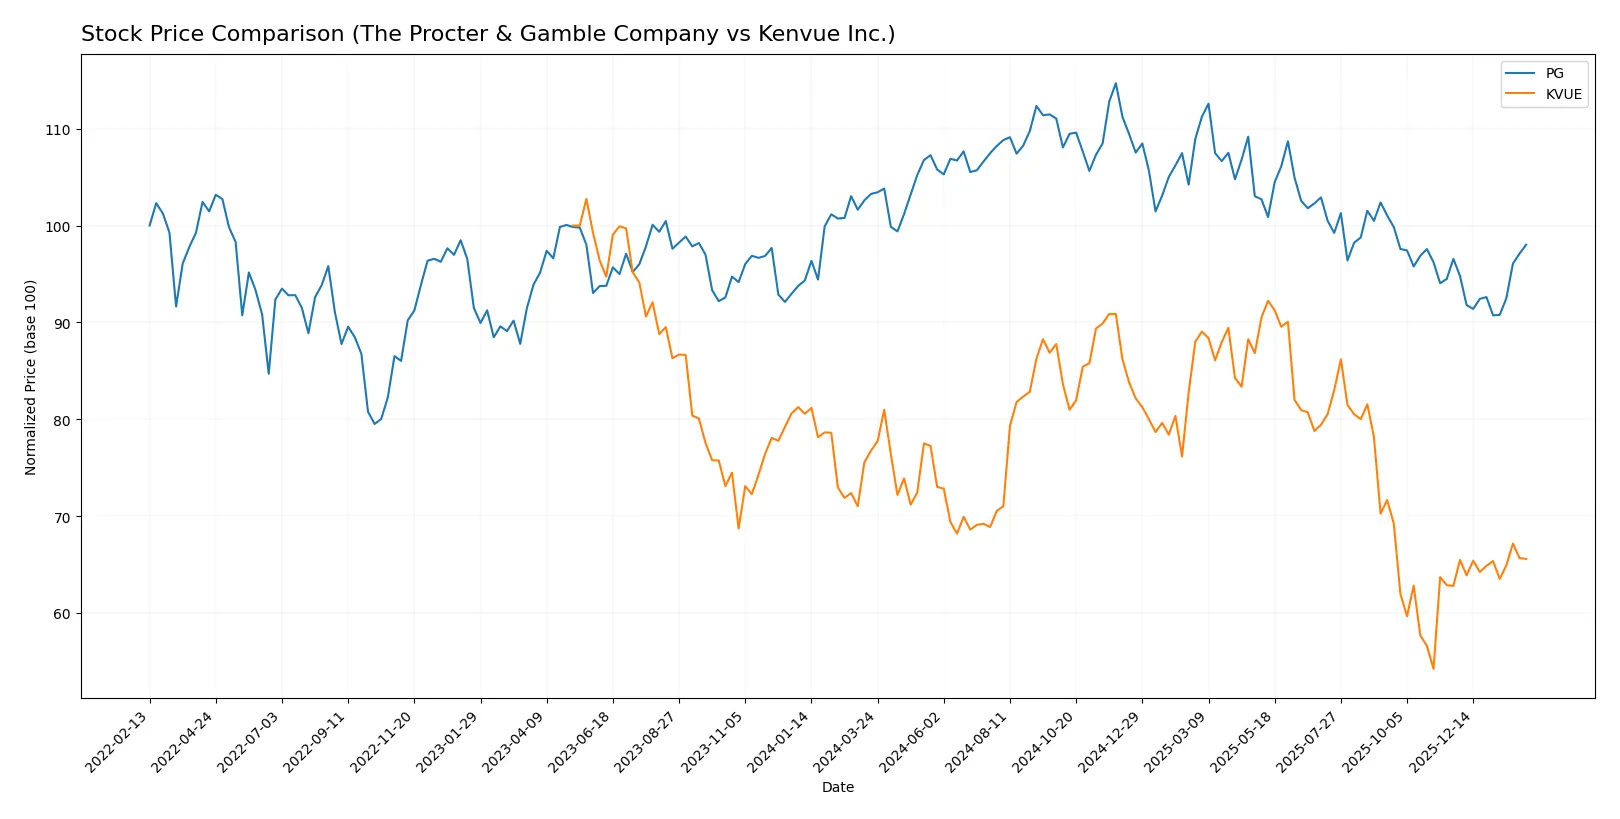
Trend Comparison
The Procter & Gamble Company’s stock declined 5.07% over the past 12 months, marking a bearish trend with accelerating downward momentum and a high volatility level of 8.89%. The price ranged between 179.26 and 141.79.
Kenvue Inc.’s stock fell 14.55% over the same period, also bearish with accelerating decline but lower volatility at 2.51%. Its price fluctuated between 24.44 and 14.37, with a recent modest uptrend of 4.45%.
Between the two, Procter & Gamble delivered a smaller loss and higher recent buyer dominance, outperforming Kenvue in market performance over the last year.
Target Prices
Analysts present a clear target price consensus for both The Procter & Gamble Company and Kenvue Inc.
| Company | Target Low | Target High | Consensus |
|---|---|---|---|
| The Procter & Gamble Company | 150 | 179 | 165.67 |
| Kenvue Inc. | 15 | 22 | 17.86 |
The Procter & Gamble consensus target of 165.67 suggests upside from the current 153.2 price. Kenvue’s 17.86 consensus is slightly above its 17.38 market price, indicating modest growth expectations.

Don’t Let Luck Decide Your Entry Point
Optimize your entry points with our advanced ProRealTime indicators. You’ll get efficient buy signals with precise price targets for maximum performance. Start outperforming now!
How do institutions grade them?
Here is a comparison of recent institutional grades for The Procter & Gamble Company and Kenvue Inc.:
The Procter & Gamble Company Grades
The following table lists recent grades from reputable financial institutions for PG:
| Grading Company | Action | New Grade | Date |
|---|---|---|---|
| TD Cowen | Downgrade | Hold | 2026-01-27 |
| Wells Fargo | Maintain | Overweight | 2026-01-23 |
| JP Morgan | Upgrade | Overweight | 2026-01-23 |
| UBS | Maintain | Buy | 2026-01-23 |
| UBS | Maintain | Buy | 2026-01-14 |
| TD Cowen | Maintain | Buy | 2026-01-08 |
| Wells Fargo | Maintain | Overweight | 2026-01-05 |
| JP Morgan | Maintain | Neutral | 2025-12-18 |
| Jefferies | Upgrade | Buy | 2025-12-17 |
| JP Morgan | Maintain | Neutral | 2025-10-27 |
Kenvue Inc. Grades
The following table lists recent grades from reputable financial institutions for KVUE:
| Grading Company | Action | New Grade | Date |
|---|---|---|---|
| Jefferies | Downgrade | Hold | 2026-01-30 |
| Barclays | Maintain | Equal Weight | 2025-11-10 |
| Canaccord Genuity | Downgrade | Hold | 2025-10-29 |
| Jefferies | Maintain | Buy | 2025-10-27 |
| JP Morgan | Maintain | Overweight | 2025-10-10 |
| Citigroup | Maintain | Neutral | 2025-10-09 |
| UBS | Maintain | Neutral | 2025-10-08 |
| B of A Securities | Maintain | Buy | 2025-10-08 |
| Goldman Sachs | Maintain | Neutral | 2025-10-02 |
| Barclays | Maintain | Equal Weight | 2025-10-01 |
Which company has the best grades?
The Procter & Gamble Company has consistently stronger grades, with multiple Buy and Overweight ratings from top firms. Kenvue shows more Hold and Neutral ratings, indicating more cautious sentiment. Investors may view PG as having a more favorable outlook based on institutional confidence.
Risks specific to each company
The following categories identify the critical pressure points and systemic threats facing both firms in the 2026 market environment:
1. Market & Competition
The Procter & Gamble Company
- Dominates global consumer products with diversified segments, but faces intense competition from agile niche brands.
Kenvue Inc.
- Faces competitive pressures as a newer standalone firm leveraging legacy J&J brands, challenged by innovation pace and market penetration.
2. Capital Structure & Debt
The Procter & Gamble Company
- Maintains a moderate debt-to-equity ratio (0.68) with strong interest coverage (23.23), signaling stable financial risk.
Kenvue Inc.
- Carries higher leverage (debt-to-equity 0.9) and weaker interest coverage (4.28), increasing vulnerability to rising rates.
3. Stock Volatility
The Procter & Gamble Company
- Exhibits low beta (0.38), indicating defensive stock behavior amid market fluctuations.
Kenvue Inc.
- Slightly higher beta (0.55) suggests more volatility but still moderate relative to sector benchmarks.
4. Regulatory & Legal
The Procter & Gamble Company
- Large global footprint exposes P&G to complex regulatory regimes, but experience mitigates risks.
Kenvue Inc.
- As a younger entity, Kenvue faces regulatory scrutiny typical for spun-offs and consumer health product compliance.
5. Supply Chain & Operations
The Procter & Gamble Company
- Established supply networks support scale efficiency but remain sensitive to raw material cost inflation.
Kenvue Inc.
- Smaller scale supply chains increase operational risk, with potential disruptions impacting product availability.
6. ESG & Climate Transition
The Procter & Gamble Company
- Invests heavily in sustainability; ESG efforts support brand strength but require ongoing capital allocation.
Kenvue Inc.
- ESG practices developing; risks stem from transitioning legacy practices and meeting increasing stakeholder expectations.
7. Geopolitical Exposure
The Procter & Gamble Company
- Extensive global presence creates exposure to geopolitical tensions and trade policy volatility.
Kenvue Inc.
- More concentrated US-centric operations reduce geopolitical risk but limit international growth opportunities.
Which company shows a better risk-adjusted profile?
P&G’s dominant market position and stronger financial safeguards outweigh Kenvue’s higher leverage and operational risks. P&G’s Altman Z-score of 5.42 places it firmly in the safe zone, while Kenvue’s 2.03 signals a grey area. P&G’s low beta confirms defensive stock stability.
Kenvue’s most impactful risk is its elevated debt and weaker interest coverage, which heighten financial vulnerability. For P&G, supply chain inflation pressures could erode margins despite operational scale. Overall, P&G offers a superior risk-adjusted profile, supported by robust profitability and financial strength in the 2026 environment.
Final Verdict: Which stock to choose?
The Procter & Gamble Company (PG) excels as a cash-generating powerhouse with a durable competitive advantage, reflected in its consistently growing ROIC well above its cost of capital. Its main point of vigilance lies in liquidity constraints, which could pressure short-term flexibility. PG suits portfolios targeting steady, long-term value and income.
Kenvue Inc. (KVUE) offers a strategic moat through its asset-light model and improving profitability, highlighted by an expanding ROIC trend despite currently shedding value. Relative to PG, KVUE carries higher financial risk and a less robust margin profile, positioning it better for investors seeking growth with a tolerance for volatility and turnaround potential.
If you prioritize resilient capital efficiency and reliable income, PG outshines with its proven value creation and financial strength. However, if you seek growth at a reasonable price with a focus on improving operational metrics, KVUE offers better upside potential albeit with elevated risk. Both present distinct analytical scenarios depending on your investment objectives and risk appetite.
Disclaimer: Investment carries a risk of loss of initial capital. The past performance is not a reliable indicator of future results. Be sure to understand risks before making an investment decision.
Go Further
I encourage you to read the complete analyses of The Procter & Gamble Company and Kenvue Inc. to enhance your investment decisions: