In the competitive world of household and personal products, The Estée Lauder Companies Inc. (EL) and Kenvue Inc. (KVUE) stand out as key players with strong market presence and innovative strategies. Estée Lauder leads in premium beauty and skincare, while Kenvue, a Johnson & Johnson spin-off, excels in consumer health and skin care. This article will analyze both companies to help you decide which offers the most compelling investment opportunity in 2026.

Table of contents
Companies Overview
I will begin the comparison between The Estée Lauder Companies Inc. and Kenvue Inc. by providing an overview of these two companies and their main differences.
The Estée Lauder Companies Inc. Overview
The Estée Lauder Companies Inc. manufactures, markets, and sells a wide range of skin care, makeup, fragrance, and hair care products globally. Founded in 1946 and headquartered in New York City, it operates under numerous well-known brands such as Estée Lauder, Clinique, and MAC. The company distributes products through department stores, specialty retailers, freestanding stores, and online channels, positioning itself as a leader in the household and personal products industry.
Kenvue Inc. Overview
Kenvue Inc. is a consumer health company operating worldwide with three main segments: Self Care, Skin Health and Beauty, and Essential Health. Incorporated in 2022 and based in Skillman, New Jersey, Kenvue offers products under brands like Tylenol, Neutrogena, and Band-Aid. The company, a Johnson & Johnson subsidiary, focuses on a broad array of health-related products, including pain care, skin care, oral and baby care, catering to the household and personal products market.
Key similarities and differences
Both companies operate in the household and personal products sector and have a global presence. Estée Lauder primarily focuses on beauty and luxury skin care and makeup products, while Kenvue offers a broader consumer health portfolio, including self-care and essential health products. Estée Lauder has a longer market history and a wider brand portfolio in cosmetics, whereas Kenvue, a newer entity, emphasizes health and wellness products alongside skin and beauty care.
Income Statement Comparison
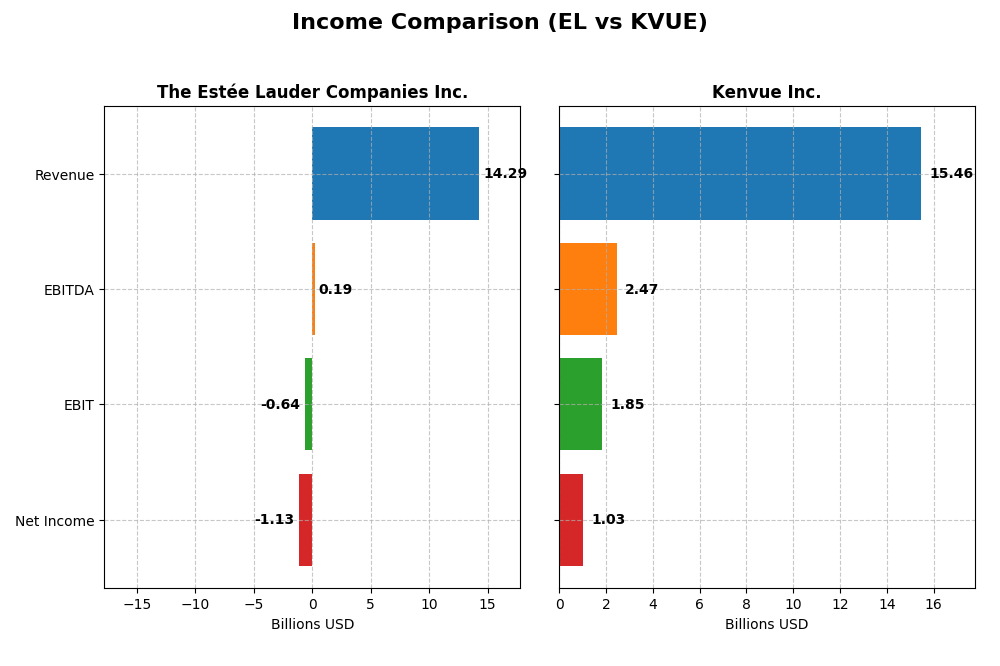
This table presents a side-by-side comparison of key income statement metrics for The Estée Lauder Companies Inc. and Kenvue Inc. for their most recent fiscal years.
| Metric | The Estée Lauder Companies Inc. (EL) | Kenvue Inc. (KVUE) |
|---|---|---|
| Market Cap | 40.7B | 32.6B |
| Revenue | 14.3B | 15.5B |
| EBITDA | 193M | 2.47B |
| EBIT | -636M | 1.85B |
| Net Income | -1.13B | 1.03B |
| EPS | -3.15 | 0.54 |
| Fiscal Year | 2025 | 2024 |
Income Statement Interpretations
The Estée Lauder Companies Inc.
From 2021 to 2025, Estée Lauder’s revenue declined by nearly 12%, with net income turning negative in the latest fiscal year, reflecting a drop of over 139% over the period. Gross margins remained relatively strong around 74%, but EBIT and net margins deteriorated significantly, with the 2025 year showing negative EBIT and net margin. This indicates a sharp slowdown in profitability despite stable gross margins.
Kenvue Inc.
Kenvue showed stable revenue growth of about 7% over five years, with net income more than doubling. Gross margin hovered near 58%, while EBIT and net margins were consistently positive, around 12% and 7% respectively in 2024. However, the latest year saw a decline in EBIT and net margins, signaling some margin pressure despite modest revenue growth and improved overall profitability since 2020.
Which one has the stronger fundamentals?
Kenvue’s income statement reflects stronger fundamentals, with favorable margins across the board and notable net income growth over the period. In contrast, Estée Lauder faces unfavorable trends in profitability and net income declines, despite a solid gross margin. The overall income statement evaluation favors Kenvue as more stable and financially sound in recent years.
Financial Ratios Comparison
Below is a comparison of key financial ratios for The Estée Lauder Companies Inc. (EL) and Kenvue Inc. (KVUE) based on the most recent fiscal year data available.
| Ratios | The Estée Lauder Companies Inc. (EL) | Kenvue Inc. (KVUE) |
|---|---|---|
| ROE | -29.3% (2025) | 10.7% (2024) |
| ROIC | 6.4% (2025) | 6.2% (2024) |
| P/E | -25.7 (2025) | 39.4 (2024) |
| P/B | 7.53 (2025) | 4.20 (2024) |
| Current Ratio | 1.30 (2025) | 0.96 (2024) |
| Quick Ratio | 0.92 (2025) | 0.69 (2024) |
| D/E (Debt-to-Equity) | 2.44 (2025) | 0.90 (2024) |
| Debt-to-Assets | 47.5% (2025) | 34.1% (2024) |
| Interest Coverage | 2.37 (2025) | 4.27 (2024) |
| Asset Turnover | 0.72 (2025) | 0.60 (2024) |
| Fixed Asset Turnover | 2.79 (2025) | 8.36 (2024) |
| Payout Ratio | -54.5% (2025) | 150.7% (2024) |
| Dividend Yield | 2.12% (2025) | 3.83% (2024) |
Interpretation of the Ratios
The Estée Lauder Companies Inc.
The Estée Lauder shows a mixed ratio profile with several unfavorable indicators, notably a negative net margin of -7.93% and a sharply negative return on equity at -29.31%. Its price-to-earnings ratio is favorable, but the high price-to-book ratio and weak interest coverage raise concerns. Dividend yield is stable at 2.12%, suggesting consistent shareholder returns, though cash flow coverage is negative, indicating potential sustainability risks.
Kenvue Inc.
Kenvue presents a generally balanced ratio set with neutral net margin of 6.66% and return on equity at 10.65%, reflecting moderate profitability. Its weighted average cost of capital is favorable at 5.83%, yet high price-to-earnings and price-to-book ratios weigh on valuation. The company offers a 3.83% dividend yield, supported by moderate leverage and a solid fixed asset turnover, indicating operational efficiency.
Which one has the best ratios?
Both companies have a slightly unfavorable global ratio opinion, but Kenvue’s higher dividend yield, better interest coverage, and stronger asset turnover contrast with Estée Lauder’s more significant negative profitability and leverage concerns. Kenvue’s ratios suggest more operational efficiency and stability, while Estée Lauder faces challenges in profitability and capital structure.
Strategic Positioning
This section compares the strategic positioning of The Estée Lauder Companies Inc. and Kenvue Inc., including market position, key segments, and exposure to technological disruption:
The Estée Lauder Companies Inc.
- Leading global presence in household and personal products; faces competitive pressure in beauty sector.
- Focuses on skin care, makeup, fragrance, and hair care; major revenue from skin care and makeup.
- Limited explicit exposure to technological disruption mentioned; traditional retail and online sales channels.
Kenvue Inc.
- Operates worldwide in consumer health; competes in health and wellness market segments.
- Operates Self Care, Skin Health and Beauty, and Essential Health segments with diversified product lines.
- No direct mention of technological disruption exposure; operates through established consumer health segments.
The Estée Lauder Companies Inc. vs Kenvue Inc. Positioning
Estée Lauder focuses on a diversified beauty portfolio with strong skin care and makeup segments, while Kenvue offers a concentrated approach in consumer health and wellness, spanning self care and essential health. Each has distinct market drivers and segment focuses.
Which has the best competitive advantage?
Based on MOAT evaluation, Kenvue shows a slightly favorable position with growing profitability, while Estée Lauder faces very unfavorable conditions with declining returns, indicating Kenvue currently holds a stronger competitive advantage.
Stock Comparison
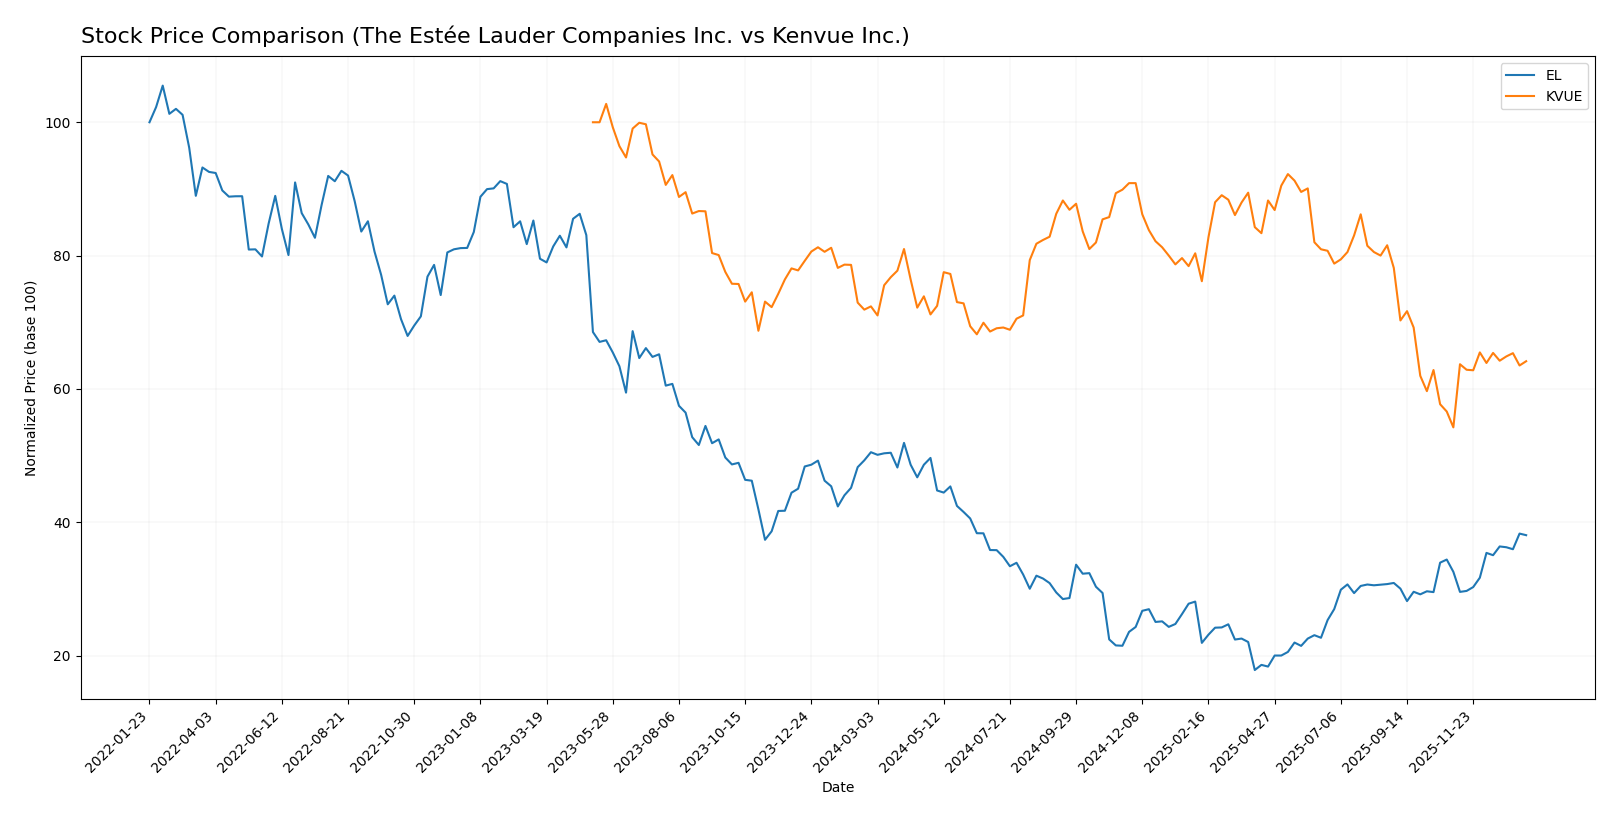
The stock prices of The Estée Lauder Companies Inc. and Kenvue Inc. have exhibited significant bearish trends over the past 12 months, with notable recent rebounds and varying trading dynamics.
Trend Analysis
The Estée Lauder Companies Inc. (EL) experienced a 24.65% decline in stock price over the past year, indicating a bearish trend with accelerating downward momentum. Recent months show a 16.89% rebound, reflecting a strong recovery phase.
Kenvue Inc. (KVUE) also shows a bearish trend with an 11.37% price drop over 12 months, accompanied by accelerating negative momentum. Its recent 18.3% price increase signals a moderate recovery, though volatility remains lower than EL.
Comparing both, EL’s stock delivered a larger negative return overall but showed a strong recent rebound; KVUE’s decline was milder but with less pronounced recovery, placing EL ahead in recent market performance.
Target Prices
The current analyst consensus offers a balanced view on target prices for The Estée Lauder Companies Inc. and Kenvue Inc.
| Company | Target High | Target Low | Consensus |
|---|---|---|---|
| The Estée Lauder Companies Inc. | 130 | 70 | 106.67 |
| Kenvue Inc. | 23 | 15 | 18.57 |
Analysts expect The Estée Lauder stock to trade near its consensus target of 106.67, slightly below its current price of 113.02 USD. Kenvue’s consensus target of 18.57 USD is moderately above its current price of 17 USD, indicating moderate upside potential.
Analyst Opinions Comparison
This section compares analysts’ ratings and grades for The Estée Lauder Companies Inc. (EL) and Kenvue Inc. (KVUE):
Rating Comparison
EL Rating
- Rating: D+ indicating a very unfavorable overall assessment by analysts.
- Discounted Cash Flow Score: Moderate at 2, suggesting some caution on future cash flow values.
- ROE Score: Very unfavorable at 1, showing weak profit generation from shareholders’ equity.
- ROA Score: Very unfavorable at 1, indicating poor asset utilization for earnings.
- Debt To Equity Score: Very unfavorable at 1, implying high financial risk from debt levels.
- Overall Score: Very unfavorable at 1, summarizing weak financial standing overall.
KVUE Rating
- Rating: B+ representing a very favorable overall assessment by analysts.
- Discounted Cash Flow Score: Favorable at 4, indicating positive expectations for cash flow.
- ROE Score: Favorable at 4, reflecting efficient profit generation from equity.
- ROA Score: Favorable at 4, demonstrating effective use of assets to generate earnings.
- Debt To Equity Score: Moderate at 2, suggesting manageable financial risk with moderate leverage.
- Overall Score: Moderate at 3, reflecting a solid but not exceptional financial position.
Which one is the best rated?
Based strictly on the provided data, KVUE is better rated than EL across all measured financial scores and has a more favorable overall rating. EL’s scores indicate significant financial weaknesses, while KVUE shows stronger profitability and risk metrics.
Scores Comparison
Here is the comparison of the Altman Z-Score and Piotroski Score for both companies:
EL Scores
- Altman Z-Score: 3.11, indicating a safe financial zone
- Piotroski Score: 5, reflecting average financial health
KVUE Scores
- Altman Z-Score: 1.95, indicating a grey financial zone
- Piotroski Score: 5, reflecting average financial health
Which company has the best scores?
Based strictly on the provided data, EL has a stronger Altman Z-Score, placing it in the safe zone versus KVUE’s grey zone. Both have identical Piotroski Scores of 5, indicating similar average financial health.
Grades Comparison
Here is the grades comparison for The Estée Lauder Companies Inc. and Kenvue Inc.:
The Estée Lauder Companies Inc. Grades
This table shows recent grades and rating actions from reputable grading companies for EL.
| Grading Company | Action | New Grade | Date |
|---|---|---|---|
| Wells Fargo | Maintain | Equal Weight | 2026-01-05 |
| Raymond James | Upgrade | Strong Buy | 2026-01-05 |
| Citigroup | Maintain | Neutral | 2025-12-17 |
| Evercore ISI Group | Maintain | Outperform | 2025-12-16 |
| Rothschild & Co | Downgrade | Sell | 2025-11-25 |
| Argus Research | Upgrade | Buy | 2025-11-11 |
| JP Morgan | Maintain | Overweight | 2025-10-31 |
| Telsey Advisory Group | Maintain | Market Perform | 2025-10-31 |
| UBS | Maintain | Neutral | 2025-10-31 |
| RBC Capital | Maintain | Outperform | 2025-10-31 |
The Estée Lauder Companies Inc. grades show a mix of neutral and positive ratings, with some recent upgrades and one notable downgrade.
Kenvue Inc. Grades
This table presents recent grades and rating actions from recognized grading companies for KVUE.
| Grading Company | Action | New Grade | Date |
|---|---|---|---|
| Barclays | Maintain | Equal Weight | 2025-11-10 |
| Canaccord Genuity | Downgrade | Hold | 2025-10-29 |
| Jefferies | Maintain | Buy | 2025-10-27 |
| JP Morgan | Maintain | Overweight | 2025-10-10 |
| Citigroup | Maintain | Neutral | 2025-10-09 |
| B of A Securities | Maintain | Buy | 2025-10-08 |
| UBS | Maintain | Neutral | 2025-10-08 |
| Goldman Sachs | Maintain | Neutral | 2025-10-02 |
| Barclays | Maintain | Equal Weight | 2025-10-01 |
| Rothschild & Co | Upgrade | Buy | 2025-09-26 |
Kenvue Inc. ratings mostly reflect a stable outlook with a predominance of hold and buy grades and few downgrades.
Which company has the best grades?
The Estée Lauder Companies Inc. has received a broader range of grades including several outperform and strong buy ratings, while Kenvue Inc. exhibits mostly hold and buy ratings. This suggests EL may be viewed with slightly more optimism by analysts, potentially impacting investor confidence and perceived growth opportunities.
Strengths and Weaknesses
Below is a comparative overview of key strengths and weaknesses of The Estée Lauder Companies Inc. (EL) and Kenvue Inc. (KVUE) based on the latest financial and operational data.
| Criterion | The Estée Lauder Companies Inc. (EL) | Kenvue Inc. (KVUE) |
|---|---|---|
| Diversification | Strong product diversification across Skin Care (6.96B), Makeup (4.21B), Fragrance (2.49B), Hair Care (565M) | Balanced segments in Self Care (6.53B), Essential Health (4.69B), Skin Health and Beauty (4.24B) |
| Profitability | Negative net margin (-7.93%) and declining ROIC; value destroying (-1.64% ROIC vs WACC) | Positive net margin (6.66%), growing ROIC; slightly favorable moat status |
| Innovation | Moderate innovation with stable product lines but declining profitability | Improving innovation reflected in rising ROIC and segment growth |
| Global presence | Well-established global brand with diversified markets | Growing global footprint with focus on health and beauty |
| Market Share | Leading in premium beauty but facing competitive pressure | Emerging player with expanding market share in health-related consumer products |
Key takeaways: Estée Lauder’s broad product range and global reach are strong, but profitability challenges and declining ROIC raise caution. Kenvue shows promising growth and improving profitability, making it a cautiously attractive option for investors seeking exposure in health and personal care sectors.
Risk Analysis
Below is a comparative risk assessment table for The Estée Lauder Companies Inc. (EL) and Kenvue Inc. (KVUE) based on the most recent data:
| Metric | The Estée Lauder Companies Inc. (EL) | Kenvue Inc. (KVUE) |
|---|---|---|
| Market Risk | Beta 1.15, higher volatility | Beta 0.55, lower volatility |
| Debt level | Debt/Equity 2.44 (unfavorable) | Debt/Equity 0.90 (neutral) |
| Regulatory Risk | Moderate, cosmetics regulations | Moderate, health product regulations |
| Operational Risk | Complex brand portfolio and global supply chain | Diverse product segments, moderate complexity |
| Environmental Risk | Increasing pressure on sustainability practices | Focus on eco-friendly products, still evolving |
| Geopolitical Risk | Exposure to international markets | Exposure mainly in US and global markets |
The most impactful risks are EL’s high debt level coupled with negative profitability indicators, increasing financial stress. KVUE’s moderate debt and lower volatility suggest comparatively lower market and financial risk. Both face regulatory challenges inherent to consumer health and beauty industries.
Which Stock to Choose?
The Estée Lauder Companies Inc. (EL) shows a declining income trend with unfavorable net margin (-7.93%) and return on equity (-29.31%). Its debt levels are high with a debt-to-equity ratio of 2.44, and its overall rating is very unfavorable (D+). The company is shedding value with a very unfavorable moat evaluation and declining profitability.
Kenvue Inc. (KVUE) presents a stable income profile with a positive net margin of 6.66% and neutral to favorable financial ratios. Its debt appears moderate, with a debt-to-equity ratio of 0.9, and the company holds a favorable rating (B+). KVUE has a slightly favorable moat with improving profitability and a moderate financial distress risk.
For investors, those inclined towards growth and improving profitability might view KVUE more favorably due to its rising ROIC and better rating. Conversely, risk-tolerant investors considering turnaround potential could interpret EL’s very unfavorable ratios and deteriorating income as cautionary signals. The choice could depend on the investor’s risk appetite and strategy focus.
Disclaimer: Investment carries a risk of loss of initial capital. The past performance is not a reliable indicator of future results. Be sure to understand risks before making an investment decision.
Go Further
I encourage you to read the complete analyses of The Estée Lauder Companies Inc. and Kenvue Inc. to enhance your investment decisions: