In the competitive realm of household and personal products, Kenvue Inc. and The Clorox Company stand out as influential players with overlapping market footprints. Kenvue, a recent spin-off from Johnson & Johnson, emphasizes consumer health and beauty innovation, while Clorox boasts a diversified portfolio spanning cleaning, wellness, and lifestyle brands. This analysis will guide investors in discerning which company presents a more compelling investment opportunity in 2026.
Table of contents
Companies Overview
I will begin the comparison between Kenvue Inc. and The Clorox Company by providing an overview of these two companies and their main differences.
Kenvue Inc. Overview
Kenvue Inc. is a consumer health company operating worldwide, focusing on three segments: Self Care, Skin Health and Beauty, and Essential Health. The company offers well-known brands such as Tylenol, Neutrogena, and Band-Aid. Incorporated in 2022 and headquartered in Skillman, New Jersey, Kenvue operates as a subsidiary of Johnson & Johnson, positioning itself strongly in the household and personal products industry.
The Clorox Company Overview
The Clorox Company manufactures and markets consumer and professional products globally across four segments: Health and Wellness, Household, Lifestyle, and International. It owns brands like Clorox, Glad, and Burt’s Bees. Founded in 1913 and based in Oakland, California, Clorox sells products through diverse retail and distribution channels, establishing a broad presence in the household and personal products sector.
Key similarities and differences
Both Kenvue and Clorox operate in the household and personal products industry, targeting consumer health and wellness markets. While Kenvue focuses on health-related segments including self-care and skin health, Clorox has a more diversified portfolio, including cleaning, lifestyle, and international markets. Kenvue is a relatively new public company and a Johnson & Johnson subsidiary, whereas Clorox has a long-established independent presence with broader product distribution channels.
Income Statement Comparison
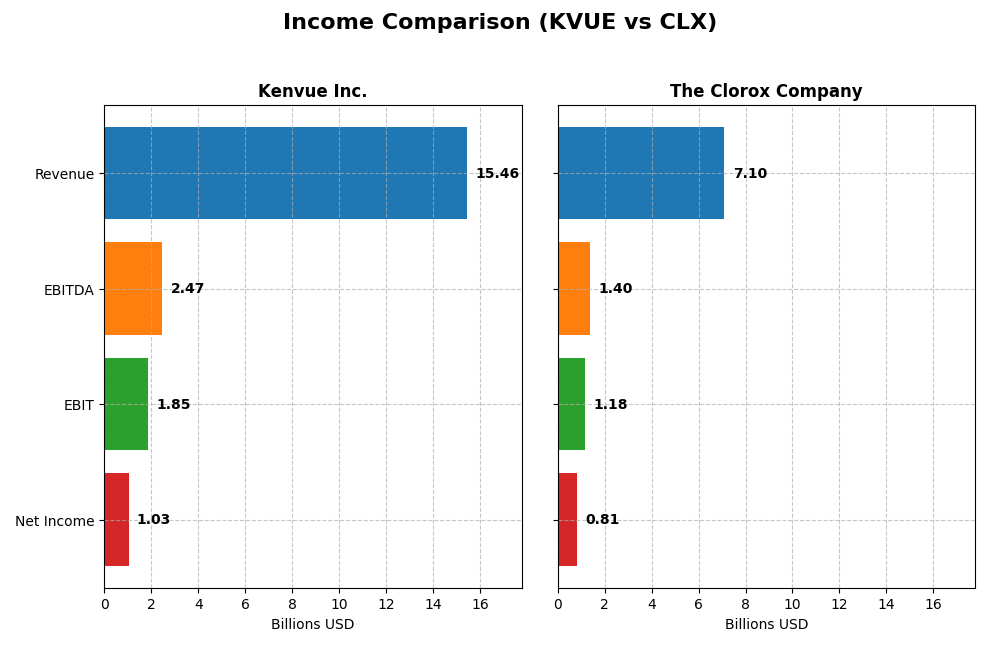
The table below compares the key income statement metrics for Kenvue Inc. and The Clorox Company for their most recent fiscal years, providing a snapshot of their financial performance.
| Metric | Kenvue Inc. (KVUE) | The Clorox Company (CLX) |
|---|---|---|
| Market Cap | 32.6B | 13.0B |
| Revenue | 15.5B | 7.1B |
| EBITDA | 2.47B | 1.40B |
| EBIT | 1.85B | 1.18B |
| Net Income | 1.03B | 810M |
| EPS | 0.54 | 6.56 |
| Fiscal Year | 2024 | 2025 |
Income Statement Interpretations
Kenvue Inc.
Kenvue’s revenue showed modest growth of 0.07% in the last year, reaching $15.45B in 2024, with net income declining by 38.15% to $1.03B. Margins remain favorable, with a gross margin at 57.97% and net margin at 6.66%. However, EBIT fell by 27.55%, signaling margin pressure despite overall positive long-term trends.
The Clorox Company
Clorox’s revenue slightly decreased by 0.16% to $7.10B in 2025, but net income surged by 188.84% to $810M. Margins strengthened, with an EBIT margin of 16.6% and net margin improving to 11.4%. The company showed robust EBIT growth of 135.33%, indicating strong operational leverage and margin expansion in the latest year.
Which one has the stronger fundamentals?
Clorox demonstrates stronger fundamentals with higher margin improvements, significant net income growth, and favorable EBIT expansion in the recent year. Kenvue, while maintaining solid margins and long-term net income growth, faces near-term declines in profitability and slower revenue growth. Clorox’s more consistent margin gains and earnings momentum mark a comparatively favorable income statement profile.
Financial Ratios Comparison
Below is a comparison of key financial ratios for Kenvue Inc. and The Clorox Company based on their most recent fiscal data available.
| Ratios | Kenvue Inc. (2024 FY) | The Clorox Company (2025 FY) |
|---|---|---|
| ROE | 10.7% | 252.3% |
| ROIC | 6.2% | 24.1% |
| P/E | 39.4 | 18.3 |
| P/B | 4.20 | 46.20 |
| Current Ratio | 0.96 | 0.84 |
| Quick Ratio | 0.69 | 0.57 |
| D/E (Debt-to-Equity) | 0.90 | 8.97 |
| Debt-to-Assets | 34.1% | 51.8% |
| Interest Coverage | 4.27 | 11.67 |
| Asset Turnover | 0.60 | 1.28 |
| Fixed Asset Turnover | 8.36 | 4.44 |
| Payout Ratio | 151% | 74% |
| Dividend Yield | 3.83% | 4.06% |
Interpretation of the Ratios
Kenvue Inc.
Kenvue shows a mixed ratio profile with neutral returns on equity (10.65%) and invested capital (6.25%), but unfavorable price-to-earnings (39.38) and price-to-book (4.2) ratios. Liquidity ratios are weak (current ratio 0.96, quick ratio 0.69), signaling potential short-term challenges. The company pays a dividend with a 3.83% yield, suggesting steady shareholder returns supported by free cash flow coverage, but risks remain due to some unfavorable valuation and liquidity metrics.
The Clorox Company
Clorox presents strong financial ratios with favorable net margin (11.4%), exceptional return on equity (252.34%), and robust return on invested capital (24.14%). However, it has an unfavorable debt-to-equity ratio (8.97) and debt-to-assets (51.79%), indicating higher leverage risks. The dividend yield stands at 4.06%, backed by solid free cash flow and earnings coverage, supporting consistent shareholder returns despite some leverage concerns.
Which one has the best ratios?
The Clorox Company exhibits a more favorable overall ratio profile, with a majority of metrics rated positively, including profitability and cash flow returns. Kenvue shows a balanced but slightly unfavorable rating due to weaker liquidity and valuation ratios. Clorox’s higher leverage poses risks but is offset by strong profitability and shareholder return metrics, making its ratios generally stronger.
Strategic Positioning
This section compares the strategic positioning of Kenvue Inc. and The Clorox Company, including market position, key segments, and exposure to disruption:
Kenvue Inc.
- Larger market cap at 32.6B USD with lower beta, indicating moderate competitive pressure
- Focuses on three segments: Self Care, Skin Health and Beauty, Essential Health, with strong brands like Tylenol and Neutrogena
- Operates primarily in consumer health products with no explicit mention of technological disruption
The Clorox Company
- Smaller market cap at 13.0B USD and slightly higher beta, showing moderate competitive pressure
- Diversified across Health and Wellness, Household, Lifestyle, and International segments with broad brand portfolio
- Operates in consumer and professional products, no direct indication of technological disruption exposure
Kenvue Inc. vs The Clorox Company Positioning
Kenvue exhibits a concentrated focus on health-related consumer products with larger scale, while Clorox has a more diversified segment approach including international markets. Kenvue’s positioning leverages established health brands; Clorox’s breadth spans household and lifestyle categories, offering varied revenue drivers.
Which has the best competitive advantage?
Clorox demonstrates a very favorable economic moat with consistent value creation and growing ROIC, indicating a durable competitive advantage. Kenvue shows slightly favorable moat status with increasing profitability but currently lacks strong value creation compared to Clorox.
Stock Comparison
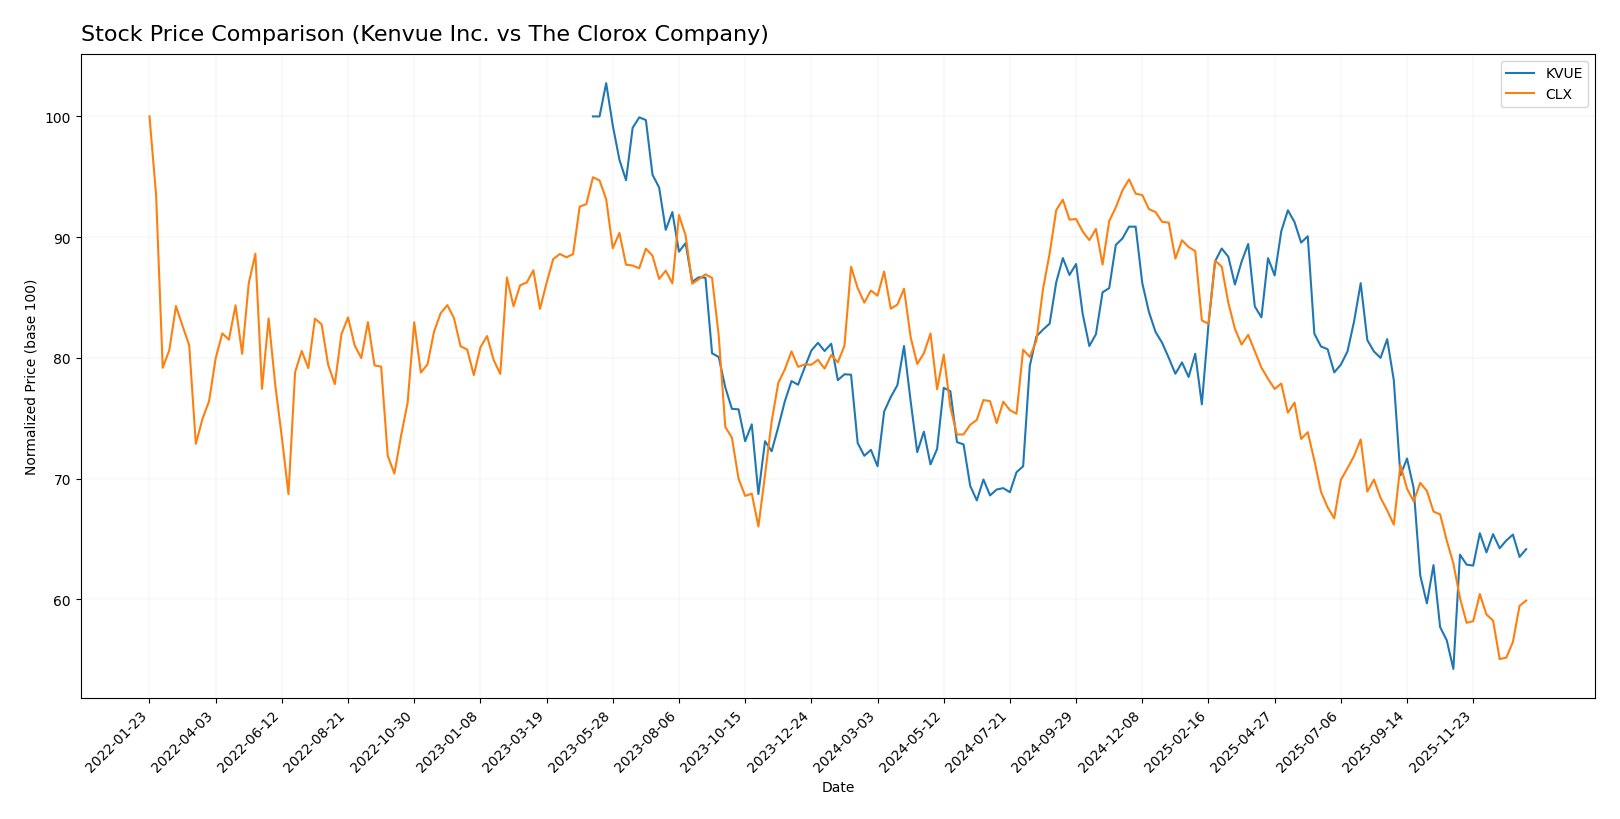
The past 12 months showed contrasting trading dynamics between Kenvue Inc. and The Clorox Company, with Kenvue experiencing a bearish trend but recent acceleration, while Clorox faced a stronger bearish trend with deceleration in losses.
Trend Analysis
Kenvue Inc.’s stock declined by 11.37% over the past year, indicating a bearish trend with accelerating price movement. The price fluctuated between a high of 24.44 and a low of 14.37, with moderate volatility at a 2.47 standard deviation.
The Clorox Company’s stock fell by 30.01% over the same period, showing a bearish trend with decelerating losses. The stock price ranged from 169.3 to 98.31, displaying higher volatility with a 19.09 standard deviation.
Comparing both, Kenvue has delivered a stronger relative market performance, given its smaller decline and recent upward trend, while Clorox showed a more severe and sustained downward movement.
Target Prices
The current analyst consensus presents a range of target prices for these consumer defensive stocks.
| Company | Target High | Target Low | Consensus |
|---|---|---|---|
| Kenvue Inc. | 23 | 15 | 18.57 |
| The Clorox Company | 152 | 94 | 118.33 |
Analysts expect moderate upside for Kenvue, with the consensus target slightly above its $17 current price. For Clorox, the consensus target price suggests a significant potential gain compared to its current $106.98 market price.
Analyst Opinions Comparison
This section compares analysts’ ratings and grades for Kenvue Inc. and The Clorox Company:
Rating Comparison
KVUE Rating
- Rating: B+, categorized as Very Favorable by analysts.
- Discounted Cash Flow Score: 4, indicating a Favorable DCF evaluation.
- ROE Score: 4, showing Favorable efficiency in generating profit from equity.
- ROA Score: 4, Favorable use of assets to generate earnings.
- Debt To Equity Score: 2, a Moderate rating on financial risk.
- Overall Score: 3, categorized as Moderate overall financial standing.
CLX Rating
- Rating: B-, also categorized as Very Favorable.
- Discounted Cash Flow Score: 5, representing a Very Favorable DCF evaluation.
- ROE Score: 1, rated Very Unfavorable for equity profit efficiency.
- ROA Score: 5, indicating a Very Favorable asset utilization.
- Debt To Equity Score: 1, Very Unfavorable due to higher financial risk.
- Overall Score: 3, also Moderate in overall financial standing.
Which one is the best rated?
Based strictly on the provided data, KVUE holds a higher overall rating (B+ vs B-) and scores better on ROE and debt-to-equity metrics. CLX excels in discounted cash flow and ROA scores but has weaker financial risk and equity profit efficiency ratings.
Scores Comparison
Here is a comparison of the financial health scores for Kenvue and Clorox:
Kenvue Scores
- Altman Z-Score: 1.95, in the grey zone indicating moderate bankruptcy risk.
- Piotroski Score: 5, classified as average financial strength.
Clorox Scores
- Altman Z-Score: 3.27, in the safe zone indicating low bankruptcy risk.
- Piotroski Score: 5, classified as average financial strength.
Which company has the best scores?
Clorox has a higher Altman Z-Score than Kenvue, placing it in the safe zone versus Kenvue’s grey zone. Both companies share the same average Piotroski Score, indicating similar financial strength on that metric.
Grades Comparison
The following is a comparison of the latest reliable grades for Kenvue Inc. and The Clorox Company:
Kenvue Inc. Grades
This table presents recent grades issued by reputable financial institutions for Kenvue Inc.
| Grading Company | Action | New Grade | Date |
|---|---|---|---|
| Barclays | Maintain | Equal Weight | 2025-11-10 |
| Canaccord Genuity | Downgrade | Hold | 2025-10-29 |
| Jefferies | Maintain | Buy | 2025-10-27 |
| JP Morgan | Maintain | Overweight | 2025-10-10 |
| Citigroup | Maintain | Neutral | 2025-10-09 |
| B of A Securities | Maintain | Buy | 2025-10-08 |
| UBS | Maintain | Neutral | 2025-10-08 |
| Goldman Sachs | Maintain | Neutral | 2025-10-02 |
| Barclays | Maintain | Equal Weight | 2025-10-01 |
| Rothschild & Co | Upgrade | Buy | 2025-09-26 |
Overall, Kenvue’s grades show a mix of “Buy,” “Hold,” and “Neutral” with a slight tilt towards maintaining or upgrading positions, indicating moderate confidence among analysts.
The Clorox Company Grades
This table shows the latest grades for The Clorox Company from established grading firms.
| Grading Company | Action | New Grade | Date |
|---|---|---|---|
| TD Cowen | Maintain | Hold | 2026-01-08 |
| Goldman Sachs | Maintain | Sell | 2026-01-07 |
| Wells Fargo | Maintain | Equal Weight | 2026-01-05 |
| Citigroup | Maintain | Neutral | 2025-12-17 |
| Morgan Stanley | Maintain | Equal Weight | 2025-11-04 |
| JP Morgan | Maintain | Neutral | 2025-11-04 |
| Wells Fargo | Maintain | Equal Weight | 2025-11-04 |
| Citigroup | Maintain | Neutral | 2025-11-04 |
| JP Morgan | Maintain | Neutral | 2025-10-10 |
| Citigroup | Maintain | Neutral | 2025-10-09 |
The Clorox Company’s ratings predominantly consist of “Hold,” “Neutral,” and “Equal Weight,” with a notable “Sell” rating from Goldman Sachs, suggesting a more cautious outlook.
Which company has the best grades?
Kenvue Inc. has generally received more favorable grades than The Clorox Company, with multiple “Buy” and “Overweight” ratings compared to Clorox’s dominant “Hold” and “Neutral” grades and one “Sell.” This disparity may reflect a relatively stronger analyst confidence in Kenvue’s near-term prospects, potentially influencing investor sentiment accordingly.
Strengths and Weaknesses
Below is a comparison of the key strengths and weaknesses of Kenvue Inc. (KVUE) and The Clorox Company (CLX) based on the most recent financial and operational data.
| Criterion | Kenvue Inc. (KVUE) | The Clorox Company (CLX) |
|---|---|---|
| Diversification | Balanced revenue across Essential Health (4.7B), Self Care (6.5B), Skin Health and Beauty (4.2B) segments | Diversified across Health and Wellness (2.7B), Household (2.0B), International (1.1B), Lifestyle (1.3B) |
| Profitability | Moderate profitability: Net margin 6.66%, ROIC 6.25% (slightly favorable with growing ROIC) | Strong profitability: Net margin 11.4%, ROIC 24.14% (very favorable with durable competitive advantage) |
| Innovation | Slightly favorable moat, indicating growing but still limited competitive edge | Very favorable moat, demonstrating a durable competitive advantage and increasing profitability |
| Global presence | Primarily focused on health and beauty sectors, with less emphasis on international markets | Significant international presence with 1.1B revenue and broad segment coverage |
| Market Share | Moderate market position with neutral to slightly unfavorable financial ratios | Larger market share with strong financial metrics and higher asset turnover |
Key takeaways: Clorox shows a robust competitive advantage with strong profitability, diversified global presence, and solid financial health. Kenvue is improving profitability with growing ROIC, though it faces challenges in liquidity and valuation metrics, suggesting cautious optimism for investors.
Risk Analysis
Below is a comparative table summarizing key risks for Kenvue Inc. and The Clorox Company based on the most recent data.
| Metric | Kenvue Inc. (KVUE) | The Clorox Company (CLX) |
|---|---|---|
| Market Risk | Low beta (0.55) suggests lower volatility versus market | Low beta (0.58), similarly low volatility |
| Debt level | Moderate debt-to-equity (0.9), debt-to-assets 34% (neutral) | High debt-to-equity (8.97), debt-to-assets 52% (unfavorable) |
| Regulatory Risk | Moderate, typical for consumer health and personal products | Moderate, with global operations subject to diverse regulations |
| Operational Risk | Neutral asset turnover (0.6) but slightly weak liquidity ratios | Higher asset turnover (1.28) but weaker current/quick ratios |
| Environmental Risk | Industry exposure to sustainability trends but no critical issues | Faces sustainability pressures; product safety and packaging under scrutiny |
| Geopolitical Risk | US-focused with some international exposure, moderate risk | Significant international operations increase geopolitical exposure |
Kenvue’s most likely risks relate to liquidity constraints and moderate leverage, while Clorox faces higher financial risk from heavy debt loads and geopolitical exposure due to its broader international footprint. Both companies operate in regulated consumer sectors, but Clorox’s higher leverage and global complexity represent the most impactful risks presently.
Which Stock to Choose?
Kenvue Inc. shows a mixed income evolution with favorable long-term net income growth of 217% but recent declines in EBIT and net margin. Its financial ratios are slightly unfavorable overall, with a neutral debt profile and moderate profitability, reflected in a B+ rating and a slightly favorable moat due to growing ROIC.
The Clorox Company exhibits favorable income statement results, including a strong net margin of 11.4% and positive growth in EBIT and EPS over the last year. Its financial ratios are largely favorable despite high leverage, supported by a B- rating and a very favorable moat indicating a durable competitive advantage with growing ROIC.
For investors prioritizing growth and improving profitability, Kenvue’s increasing ROIC and favorable income growth over the period may appear attractive. Conversely, those valuing financial stability and a strong economic moat might find The Clorox Company’s durable competitive advantage and favorable ratios more reassuring. The assessment could vary depending on individual risk tolerance and investment strategy.
Disclaimer: Investment carries a risk of loss of initial capital. The past performance is not a reliable indicator of future results. Be sure to understand risks before making an investment decision.
Go Further
I encourage you to read the complete analyses of Kenvue Inc. and The Clorox Company to enhance your investment decisions: