In the competitive landscape of household and personal products, Kenvue Inc. and Spectrum Brands Holdings, Inc. stand out as significant players with overlapping market presence. Both companies emphasize innovation across diverse consumer segments, from health and beauty to home care solutions. This comparison aims to shed light on their strategies, strengths, and growth potential, helping you decide which company deserves a spot in your investment portfolio. Let’s explore which is the smarter choice for your wallet.
Table of contents
Companies Overview
I will begin the comparison between Kenvue Inc. and Spectrum Brands Holdings, Inc. by providing an overview of these two companies and their main differences.
Kenvue Inc. Overview
Kenvue Inc. operates globally in the consumer health sector, focusing on self care, skin health and beauty, and essential health products. Its portfolio includes well-known brands such as Tylenol, Neutrogena, and Listerine. Established in 2022 as a Johnson & Johnson subsidiary, Kenvue’s mission centers on delivering trusted health and personal care products to consumers worldwide. The company is headquartered in Skillman, New Jersey, with a market cap of 32.6B USD.
Spectrum Brands Holdings, Inc. Overview
Spectrum Brands Holdings is a global branded consumer products company serving the household and personal products market. It operates through three segments: Home and Personal Care, Global Pet Care, and Home and Garden, offering diverse brands like Black & Decker, 8IN1, and Spectracide. Founded in 2009 and based in Middleton, Wisconsin, Spectrum Brands targets retail and online channels. Its market capitalization stands at approximately 1.53B USD.
Key similarities and differences
Both companies operate in the consumer defensive sector with a focus on household and personal products, but Kenvue emphasizes health-related care brands, while Spectrum Brands has a broader product range including pet care and home garden solutions. Kenvue is a newer, much larger player at 32.6B market cap versus Spectrum’s 1.53B. Additionally, Kenvue’s segments are health-focused, whereas Spectrum’s business model spans multiple lifestyle categories and diverse brand portfolios.
Income Statement Comparison
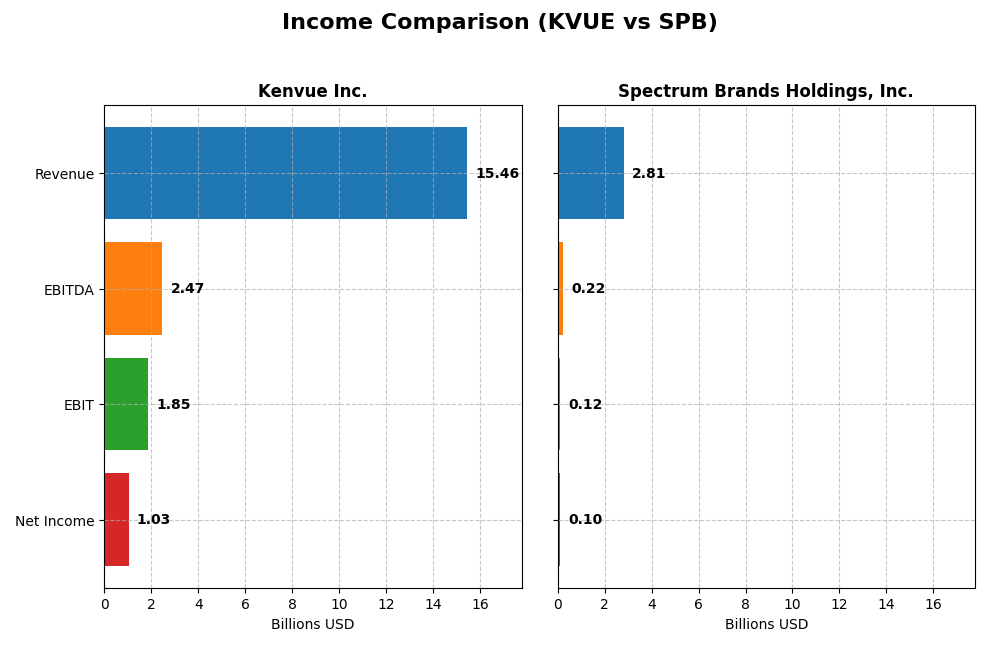
The table below compares the key income statement metrics of Kenvue Inc. and Spectrum Brands Holdings, Inc. for their most recent fiscal years, providing a snapshot of their financial performance.
| Metric | Kenvue Inc. (KVUE) 2024 | Spectrum Brands Holdings, Inc. (SPB) 2025 |
|---|---|---|
| Market Cap | 32.6B | 1.53B |
| Revenue | 15.5B | 2.81B |
| EBITDA | 2.47B | 215.2M |
| EBIT | 1.85B | 117.2M |
| Net Income | 1.03B | 99.9M |
| EPS | 0.54 | 3.88 |
| Fiscal Year | 2024 | 2025 |
Income Statement Interpretations
Kenvue Inc.
Kenvue’s revenue displayed moderate growth from 2020 to 2024, reaching $15.45B in 2024 with a net income of $1.03B, despite a recent decline from $1.66B in 2023. Gross and net margins remained favorable, around 58% and 6.7% respectively. The latest year saw slowed revenue growth and a notable drop in net margin and EPS, signaling margin compression.
Spectrum Brands Holdings, Inc.
Spectrum Brands saw declining revenue over 2021-2025, falling to $2.81B in 2025 with net income at $99.9M, down from $124.8M in 2024. Margins were mixed: gross margin was favorable at 36.7%, yet EBIT and net margins were neutral to slightly unfavorable. The latest fiscal year showed decreased revenue, profit contraction, and weaker margin metrics.
Which one has the stronger fundamentals?
Kenvue demonstrates stronger fundamentals with favorable gross, EBIT, and net margins and positive net income growth over the long term, despite recent margin pressures. Spectrum Brands exhibits an overall unfavorable income statement trend, with declining revenue, net income, and margins. Kenvue’s scale and margin stability position it more favorably relative to Spectrum Brands.
Financial Ratios Comparison
The table below presents a side-by-side comparison of key financial ratios for Kenvue Inc. (KVUE) and Spectrum Brands Holdings, Inc. (SPB) based on the most recent fiscal year data available.
| Ratios | Kenvue Inc. (2024) | Spectrum Brands Holdings, Inc. (2025) |
|---|---|---|
| ROE | 10.7% | 5.2% |
| ROIC | 6.2% | 4.9% |
| P/E | 39.4 | 13.5 |
| P/B | 4.20 | 0.71 |
| Current Ratio | 0.96 | 2.26 |
| Quick Ratio | 0.69 | 1.41 |
| D/E (Debt-to-Equity) | 0.90 | 0.34 |
| Debt-to-Assets | 34.1% | 19.4% |
| Interest Coverage | 4.27 | 4.16 |
| Asset Turnover | 0.60 | 0.83 |
| Fixed Asset Turnover | 8.36 | 8.55 |
| Payout Ratio | 151% | 48.2% |
| Dividend Yield | 3.83% | 3.57% |
Interpretation of the Ratios
Kenvue Inc.
Kenvue shows a mixed ratio profile with key strengths in its weighted average cost of capital (WACC) and fixed asset turnover, indicating efficient capital use and asset management. However, concerns arise from unfavorable price-to-earnings (PE), price-to-book (PB), current, and quick ratios, signaling valuation and liquidity challenges. Dividend yield stands at 3.83%, reflecting a favorable return, supported by consistent payouts without apparent risk of unsustainable distributions.
Spectrum Brands Holdings, Inc.
Spectrum Brands presents mostly favorable ratios, particularly in PE, PB, current, and quick ratios, suggesting good valuation and liquidity positions. Its WACC and fixed asset turnover are also favorable, enhancing overall financial health. Despite lower net margin, ROE, and ROIC marked unfavorable, the company maintains a stable dividend yield of 3.57%, supported by prudent payout levels, indicating balanced shareholder returns.
Which one has the best ratios?
Spectrum Brands holds a clear advantage with 64.29% favorable ratios versus Kenvue’s 21.43%. Spectrum’s stronger liquidity, valuation, and capital structure metrics outweigh its weaker profitability ratios. Kenvue’s higher proportion of neutral and unfavorable ratios, especially in liquidity and valuation, place it behind Spectrum in this comparison, though both deliver decent dividend yields.
Strategic Positioning
This section compares the strategic positioning of Kenvue Inc. and Spectrum Brands Holdings, Inc., focusing on Market position, Key segments, and Exposure to technological disruption:
Kenvue Inc.
- Large market cap of 32.6B in consumer health, moderate competitive pressure in household products sector.
- Operates in Self Care, Skin Health and Beauty, Essential Health segments with strong brand portfolios.
- Exposure limited; no explicit mention of technological disruption in provided data.
Spectrum Brands Holdings, Inc.
- Smaller market cap of 1.53B, facing competitive pressure in branded consumer products globally.
- Diverse segments: Home and Personal Care, Global Pet Care, Home and Garden with multiple brands.
- No explicit data on technological disruption exposure; operates in traditional consumer product categories.
Kenvue Inc. vs Spectrum Brands Holdings, Inc. Positioning
Kenvue is more concentrated in consumer health with three focused segments, while Spectrum Brands is diversified across pet care, home, and garden segments. Kenvue’s larger scale contrasts with Spectrum’s broader but smaller business units.
Which has the best competitive advantage?
Both companies are shedding value as ROIC is below WACC, but Kenvue’s growing profitability and slightly favorable moat suggest a modestly stronger competitive position compared to Spectrum Brands’ slightly unfavorable moat status.
Stock Comparison
The stock price movements of Kenvue Inc. (KVUE) and Spectrum Brands Holdings, Inc. (SPB) over the past twelve months reveal pronounced bearish trends with recent acceleration phases, indicating shifting trading dynamics and recovery attempts.

Trend Analysis
Kenvue Inc. experienced an 11.37% price decline over the past year, marking a bearish trend with accelerating downside movement. The stock ranged from a high of 24.44 to a low of 14.37, exhibiting moderate volatility with a standard deviation of 2.47.
Spectrum Brands Holdings, Inc. recorded a steeper 20.57% drop over the same period, also bearish with accelerating losses. The price fluctuated between 94.88 and 50.35, showing higher volatility, reflected in a 15.02 standard deviation.
Comparing both, Kenvue’s stock outperformed Spectrum Brands by delivering a smaller negative return, despite both showing recent short-term rebounds of over 17%.
Target Prices
Analysts provide clear target price consensus for Kenvue Inc. and Spectrum Brands Holdings, Inc.
| Company | Target High | Target Low | Consensus |
|---|---|---|---|
| Kenvue Inc. | 23 | 15 | 18.57 |
| Spectrum Brands Holdings, Inc. | 75 | 75 | 75 |
For Kenvue, the consensus target price of 18.57 USD slightly exceeds its current price of 17 USD, indicating moderate upside potential. Spectrum Brands’ target of 75 USD is well above its current price near 63.2 USD, suggesting stronger expected growth.
Analyst Opinions Comparison
This section compares analysts’ ratings and grades for Kenvue Inc. and Spectrum Brands Holdings, Inc.:
Rating Comparison
Kenvue Inc. Rating
- Rating: B+ indicating a very favorable view
- Discounted Cash Flow Score: 4 (favorable)
- ROE Score: 4 (favorable)
- ROA Score: 4 (favorable)
- Debt To Equity Score: 2 (moderate)
- Overall Score: 3 (moderate)
Spectrum Brands Holdings, Inc. Rating
- Rating: B indicating a very favorable view
- Discounted Cash Flow Score: 1 (very unfavorable)
- ROE Score: 2 (moderate)
- ROA Score: 3 (moderate)
- Debt To Equity Score: 3 (moderate)
- Overall Score: 3 (moderate)
Which one is the best rated?
Kenvue holds a higher rating (B+) with stronger scores in discounted cash flow, ROE, and ROA compared to Spectrum Brands. Both share a moderate overall score, but Kenvue’s financial metrics display a more favorable profile.
Scores Comparison
The comparison of Kenvue and Spectrum Brands Holdings scores shows the following:
Kenvue Scores
- Altman Z-Score: 1.95, in the grey zone indicating moderate bankruptcy risk.
- Piotroski Score: 5, reflecting average financial strength.
Spectrum Brands Scores
- Altman Z-Score: 1.77, in the distress zone indicating high bankruptcy risk.
- Piotroski Score: 6, reflecting average financial strength.
Which company has the best scores?
Based on the provided data, Kenvue’s Altman Z-Score places it in a less risky grey zone compared to Spectrum Brands’ distress zone. Spectrum Brands has a slightly higher Piotroski Score, but both are in the average range.
Grades Comparison
Here is a comparison of the recent grades and ratings from reputable financial institutions for the two companies:
Kenvue Inc. Grades
The following table shows recent grades assigned by major financial institutions to Kenvue Inc.:
| Grading Company | Action | New Grade | Date |
|---|---|---|---|
| Barclays | Maintain | Equal Weight | 2025-11-10 |
| Canaccord Genuity | Downgrade | Hold | 2025-10-29 |
| Jefferies | Maintain | Buy | 2025-10-27 |
| JP Morgan | Maintain | Overweight | 2025-10-10 |
| Citigroup | Maintain | Neutral | 2025-10-09 |
| B of A Securities | Maintain | Buy | 2025-10-08 |
| UBS | Maintain | Neutral | 2025-10-08 |
| Goldman Sachs | Maintain | Neutral | 2025-10-02 |
| Barclays | Maintain | Equal Weight | 2025-10-01 |
| Rothschild & Co | Upgrade | Buy | 2025-09-26 |
Overall, Kenvue’s grades show a balanced outlook with a mix of Hold, Neutral, and Buy ratings, and a recent slight downgrade from Canaccord Genuity.
Spectrum Brands Holdings, Inc. Grades
The following table presents recent grades assigned by recognized grading firms for Spectrum Brands Holdings, Inc.:
| Grading Company | Action | New Grade | Date |
|---|---|---|---|
| Canaccord Genuity | Maintain | Buy | 2025-11-17 |
| Wells Fargo | Maintain | Equal Weight | 2025-11-14 |
| Wells Fargo | Maintain | Equal Weight | 2025-09-25 |
| Canaccord Genuity | Maintain | Buy | 2025-08-08 |
| Wells Fargo | Maintain | Equal Weight | 2025-07-09 |
| Canaccord Genuity | Maintain | Buy | 2025-06-25 |
| UBS | Maintain | Buy | 2025-05-09 |
| UBS | Maintain | Buy | 2025-04-17 |
| Wells Fargo | Maintain | Equal Weight | 2025-04-16 |
| Wells Fargo | Maintain | Equal Weight | 2025-04-02 |
Spectrum Brands has consistently received Buy and Equal Weight ratings, with no downgrades reported.
Which company has the best grades?
Spectrum Brands Holdings, Inc. has generally received more Buy ratings compared to Kenvue Inc., which has a larger proportion of Hold and Neutral grades. This suggests that Spectrum Brands is viewed more favorably by analysts, potentially indicating stronger confidence in its near-term prospects. Investors might interpret these differences as varying risk-return profiles.
Strengths and Weaknesses
Below is a comparison of key strengths and weaknesses of Kenvue Inc. (KVUE) and Spectrum Brands Holdings, Inc. (SPB), based on the latest financial and operational data available.
| Criterion | Kenvue Inc. (KVUE) | Spectrum Brands Holdings, Inc. (SPB) |
|---|---|---|
| Diversification | Broad product mix: Essential Health, Self Care, Skin Health & Beauty with revenues of 4.7B, 6.5B, and 4.2B respectively | Diverse segments: Global Pet Supplies (1.1B), Home & Personal Care (1.2B), Home & Garden (0.57B) |
| Profitability | Neutral net margin (6.66%) and ROIC (6.25%) slightly above WACC (5.83%) but still shedding value overall | Lower profitability: net margin 3.56%, ROIC 4.95% below WACC 5.45%, value destroying but improving |
| Innovation | Moderate innovation indicated by steady ROIC growth (261%) but no strong moat yet | Similar ROIC growth (255%), but overall moat slightly unfavorable, indicating weaker competitive edge |
| Global presence | Strong, with multi-category health and beauty brands globally recognized | Strong in pet supplies and home care, with significant global footprint in those sectors |
| Market Share | Solid presence in health and personal care sectors with steady revenue growth | Stable market share in pet supplies and home segments, with ongoing shifts in product focus |
Key takeaway: Kenvue shows balanced diversification and improving profitability but remains a slight value shedder, while Spectrum Brands, despite lower profitability, shows a favorable financial ratio profile and stronger liquidity, suggesting better short-term stability but challenges in long-term value creation.
Risk Analysis
Below is a comparative table highlighting key risks for Kenvue Inc. and Spectrum Brands Holdings, Inc. as of the most recent fiscal years:
| Metric | Kenvue Inc. | Spectrum Brands Holdings, Inc. |
|---|---|---|
| Market Risk | Moderate (Beta 0.55) | Moderate (Beta 0.68) |
| Debt level | Moderate (D/E 0.9) | Low (D/E 0.34) |
| Regulatory Risk | Moderate | Moderate |
| Operational Risk | Moderate | Moderate |
| Environmental Risk | Moderate | Moderate |
| Geopolitical Risk | Low | Low |
Kenvue faces moderate market and debt risks with a beta of 0.55 and debt-to-equity near 0.9, indicating some leverage but manageable interest coverage. Spectrum Brands shows lower financial leverage and stronger liquidity ratios, reducing debt risk. Both companies operate in consumer products with similar regulatory and operational exposures. The most impactful risks are Kenvue’s higher leverage and Spectrum’s vulnerability to market fluctuations despite better balance sheet metrics.
Which Stock to Choose?
Kenvue Inc. (KVUE) shows a favorable income statement with a 6.66% net margin and improving profitability over 2020-2024. Despite a slight revenue growth slowdown and some unfavorable financial ratios like a low current ratio (0.96), its debt levels remain neutral and it holds a very favorable B+ rating.
Spectrum Brands Holdings, Inc. (SPB) reports an unfavorable income trend with declining revenues and net income over 2021-2025, alongside weaker profitability metrics such as a 3.56% net margin. However, SPB demonstrates stronger liquidity and lower debt ratios, reflected in a very favorable B rating and predominantly favorable financial ratios.
For investors prioritizing financial stability and favorable liquidity ratios, SPB might appear more attractive, whereas those focusing on improving profitability and income growth could see KVUE as more favorable. The choice could depend on whether an investor is risk-averse or prefers growth-oriented profiles given the contrasting financial dynamics and ratings.
Disclaimer: Investment carries a risk of loss of initial capital. The past performance is not a reliable indicator of future results. Be sure to understand risks before making an investment decision.
Go Further
I encourage you to read the complete analyses of Kenvue Inc. and Spectrum Brands Holdings, Inc. to enhance your investment decisions: