Kenvue Inc. and Nu Skin Enterprises, Inc. are two prominent players in the household and personal products industry, each with distinct approaches to health, beauty, and wellness. Kenvue, a recent spin-off from Johnson & Johnson, emphasizes a diversified consumer health portfolio, while Nu Skin focuses on innovative skincare and nutritional supplements with a direct sales model. This article will analyze their market positions and strategies to help you identify which company might be a more compelling addition to your investment portfolio.
Table of contents
Companies Overview
I will begin the comparison between Kenvue Inc. and Nu Skin Enterprises, Inc. by providing an overview of these two companies and their main differences.
Kenvue Overview
Kenvue Inc. operates globally as a consumer health company, focusing on three key segments: Self Care, Skin Health and Beauty, and Essential Health. The company offers well-known brands such as Tylenol, Neutrogena, and Listerine. Founded in 2022 and headquartered in Skillman, New Jersey, Kenvue is a subsidiary of Johnson & Johnson and holds a market capitalization of approximately 32.6B USD.
Nu Skin Overview
Nu Skin Enterprises, Inc. is a developer and distributor of beauty and wellness products worldwide, specializing in skin care systems, nutritional supplements, and weight management solutions. Founded in 1984 and based in Provo, Utah, Nu Skin markets its products through retail stores, distributors, and online channels under brands like Nu Skin and ageLOC. It has a market capitalization of about 518M USD.
Key similarities and differences
Both companies operate in the household and personal products industry within the consumer defensive sector, focusing on skin care and wellness products. However, Kenvue covers a broader portfolio including self care and essential health segments, whereas Nu Skin emphasizes direct sales and nutritional supplements. Kenvue is a much larger entity by market cap and employee count, highlighting a difference in scale and market reach.
Income Statement Comparison
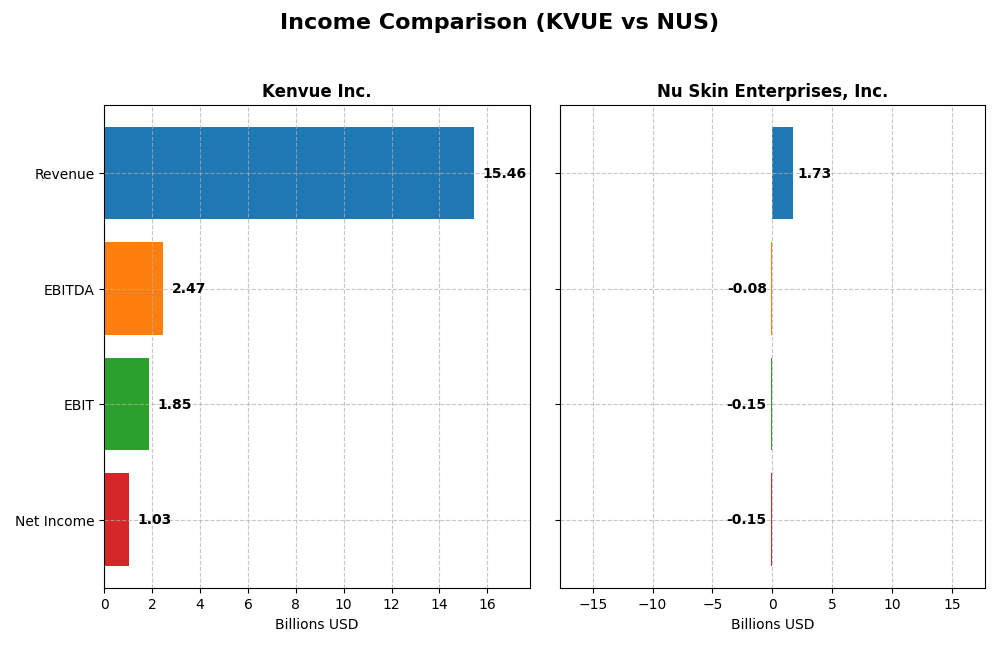
This table compares the latest full fiscal year income statement metrics for Kenvue Inc. and Nu Skin Enterprises, Inc., providing a snapshot of their financial performance in 2024.
| Metric | Kenvue Inc. (KVUE) | Nu Skin Enterprises, Inc. (NUS) |
|---|---|---|
| Market Cap | 32.6B | 518M |
| Revenue | 15.5B | 1.73B |
| EBITDA | 2.47B | -79M |
| EBIT | 1.85B | -149M |
| Net Income | 1.03B | -147M |
| EPS | 0.54 | -2.95 |
| Fiscal Year | 2024 | 2024 |
Income Statement Interpretations
Kenvue Inc.
Kenvue Inc. experienced moderate revenue growth of 6.8% over 2020-2024, with a stable gross margin near 58%. However, its net income declined significantly in the latest year, dropping by 38%, reflecting pressure on profitability despite a favorable overall net margin of 6.7%. The 2024 year showed slower revenue growth at 0.07%, with EBIT and net margin contracting, indicating emerging challenges.
Nu Skin Enterprises, Inc.
Nu Skin Enterprises faced a consistent decline in revenue, down 33% over five years, with a sharp 12% drop in 2024 alone. Gross margin remains strong at 68%, but EBIT and net margins turned negative, worsening significantly in 2024. The net income and EPS plunged drastically, highlighting deteriorating profitability and operational stress in the recent year and overall period.
Which one has the stronger fundamentals?
Kenvue presents stronger fundamentals with favorable gross and net margins, positive net income growth overall, and a stable cost structure despite recent profitability challenges. In contrast, Nu Skin shows unfavorable trends across revenue, margins, and net income, with steep declines and negative profitability metrics, reflecting weaker financial health and operational performance over the analyzed period.
Financial Ratios Comparison
Below is a comparison of key financial ratios for Kenvue Inc. (KVUE) and Nu Skin Enterprises, Inc. (NUS) for the fiscal year 2024.
| Ratios | Kenvue Inc. (KVUE) | Nu Skin Enterprises, Inc. (NUS) |
|---|---|---|
| ROE | 10.7% | -22.5% |
| ROIC | 6.25% | -10.4% |
| P/E | 39.4 | -2.33 |
| P/B | 4.20 | 0.53 |
| Current Ratio | 0.96 | 1.82 |
| Quick Ratio | 0.69 | 1.17 |
| D/E (Debt-to-Equity Ratio) | 0.90 | 0.73 |
| Debt-to-Assets | 34.1% | 32.6% |
| Interest Coverage | 4.27 | -5.74 |
| Asset Turnover | 0.60 | 1.18 |
| Fixed Asset Turnover | 8.36 | 3.71 |
| Payout Ratio | 151% | -8.14% |
| Dividend Yield | 3.83% | 3.49% |
Interpretation of the Ratios
Kenvue Inc.
Kenvue presents a mixed ratio profile with neutrality in profitability metrics like ROE at 10.65% and ROIC at 6.25%, but faces unfavorable signals in valuation with a high P/E of 39.38 and a low current ratio of 0.96, indicating liquidity concerns. Its dividend yield is favorable at 3.83%, suggesting steady shareholder returns supported by a balanced payout.
Nu Skin Enterprises, Inc.
Nu Skin shows several unfavorable profitability ratios, including a negative ROE of -22.5% and net margin of -8.46%, reflecting operational challenges. However, it benefits from strong liquidity ratios (current ratio 1.82) and a low P/B of 0.53, indicating potential undervaluation. The dividend yield of 3.49% remains attractive despite the company’s negative earnings.
Which one has the best ratios?
Nu Skin’s ratios lean more favorably overall, with 57.14% favorable metrics, especially in liquidity and asset turnover, despite profitability weaknesses. Kenvue’s profile is more neutral but slightly unfavorable due to valuation and liquidity issues, with only 21.43% favorable ratios. The comparison highlights Nu Skin’s stronger balance sheet ratios versus Kenvue’s mixed earnings and valuation signals.
Strategic Positioning
This section compares the strategic positioning of Kenvue Inc. and Nu Skin Enterprises, Inc., covering Market position, Key segments, and Exposure to technological disruption:
Kenvue Inc.
- Large market cap of 32.6B USD with moderate competitive pressure in consumer health products.
- Diversified segments: Self Care, Skin Health and Beauty, Essential Health driving revenues.
- Limited explicit exposure to technological disruption indicated in product lines or operations.
Nu Skin Enterprises, Inc.
- Small market cap of 518M USD, facing intense competition in beauty and wellness products.
- Focus on skin care systems, nutritional supplements, and personal care products.
- Incorporates skin treatment devices and nutritional supplements, showing some tech involvement.
Kenvue Inc. vs Nu Skin Enterprises, Inc. Positioning
Kenvue’s approach is diversified across multiple health and personal care segments, offering broad revenue streams. Nu Skin concentrates on beauty and wellness with technology-infused products, which may pose risks and opportunities tied to niche market dynamics.
Which has the best competitive advantage?
Kenvue shows a slightly favorable moat with growing profitability, indicating improving competitive strength. Nu Skin’s very unfavorable moat with declining returns suggests weaker competitive positioning and value destruction over recent years.
Stock Comparison
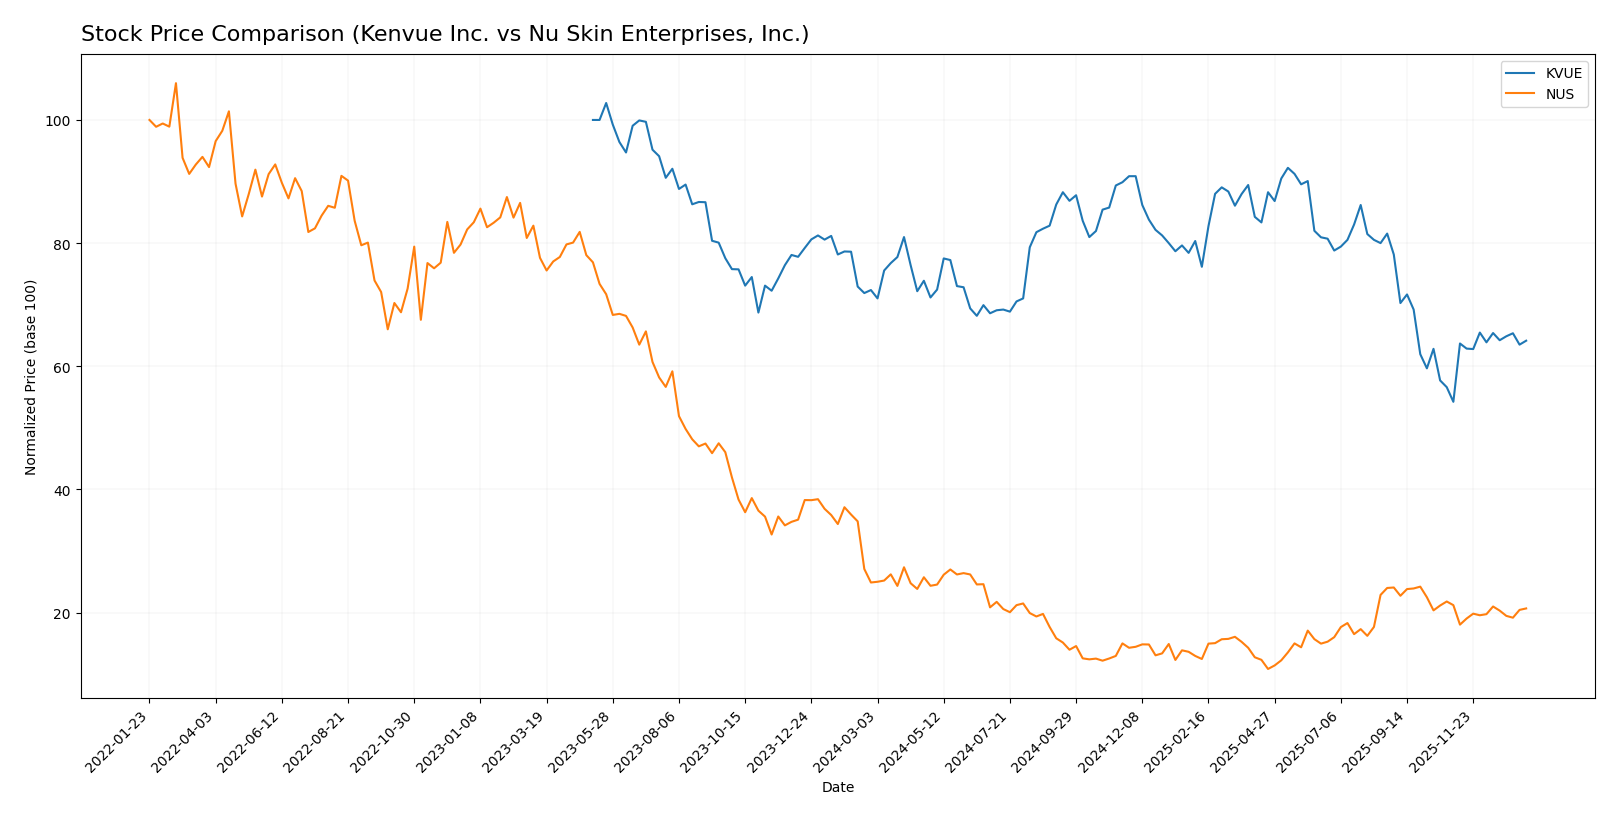
The stock price chart illustrates key movements for Kenvue Inc. and Nu Skin Enterprises, Inc. over the past 12 months, highlighting contrasting bearish trends with recent acceleration phases and notable price fluctuations.
Trend Analysis
Kenvue Inc. experienced an 11.37% price decline over the past year, indicating a bearish trend with accelerating downward momentum. The stock ranged between 24.44 and 14.37, with moderate volatility at a 2.47 std deviation.
Nu Skin Enterprises, Inc. showed a 16.93% decrease in stock price over the same period, also bearish with acceleration. Its price fluctuated from 13.83 to 5.48, and volatility was slightly lower at a 2.34 std deviation.
Comparing the two, Kenvue Inc. outperformed Nu Skin Enterprises, Inc. with a smaller negative return, despite both stocks trending downward over the past year.
Target Prices
The target price consensus from recognized analysts indicates potential price ranges for these stocks.
| Company | Target High | Target Low | Consensus |
|---|---|---|---|
| Kenvue Inc. | 23 | 15 | 18.57 |
| Nu Skin Enterprises, Inc. | 11 | 11 | 11 |
Analysts expect Kenvue’s stock to appreciate moderately above its current price of 17 USD, while Nu Skin’s consensus target of 11 USD suggests a slight upside from its current 10.45 USD.
Analyst Opinions Comparison
This section compares analysts’ ratings and grades for Kenvue Inc. and Nu Skin Enterprises, Inc.:
Rating Comparison
Kenvue Inc. Rating
- Rating: B+, considered very favorable by analysts.
- Discounted Cash Flow Score: 4, indicating favorable cash flow projections.
- ROE Score: 4, showing efficient profit generation from equity.
- ROA Score: 4, reflecting effective asset utilization.
- Debt To Equity Score: 2, moderate financial risk with higher leverage.
- Overall Score: 3, reflecting a moderate overall financial standing.
Nu Skin Enterprises, Inc. Rating
- Rating: A, considered very favorable by analysts.
- Discounted Cash Flow Score: 4, indicating favorable cash flow projections.
- ROE Score: 4, showing efficient profit generation from equity.
- ROA Score: 4, reflecting effective asset utilization.
- Debt To Equity Score: 3, moderate financial risk with somewhat lower leverage.
- Overall Score: 4, reflecting a favorable overall financial standing.
Which one is the best rated?
Based strictly on the provided data, Nu Skin holds a higher overall rating (A vs. B+) and a superior overall score (4 vs. 3) compared to Kenvue. Nu Skin also has a better debt-to-equity score, suggesting a somewhat stronger balance sheet.
Scores Comparison
Here is a comparison of the Altman Z-Score and Piotroski Score for Kenvue Inc. and Nu Skin Enterprises, Inc.:
Kenvue Inc. Scores
- Altman Z-Score: 1.95, in the grey zone indicating moderate bankruptcy risk.
- Piotroski Score: 5, classified as average financial strength.
Nu Skin Enterprises, Inc. Scores
- Altman Z-Score: 3.94, in the safe zone indicating low bankruptcy risk.
- Piotroski Score: 8, classified as very strong financial strength.
Which company has the best scores?
Based solely on the provided data, Nu Skin Enterprises shows a safer Altman Z-Score and a stronger Piotroski Score compared to Kenvue. This indicates Nu Skin has better financial stability and strength in this comparison.
Grades Comparison
Here is a comparison of the most recent grades assigned by recognized financial institutions for the two companies:
Kenvue Inc. Grades
This table summarizes the latest grades and actions from established grading companies for Kenvue Inc.
| Grading Company | Action | New Grade | Date |
|---|---|---|---|
| Barclays | Maintain | Equal Weight | 2025-11-10 |
| Canaccord Genuity | Downgrade | Hold | 2025-10-29 |
| Jefferies | Maintain | Buy | 2025-10-27 |
| JP Morgan | Maintain | Overweight | 2025-10-10 |
| Citigroup | Maintain | Neutral | 2025-10-09 |
| B of A Securities | Maintain | Buy | 2025-10-08 |
| UBS | Maintain | Neutral | 2025-10-08 |
| Goldman Sachs | Maintain | Neutral | 2025-10-02 |
| Barclays | Maintain | Equal Weight | 2025-10-01 |
| Rothschild & Co | Upgrade | Buy | 2025-09-26 |
Overall, Kenvue’s grades mostly range from Hold to Buy, with no Sell ratings, indicating a stable to cautiously optimistic market sentiment.
Nu Skin Enterprises, Inc. Grades
This table presents recent grades from reputable grading companies for Nu Skin Enterprises, Inc.
| Grading Company | Action | New Grade | Date |
|---|---|---|---|
| DA Davidson | Maintain | Neutral | 2024-12-20 |
| Citigroup | Maintain | Neutral | 2024-10-22 |
| DA Davidson | Maintain | Neutral | 2024-08-12 |
| Citigroup | Maintain | Neutral | 2024-08-09 |
| DA Davidson | Maintain | Neutral | 2024-05-09 |
| DA Davidson | Maintain | Neutral | 2024-01-05 |
| Stifel | Maintain | Hold | 2023-10-16 |
| Stifel | Maintain | Hold | 2023-10-15 |
| Citigroup | Maintain | Neutral | 2023-09-29 |
| Citigroup | Maintain | Neutral | 2023-09-28 |
The overall tonality for Nu Skin is predominantly Neutral to Hold, with one Sell rating noted in the consensus data, reflecting a cautious market view.
Which company has the best grades?
Kenvue Inc. has received a broader range of positive grades, including several Buy and Overweight ratings, whereas Nu Skin Enterprises, Inc. mostly holds Neutral and Hold grades with one Sell noted. This suggests that investors might perceive Kenvue as having slightly stronger growth or stability prospects compared to Nu Skin, potentially impacting portfolio positioning decisions.
Strengths and Weaknesses
Below is a comparison of key strengths and weaknesses for Kenvue Inc. (KVUE) and Nu Skin Enterprises, Inc. (NUS) based on the most recent data.
| Criterion | Kenvue Inc. (KVUE) | Nu Skin Enterprises, Inc. (NUS) |
|---|---|---|
| Diversification | Strong product diversification with segments in Essential Health (4.69B), Self Care (6.53B), and Skin Health and Beauty (4.24B) | Less diversified, mainly dependent on Nu Skin segment (~1.45B) with smaller manufacturing and other segments |
| Profitability | Moderate profitability: ROIC 6.25%, Net Margin 6.66%, ROE 10.65% | Negative profitability: ROIC -10.4%, Net Margin -8.46%, ROE -22.5% |
| Innovation | Growing ROIC trend (+261%) suggests improving operational efficiency and potential innovation | Declining ROIC trend (-181%) indicates deteriorating profitability, potential innovation challenges |
| Global presence | Global footprint supported by broad product lines in health and beauty sectors | Global presence through direct selling but less diversified internationally |
| Market Share | Solid market position in health and beauty care markets with increasing revenues | Market share shrinking, reflected by declining revenues and profitability |
Key takeaways: Kenvue demonstrates stronger diversification and improving profitability, indicating potential for value creation. In contrast, Nu Skin shows signs of financial distress with negative profitability and shrinking returns, which raises concerns for investors prioritizing stability and growth.
Risk Analysis
Below is a comparative overview of key risks for Kenvue Inc. (KVUE) and Nu Skin Enterprises, Inc. (NUS) based on the latest available data from 2024.
| Metric | Kenvue Inc. (KVUE) | Nu Skin Enterprises, Inc. (NUS) |
|---|---|---|
| Market Risk | Moderate, beta 0.552 indicates lower volatility than market | Moderate-high, beta 0.977 close to market volatility |
| Debt level | Neutral, debt-to-equity ratio approx. 0.9, interest coverage 4.28 | Neutral, debt-to-equity approx. 0.73, but negative interest coverage -5.63 signals risk |
| Regulatory Risk | Moderate, operates globally in consumer health sector with strict regulations | Moderate, operates in cosmetics and wellness with regulatory scrutiny, including China market |
| Operational Risk | Moderate, diversified segments but current and quick ratios below 1 indicate liquidity concerns | Moderate-high, negative profitability and operational losses increase risk |
| Environmental Risk | Standard industry exposure to sustainability pressures in personal care | Similar exposure, with increasing focus on product sustainability and supply chain impact |
| Geopolitical Risk | Moderate, global supply chains and US-based HQ | Moderate-high, significant sales and operations in Mainland China could face geopolitical tensions |
In synthesis, Nu Skin faces more impactful operational and financial risks, including negative profitability and liquidity, despite a favorable Altman Z-Score and strong Piotroski Score. Kenvue shows a slightly unfavorable financial ratio profile with liquidity below optimal levels but benefits from lower market volatility and a stable interest coverage ratio. Investors should weigh Nu Skin’s market exposure and operational challenges against Kenvue’s moderate leverage and liquidity concerns when considering risk management.
Which Stock to Choose?
Kenvue Inc. (KVUE) shows a favorable income statement with strong net margin and growing profitability despite some recent declines in EBIT and EPS. Its financial ratios are slightly unfavorable overall, with a moderate debt level and high valuation multiples, yet it maintains a very favorable B+ rating and a slightly favorable MOAT due to improving ROIC.
Nu Skin Enterprises, Inc. (NUS) faces an unfavorable income trend marked by declining revenues and negative profitability metrics. However, its financial ratios appear favorable, featuring low valuation multiples and strong liquidity, supported by a very favorable A rating and a very unfavorable MOAT reflecting declining ROIC and value destruction.
For investors prioritizing financial stability and consistent profitability, KVUE might appear more suitable given its favorable income outlook and improving competitive position. Conversely, those focused on value metrics and liquidity could find NUS more appealing despite its income challenges and deteriorating economic moat, depending on risk tolerance and investment strategy.
Disclaimer: Investment carries a risk of loss of initial capital. The past performance is not a reliable indicator of future results. Be sure to understand risks before making an investment decision.
Go Further
I encourage you to read the complete analyses of Kenvue Inc. and Nu Skin Enterprises, Inc. to enhance your investment decisions: