Kenvue Inc. and Newell Brands Inc. both operate in the household and personal products sector, making them key players in consumer defensives. While Kenvue focuses on health and beauty products with strong brand portfolios like Tylenol and Neutrogena, Newell Brands offers a diverse range of home appliances, commercial solutions, and outdoor products. This comparison will help investors identify which company presents the most compelling opportunity in 2026. Let’s explore their strengths and risks to guide your investment decisions.
Table of contents
Companies Overview
I will begin the comparison between Kenvue Inc. and Newell Brands Inc. by providing an overview of these two companies and their main differences.
Kenvue Overview
Kenvue Inc. operates globally as a consumer health company, focusing on three segments: Self Care, Skin Health and Beauty, and Essential Health. Its portfolio includes well-known brands such as Tylenol, Neutrogena, and Band-Aid. Founded in 2022 and headquartered in Skillman, NJ, it operates as a subsidiary of Johnson & Johnson, positioning itself firmly in the household and personal products industry.
Newell Brands Overview
Newell Brands Inc. designs, manufactures, sources, and distributes consumer and commercial products worldwide through five segments, including Commercial Solutions and Home Appliances. The company manages a diverse brand portfolio such as Rubbermaid, Calphalon, and Graco. Founded in 1903 and based in Atlanta, GA, Newell trades on NASDAQ and serves various retail and commercial channels in the household and personal products sector.
Key similarities and differences
Both Kenvue and Newell Brands operate in the consumer defensive sector, focusing on household and personal products. Kenvue emphasizes health-related consumer products with strong ties to Johnson & Johnson, while Newell Brands spans a broader range of commercial and consumer goods, including outdoor and learning products. Kenvue is newer with a narrower focus, whereas Newell has a longer history and a more diversified business model.
Income Statement Comparison
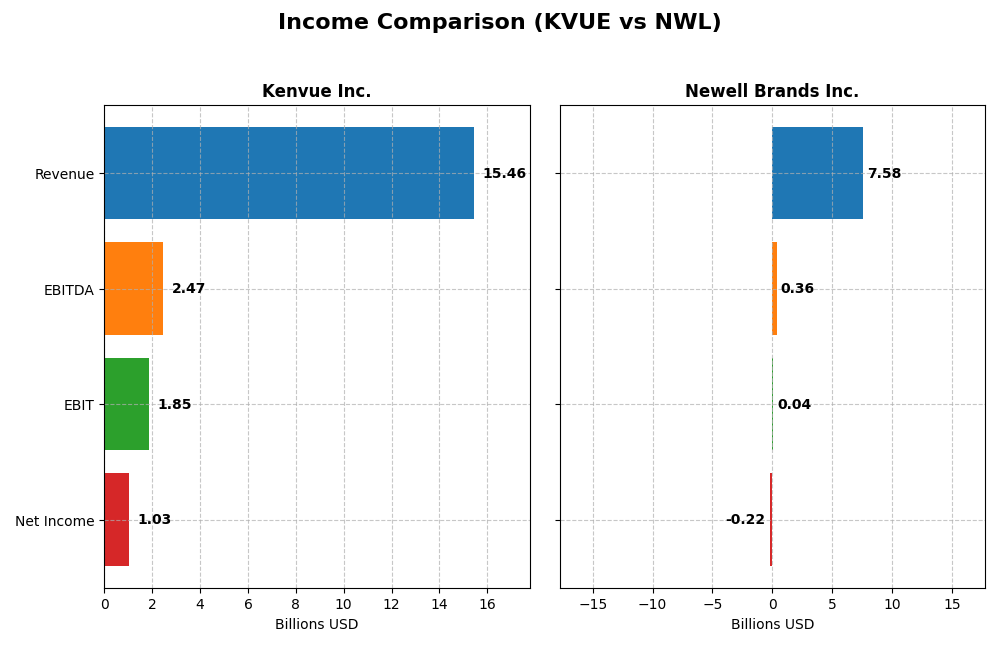
This table compares key income statement metrics for Kenvue Inc. and Newell Brands Inc. based on their most recent fiscal year 2024 results.
| Metric | Kenvue Inc. (KVUE) | Newell Brands Inc. (NWL) |
|---|---|---|
| Market Cap | 32.6B | 1.74B |
| Revenue | 15.5B | 7.58B |
| EBITDA | 2.47B | 358M |
| EBIT | 1.85B | 35M |
| Net Income | 1.03B | -216M |
| EPS | 0.54 | -0.52 |
| Fiscal Year | 2024 | 2024 |
Income Statement Interpretations
Kenvue Inc.
Kenvue’s revenue grew modestly by 6.83% over 2020-2024, with net income increasing strongly by 217%. Margins are favorable, with a gross margin near 58% and net margin improving over the period. However, in 2024, growth slowed with a slight revenue increase of 0.07%, while EBIT and net margin contracted significantly, indicating margin pressure despite solid overall fundamentals.
Newell Brands Inc.
Newell’s revenue declined by 19% from 2020 to 2024, though net income rose 72%, reflecting improved profitability management. Gross margin is favorable at 33.6%, but net margin remains negative at -2.85%, reflecting recent losses. The latest year saw a 6.8% revenue drop but an EBIT surge of 115%, signaling some operational recovery amid ongoing top-line challenges.
Which one has the stronger fundamentals?
Both companies show favorable global income statement opinions, yet Kenvue benefits from higher and more stable margins and stronger net income growth overall. Newell faces revenue declines but shows improving profitability metrics recently. Kenvue’s consistent margin strength contrasts with Newell’s negative net margin, suggesting relatively stronger fundamentals at Kenvue based on the provided income statement data.
Financial Ratios Comparison
The table below presents key financial ratios for Kenvue Inc. and Newell Brands Inc. based on their most recent fiscal year data, providing a snapshot of their financial health and performance.
| Ratios | Kenvue Inc. (KVUE) | Newell Brands Inc. (NWL) |
|---|---|---|
| ROE | 10.7% | -7.9% |
| ROIC | 6.2% | 0.6% |
| P/E | 39.4 | -19.2 |
| P/B | 4.20 | 1.50 |
| Current Ratio | 0.96 | 1.14 |
| Quick Ratio | 0.69 | 0.56 |
| D/E | 0.90 | 1.86 |
| Debt-to-Assets | 34.1% | 46.6% |
| Interest Coverage | 4.27 | 0.23 |
| Asset Turnover | 0.60 | 0.69 |
| Fixed Asset Turnover | 8.36 | 4.67 |
| Payout ratio | 151% | -55% |
| Dividend yield | 3.83% | 2.85% |
Interpretation of the Ratios
Kenvue Inc.
Kenvue Inc. shows a mixed ratio profile with favorable metrics like a low WACC of 5.83% and a strong fixed asset turnover of 8.36, indicating efficient use of assets. However, valuation ratios such as P/E at 39.38 and P/B at 4.2 are unfavorable, alongside weak liquidity ratios (current ratio 0.96). The company pays dividends with a 3.83% yield, reflecting a stable payout supported by free cash flow, though some caution is warranted due to liquidity constraints.
Newell Brands Inc.
Newell Brands’ ratios reveal significant weaknesses, including negative net margin (-2.85%) and ROE (-7.85%), with an unfavorable interest coverage ratio of 0.12 suggesting financial stress. Despite a favorable WACC of 5.56% and decent fixed asset turnover of 4.67, the debt-to-equity ratio is high at 1.86. The company pays dividends yielding 2.85%, but risks arise given its poor profitability and coverage metrics.
Which one has the best ratios?
Both companies have slightly unfavorable overall ratio evaluations. Kenvue Inc. benefits from stronger profitability and asset efficiency ratios but faces liquidity and valuation concerns. Newell Brands struggles with negative profitability and weak interest coverage, although it maintains a manageable current ratio. On balance, Kenvue’s ratios demonstrate relatively better operational strength despite some cautionary points.
Strategic Positioning
This section compares the strategic positioning of Kenvue Inc. and Newell Brands Inc. focusing on Market position, Key segments, and exposure to technological disruption:
Kenvue Inc.
- Large market cap at 32.6B with moderate competitive pressure in consumer health sector.
- Operates in three clear segments: Self Care, Skin Health and Beauty, Essential Health.
- Exposure to technological disruption is not explicitly detailed in available information.
Newell Brands Inc.
- Smaller market cap at 1.7B with diverse competitors in consumer and commercial product markets.
- Operates five segments including Commercial Solutions, Home Appliances, Learning and Development, Outdoor.
- Exposure to technological disruption is not explicitly detailed in available information.
Kenvue Inc. vs Newell Brands Inc. Positioning
Kenvue shows a focused approach in consumer health with three segments driving revenue, while Newell has a broader, diversified portfolio across consumer and commercial products. Kenvue’s larger scale contrasts with Newell’s spread across multiple segments.
Which has the best competitive advantage?
Based on MOAT evaluations, Kenvue has a slightly favorable position with growing profitability despite shedding value, while Newell’s position is slightly unfavorable though also showing improving profitability.
Stock Comparison
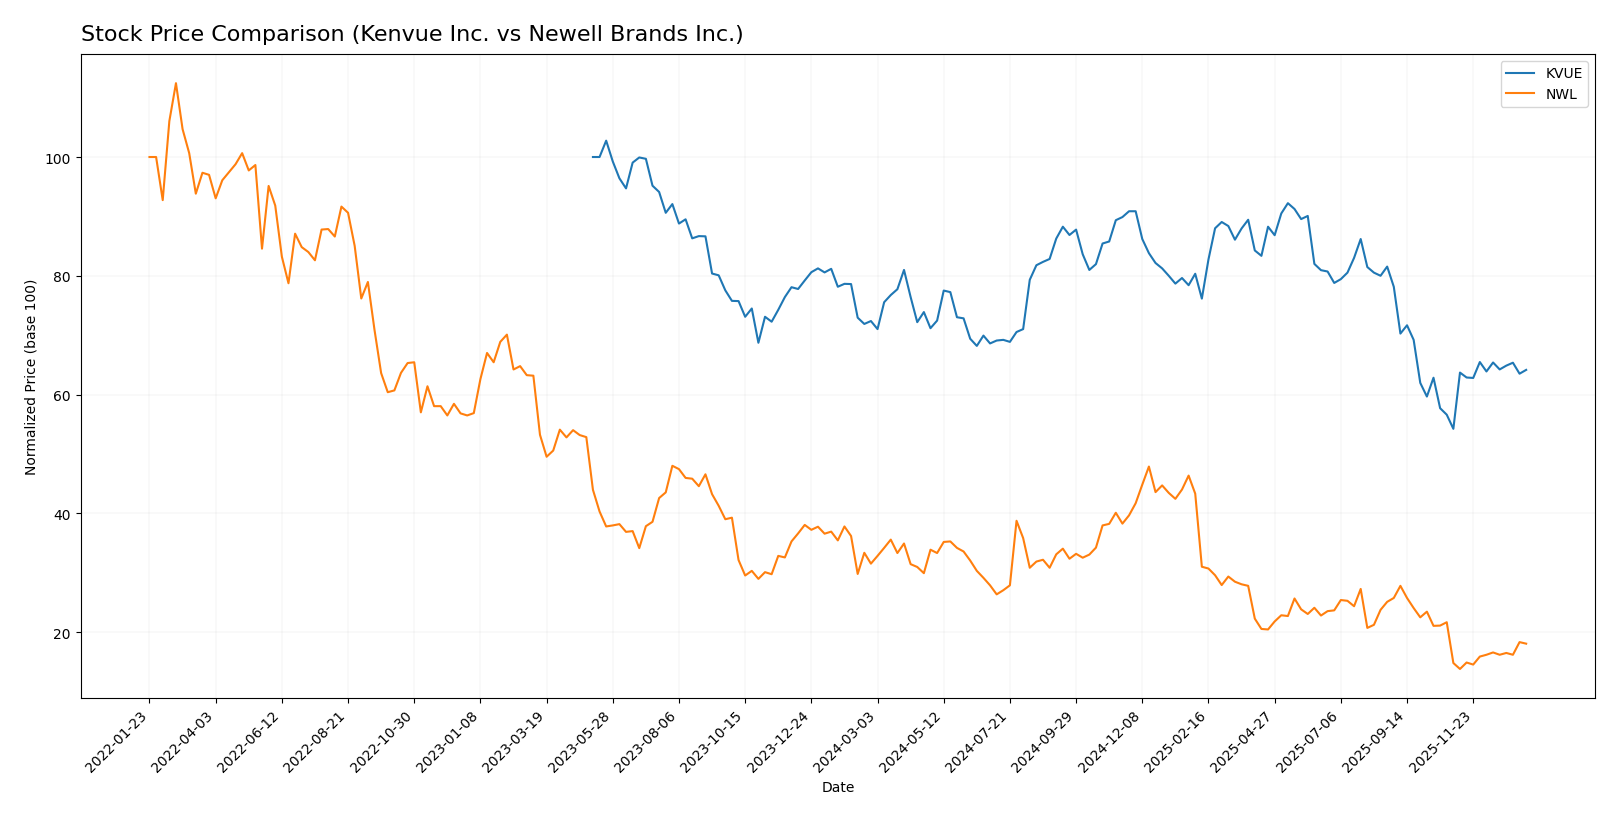
The stock price movements of Kenvue Inc. and Newell Brands Inc. over the past 12 months reveal notable bearish trends with recent acceleration phases indicating partial recoveries in both cases.
Trend Analysis
Kenvue Inc. experienced a bearish trend over the past year, with a price decline of 11.37%. The trend shows acceleration, a high volatility reflected by a 2.47 standard deviation, and a recent rebound of 18.3% from November 2025 to January 2026.
Newell Brands Inc. also showed a bearish trend, with a steeper price decline of 42.76% over the past year and accelerating downward momentum. Volatility was moderate with a 1.87 standard deviation, followed by a recent price increase of 22.06% in the same recent period.
Comparing the two, Newell Brands posted a larger overall decline but achieved a higher recent rebound percentage. Kenvue’s less severe drop and steady acceleration contrast with Newell’s more volatile performance and sharper recovery.
Target Prices
The current analyst consensus presents moderate upside potential for both Kenvue Inc. and Newell Brands Inc.
| Company | Target High | Target Low | Consensus |
|---|---|---|---|
| Kenvue Inc. | 23 | 15 | 18.57 |
| Newell Brands Inc. | 7 | 4 | 5.08 |
For Kenvue Inc., the consensus target price of 18.57 USD is slightly above the current price of 17 USD, suggesting modest growth expectations. Newell Brands’ consensus target of 5.08 USD is just above its current price of 4.15 USD, indicating cautious optimism among analysts.
Analyst Opinions Comparison
This section compares analysts’ ratings and financial grades for Kenvue Inc. and Newell Brands Inc.:
Rating Comparison
Kenvue Inc. Rating
- Rating: B+ indicating a very favorable rating
- Discounted Cash Flow Score: 4, favorable assessment
- ROE Score: 4, favorable efficiency in generating profit
- ROA Score: 4, favorable asset utilization
- Debt To Equity Score: 2, moderate financial risk
- Overall Score: 3, moderate overall financial standing
Newell Brands Inc. Rating
- Rating: C+ also indicating a very favorable rating
- Discounted Cash Flow Score: 5, very favorable assessment
- ROE Score: 1, very unfavorable efficiency in generating profit
- ROA Score: 1, very unfavorable asset utilization
- Debt To Equity Score: 1, very unfavorable financial risk
- Overall Score: 2, moderate overall financial standing
Which one is the best rated?
Based strictly on the provided data, Kenvue holds a higher overall score (3 vs. 2) and better ROE, ROA, and debt-to-equity scores. Newell excels only in discounted cash flow, but its other scores are significantly weaker.
Scores Comparison
Here is a comparison of the Altman Z-Score and Piotroski Score for the two companies:
KVUE Scores
- Altman Z-Score: 1.95, indicating moderate risk in the grey zone.
- Piotroski Score: 5, reflecting average financial strength.
NWL Scores
- Altman Z-Score: 0.51, indicating high risk in the distress zone.
- Piotroski Score: 4, reflecting average financial strength.
Which company has the best scores?
Based on these scores, KVUE shows a higher Altman Z-Score than NWL, indicating relatively better bankruptcy risk. Both companies have similar average Piotroski Scores, suggesting comparable financial strength.
Grades Comparison
Here is a detailed comparison of the grades assigned to Kenvue Inc. and Newell Brands Inc.:
Kenvue Inc. Grades
The table below shows recent grades from major financial institutions for Kenvue Inc.:
| Grading Company | Action | New Grade | Date |
|---|---|---|---|
| Barclays | Maintain | Equal Weight | 2025-11-10 |
| Canaccord Genuity | Downgrade | Hold | 2025-10-29 |
| Jefferies | Maintain | Buy | 2025-10-27 |
| JP Morgan | Maintain | Overweight | 2025-10-10 |
| Citigroup | Maintain | Neutral | 2025-10-09 |
| B of A Securities | Maintain | Buy | 2025-10-08 |
| UBS | Maintain | Neutral | 2025-10-08 |
| Goldman Sachs | Maintain | Neutral | 2025-10-02 |
| Barclays | Maintain | Equal Weight | 2025-10-01 |
| Rothschild & Co | Upgrade | Buy | 2025-09-26 |
Overall, Kenvue’s grades demonstrate a cautious stance, with a majority of neutral to hold ratings and some buy and overweight grades, indicating a moderate confidence trend.
Newell Brands Inc. Grades
The table below shows recent grades from major financial institutions for Newell Brands Inc.:
| Grading Company | Action | New Grade | Date |
|---|---|---|---|
| Citigroup | Maintain | Neutral | 2025-12-17 |
| UBS | Maintain | Neutral | 2025-12-02 |
| Canaccord Genuity | Maintain | Buy | 2025-11-03 |
| RBC Capital | Maintain | Sector Perform | 2025-11-03 |
| JP Morgan | Maintain | Overweight | 2025-11-03 |
| Citigroup | Maintain | Neutral | 2025-11-03 |
| JP Morgan | Maintain | Overweight | 2025-10-23 |
| Citigroup | Maintain | Neutral | 2025-10-09 |
| Citigroup | Maintain | Neutral | 2025-09-16 |
| Canaccord Genuity | Maintain | Buy | 2025-08-04 |
Newell Brands shows consistent neutral to buy grades with multiple overweight ratings, reflecting steady analyst confidence.
Which company has the best grades?
Both Kenvue Inc. and Newell Brands Inc. hold a consensus rating of “Hold,” but Newell Brands exhibits a higher count of buy and overweight grades compared to Kenvue’s more frequent neutral and hold ratings. This suggests Newell’s ratings may indicate a somewhat stronger analyst confidence, which could influence investor sentiment toward slightly more growth-oriented expectations.
Strengths and Weaknesses
Below is a comparative overview of key strengths and weaknesses for Kenvue Inc. (KVUE) and Newell Brands Inc. (NWL) based on their latest financial and operational data.
| Criterion | Kenvue Inc. (KVUE) | Newell Brands Inc. (NWL) |
|---|---|---|
| Diversification | Strong focus on health and beauty segments with 3 main divisions: Essential Health (4.7B), Self Care (6.5B), Skin Health & Beauty (4.2B) | More varied product portfolio but declining revenue in some segments; main areas: Home & Commercial (4.1B), Learning & Development (2.7B), Outdoor & Recreation (0.8B) |
| Profitability | Moderate profitability: 6.7% net margin, ROIC 6.3%, slightly favorable WACC (5.8%) | Negative profitability: -2.9% net margin, ROIC 0.6%, although improving ROIC trend |
| Innovation | Growing ROIC trend indicates improving operational efficiency and potential innovation gains | ROIC improving but still below WACC, indicating value destruction despite efforts |
| Global presence | Solid global footprint in health-related consumer products | Broad presence in diverse consumer goods markets, but financial stress may limit expansion |
| Market Share | Strong in health and personal care markets with consistent revenue growth | Market share under pressure with some segment revenue declines and operational challenges |
Key takeaway: Kenvue demonstrates improving profitability and a focused product strategy in health and beauty, making it a more stable investment choice. Newell Brands faces profitability challenges despite a broad product base, requiring cautious monitoring of its turnaround progress.
Risk Analysis
Below is a comparative table highlighting key risks for Kenvue Inc. and Newell Brands Inc. as of 2024:
| Metric | Kenvue Inc. (KVUE) | Newell Brands Inc. (NWL) |
|---|---|---|
| Market Risk | Low beta (0.55) indicates lower volatility versus market | Moderate beta (0.89) suggests moderate market sensitivity |
| Debt level | Moderate debt-to-assets (34%) with manageable interest coverage | Higher leverage with debt-to-assets at 46.6%, low interest coverage (0.12) signals distress |
| Regulatory Risk | Consumer health products face strict regulatory scrutiny globally | Diverse product segments with varying regulatory requirements, some exposure to stricter standards |
| Operational Risk | Focused on personal health segments with stable operations | Broad product portfolio increases complexity and operational risks |
| Environmental Risk | Moderate, tied to manufacturing and product sustainability efforts | Moderate, with initiatives but exposure due to diversified product lines |
| Geopolitical Risk | Limited, primarily US-based with global sales | Moderate, with international exposure and supply chain vulnerabilities |
The most impactful risks are Newell Brands’ high financial distress indicated by its low Altman Z-Score (0.51, distress zone) and weak interest coverage, suggesting liquidity issues. Kenvue’s risks are more moderate with stable market conditions but slightly unfavorable liquidity ratios, requiring cautious monitoring.
Which Stock to Choose?
Kenvue Inc. (KVUE) shows generally favorable income statement metrics with a net margin of 6.66% and a positive long-term growth in net income and EPS. Financial ratios are mixed but lean slightly unfavorable, with neutral profitability and moderate debt levels; overall rating is very favorable (B+).
Newell Brands Inc. (NWL) displays a challenging income profile, including a negative net margin of -2.85% despite some recent positive net margin growth. Its financial ratios are more unfavorable, notably high debt and weak return metrics; however, it holds a very favorable rating (C+) mainly due to valuation factors.
For investors, KVUE might appear more suitable for those prioritizing stable profitability and financial health with moderate growth, while NWL could be seen as a potential consideration for value-oriented investors willing to tolerate higher risk amid improving profitability trends. The choice could depend on an investor’s risk tolerance and strategic focus.
Disclaimer: Investment carries a risk of loss of initial capital. The past performance is not a reliable indicator of future results. Be sure to understand risks before making an investment decision.
Go Further
I encourage you to read the complete analyses of Kenvue Inc. and Newell Brands Inc. to enhance your investment decisions: