Home > Comparison > Consumer Defensive > KMB vs KVUE
The strategic rivalry between Kimberly-Clark Corporation and Kenvue Inc. shapes the landscape of the consumer defensive sector. Kimberly-Clark, a legacy manufacturer of personal care and tissue products, contrasts with Kenvue’s consumer health focus spanning self-care and beauty segments. This analysis pits Kimberly-Clark’s industrial scale against Kenvue’s brand-driven innovation to determine which offers a superior risk-adjusted return for a diversified portfolio in 2026.
Table of contents
Companies Overview
Kimberly-Clark and Kenvue dominate the household and personal products market with distinct yet overlapping consumer focuses.
Kimberly-Clark Corporation: Leader in Household & Personal Products
Kimberly-Clark commands the market with its diverse portfolio of personal care and consumer tissue products. Its core revenue stems from trusted brands like Huggies and Kleenex, selling through retail and away-from-home channels. In 2026, the company emphasizes expanding its professional segment and streamlining supply chains to enhance operational efficiency.
Kenvue Inc.: Consumer Health Innovator
Kenvue operates globally, focusing on consumer health with strong brands such as Tylenol and Neutrogena. Its revenue engine revolves around self-care, skin health, and essential health categories. Strategic priorities include innovation in product lines and leveraging its recent independence from Johnson & Johnson to sharpen market responsiveness.
Strategic Collision: Similarities & Divergences
Both companies compete in the consumer defensive sector targeting household and personal care needs but differ in approach. Kimberly-Clark relies on a broad, multi-segment portfolio and traditional retail networks. Kenvue pursues innovation-driven growth and brand differentiation post-spinoff. Their battle for market share centers on expanding consumer health versus tissue and professional products. Each presents a unique risk-return profile shaped by legacy scale versus nimble independence.
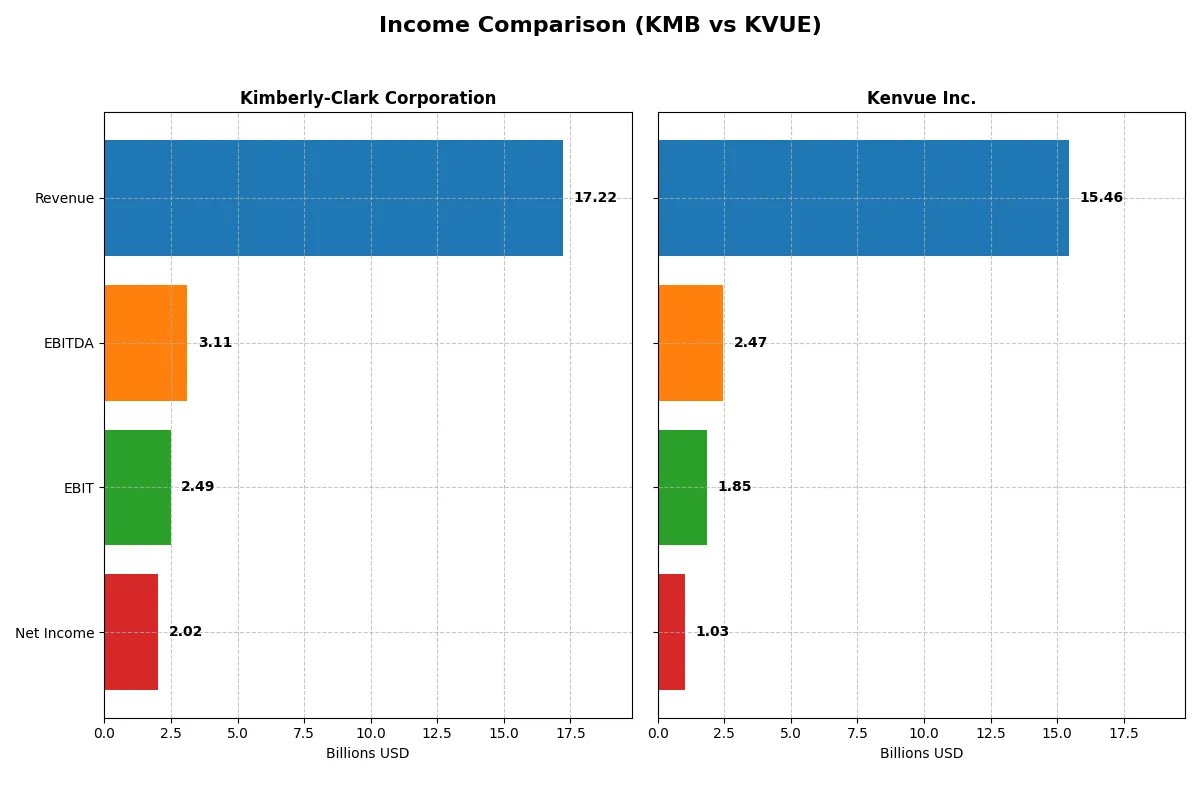
Income Statement Comparison
This data dissects the core profitability and scalability of both corporate engines to reveal who dominates the bottom line:
| Metric | Kimberly-Clark Corporation (KMB) | Kenvue Inc. (KVUE) |
|---|---|---|
| Revenue | 17.2B | 15.5B |
| Cost of Revenue | 11.1B | 6.5B |
| Operating Expenses | 3.64B | 7.12B |
| Gross Profit | 6.13B | 8.96B |
| EBITDA | 3.11B | 2.47B |
| EBIT | 2.49B | 1.85B |
| Interest Expense | 256M | 431M |
| Net Income | 2.02B | 1.03B |
| EPS | 6.08 | 0.54 |
| Fiscal Year | 2025 | 2024 |
Income Statement Analysis: The Bottom-Line Duel
This income statement comparison reveals the true efficiency and profitability trends of Kimberly-Clark Corporation and Kenvue Inc. over recent years.
Kimberly-Clark Corporation Analysis
Kimberly-Clark’s revenue declined from 20B in 2024 to 17.2B in 2025, reflecting a challenging top-line environment. Despite this, net income held strong at 2B in 2025, supported by a solid gross margin of 35.6% and a net margin near 11.7%. The company’s EBIT margin of 14.5% signals disciplined cost control, though recent declines indicate momentum loss.
Kenvue Inc. Analysis
Kenvue’s revenue remained stable at about 15.5B in 2024, with net income dropping to 1B from 1.66B in 2023. The firm maintains an impressive gross margin close to 58%, but net margin compressed to 6.7%, reflecting higher operating expenses. EBIT margin slipped to 11.9%, highlighting margin pressure despite steady top-line performance.
Margin Strength vs. Revenue Contraction
Kimberly-Clark leads in margin resilience and net income stability despite falling revenue. Kenvue shows strong gross margins but suffers from margin erosion and net income decline. For investors prioritizing durable profitability and margin discipline, Kimberly-Clark’s profile offers a steadier fundamental footing in a volatile market.
Financial Ratios Comparison
These vital ratios act as a diagnostic tool to expose the underlying fiscal health, valuation premiums, and capital efficiency of the companies compared below:
| Ratios | Kimberly-Clark Corporation (KMB) | Kenvue Inc. (KVUE) |
|---|---|---|
| ROE | 3.03% (2024) | 10.65% (2024) |
| ROIC | 25.33% (2024) | 6.25% (2024) |
| P/E | 17.35 (2024) | 39.38 (2024) |
| P/B | 52.57 (2024) | 4.20 (2024) |
| Current Ratio | 0.80 (2024) | 0.96 (2024) |
| Quick Ratio | 0.54 (2024) | 0.69 (2024) |
| D/E | 9.42 (2024) | 0.90 (2024) |
| Debt-to-Assets | 47.84% (2024) | 34.06% (2024) |
| Interest Coverage | 11.89 (2024) | 4.27 (2024) |
| Asset Turnover | 1.21 (2024) | 0.60 (2024) |
| Fixed Asset Turnover | 2.67 (2024) | 8.36 (2024) |
| Payout ratio | 63.97% (2024) | 150.68% (2024) |
| Dividend yield | 3.69% (2024) | 3.83% (2024) |
| Fiscal Year | 2024 | 2024 |
Efficiency & Valuation Duel: The Vital Signs
Ratios act as a company’s DNA, unveiling hidden risks and operational strengths beyond surface financials.
Kimberly-Clark Corporation
Kimberly-Clark shows strong profitability with an 11.74% net margin but zero reported ROE and ROIC, indicating challenges in capital efficiency. The stock trades at a reasonable P/E of 16.63, reflecting a neutral valuation. Shareholders benefit from a healthy 4.94% dividend yield, suggesting a commitment to returning cash rather than aggressive reinvestment.
Kenvue Inc.
Kenvue posts a modest 6.66% net margin with a 10.65% ROE, signaling moderate profitability and capital returns. Its valuation looks stretched, with a high P/E of 39.38 and a P/B of 4.2, raising concerns about premium pricing. The 3.83% dividend yield balances some of this risk, though reinvestment remains limited given the valuation.
Valuation Discipline vs. Growth Premium
Kimberly-Clark offers a more balanced risk-reward profile, combining solid margins and shareholder returns with reasonable valuation. Kenvue’s premium multiples heighten risk amid moderate profitability. Investors seeking value and income may prefer Kimberly-Clark, while those chasing growth must weigh Kenvue’s stretched valuation carefully.
Which one offers the Superior Shareholder Reward?
Kimberly-Clark (KMB) delivers a higher dividend yield at 4.94% with a payout ratio near 82%, supported by strong free cash flow coverage (1.67x). Its robust buyback activity complements cash returns. Kenvue (KVUE) offers a lower yield around 3.8% but has a much higher payout ratio (>100%), risking sustainability. KVUE’s smaller buybacks and elevated payout strain its cash flow. I find KMB’s balanced dividend and buyback strategy more sustainable, providing superior total shareholder reward in 2026.
Comparative Score Analysis: The Strategic Profile
The radar chart reveals the fundamental DNA and trade-offs of Kimberly-Clark Corporation and Kenvue Inc., highlighting their financial strengths and vulnerabilities:
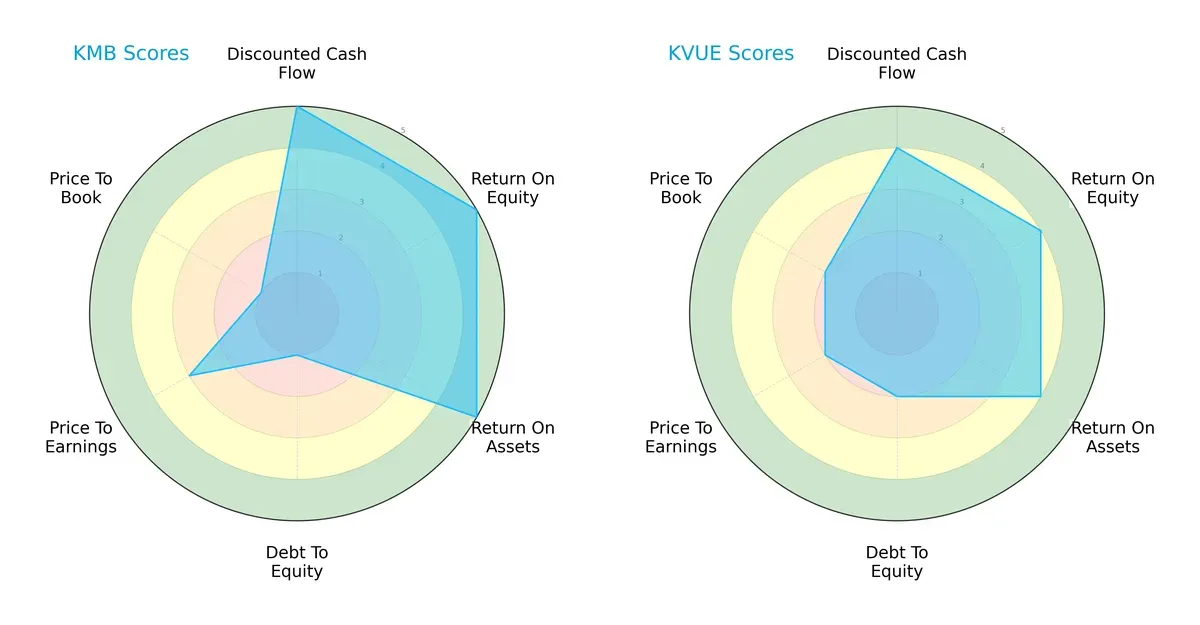
Kimberly-Clark demonstrates superior performance in DCF, ROE, and ROA, indicating robust profitability and asset efficiency. However, it carries significant leverage risks with poor Debt/Equity and Price-to-Book scores. Kenvue presents a more balanced, moderate profile, managing debt better but lacking Kimberly-Clark’s profitability edge. Kimberly-Clark relies on operational excellence, while Kenvue emphasizes financial stability.
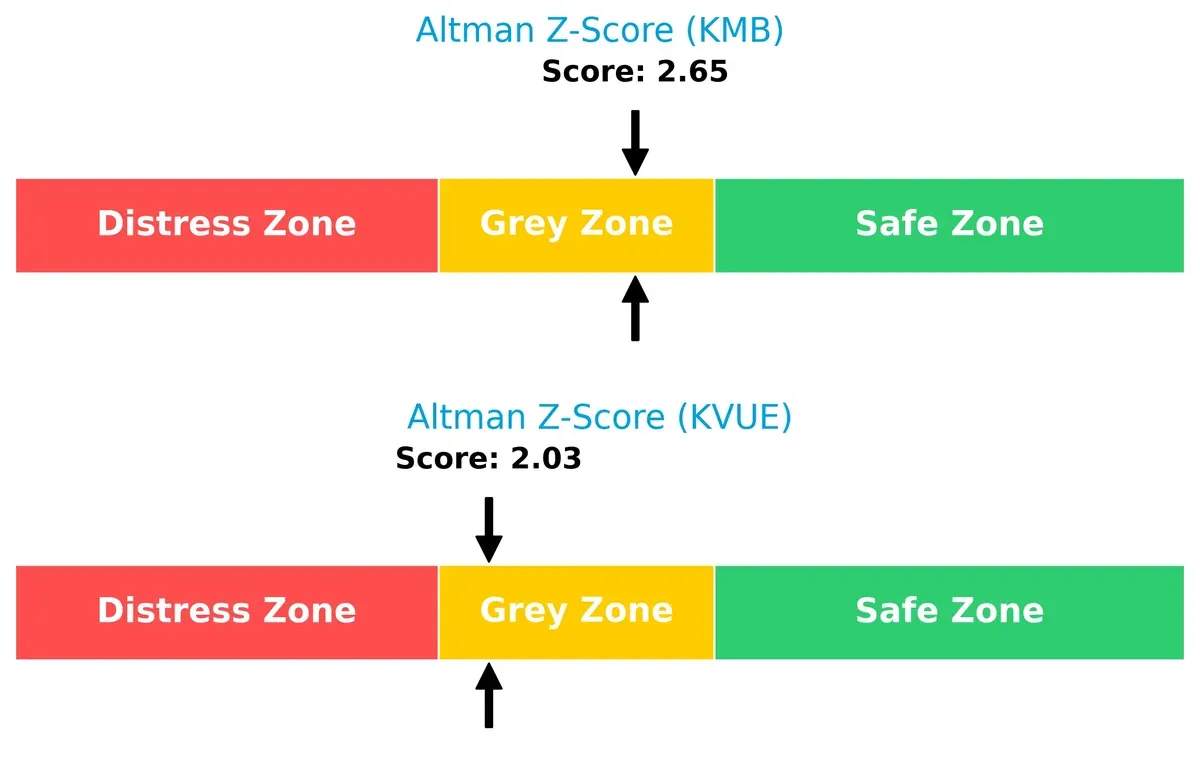
Bankruptcy Risk: Solvency Showdown
Kimberly-Clark’s Altman Z-Score (2.65) exceeds Kenvue’s (2.03), placing both in the grey zone but suggesting Kimberly-Clark has a moderately stronger buffer against bankruptcy risk in this cycle:
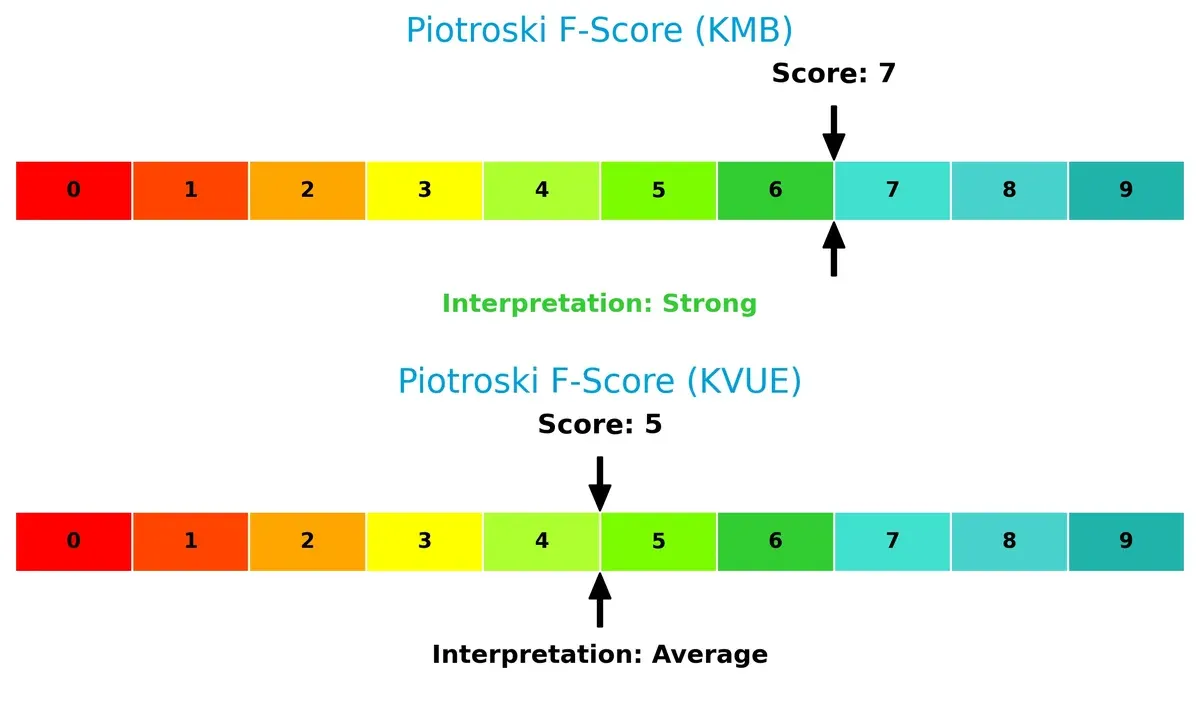
Financial Health: Quality of Operations
Kimberly-Clark scores a strong 7 on the Piotroski F-Score, outperforming Kenvue’s average 5. This signals Kimberly-Clark’s superior internal financial health and operational quality, while Kenvue shows potential red flags in efficiency and profitability metrics:
How are the two companies positioned?
This section dissects Kimberly-Clark and Kenvue’s operational DNA by comparing their revenue distribution and internal dynamics: strengths and weaknesses. The goal is to confront their economic moats and identify which model offers the most resilient, sustainable advantage today.
Revenue Segmentation: The Strategic Mix
This comparison dissects how Kimberly-Clark Corporation and Kenvue Inc. diversify their income streams and highlights their primary sector bets:
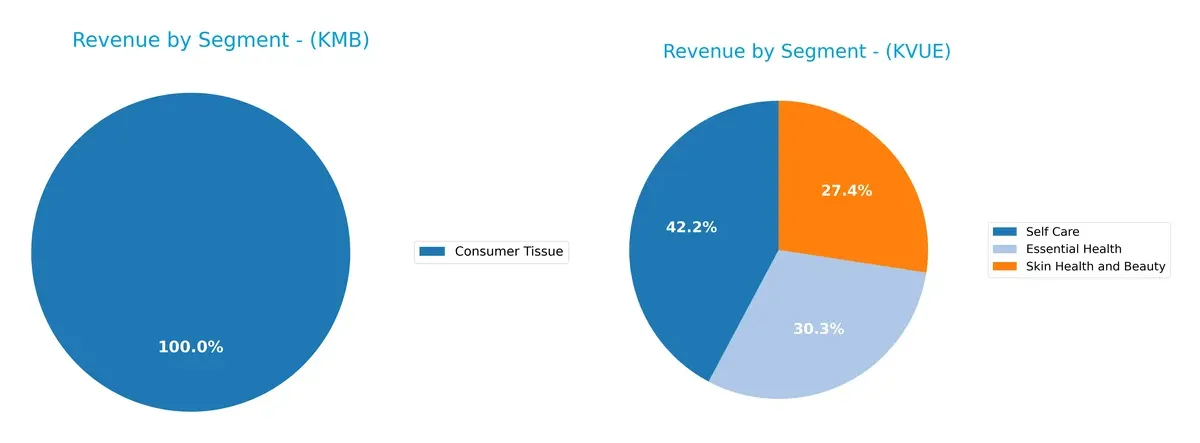
Kimberly-Clark anchors its revenue heavily in Personal Care at $10.7B and Consumer Tissue at $6.3B, with a smaller K-C Professional segment near $3.4B. Kenvue presents a more balanced mix: Self Care leads at $6.5B, followed by Essential Health at $4.7B and Skin Health and Beauty at $4.2B. Kimberly-Clark’s concentration risks contrast with Kenvue’s diversified ecosystem, which may offer better resilience amid sector shifts.
Strengths and Weaknesses Comparison
This table compares the Strengths and Weaknesses of Kimberly-Clark Corporation and Kenvue Inc.:
Kimberly-Clark Corporation Strengths
- Diverse revenue streams from Consumer Tissue, K-C Professional, and Personal Care
- Favorable net margin of 11.74%
- Strong dividend yield at 4.94%
- Low debt-to-assets ratio and strong interest coverage
Kenvue Inc. Strengths
- Balanced product segments across Essential Health, Self Care, and Skin Health and Beauty
- Favorable WACC at 5.86% supports capital efficiency
- High fixed asset turnover of 8.36
- Favorable dividend yield at 3.83%
Kimberly-Clark Corporation Weaknesses
- Unfavorable ROE and ROIC at 0% indicate weak capital returns
- Unfavorable liquidity ratios: current and quick ratios at 0
- Neutral P/E of 16.63 may limit growth expectations
- Unfavorable asset turnover ratios
Kenvue Inc. Weaknesses
- High P/E of 39.38 and PB of 4.2 suggest overvaluation
- Unfavorable liquidity ratios: current ratio 0.96, quick ratio 0.69
- Moderate debt levels with debt-to-assets at 34.06%
- Neutral interest coverage at 4.28
Kimberly-Clark’s strengths lie in profitability and capital structure but face liquidity and efficiency challenges. Kenvue shows operational asset efficiency and capital cost advantages but struggles with valuation and liquidity risks. These factors shape each company’s strategic financial priorities.
The Moat Duel: Analyzing Competitive Defensibility
A structural moat protects long-term profits from relentless competition and market disruption. Here’s how two industry players stack up:
Kimberly-Clark Corporation: Intangible Assets and Brand Loyalty
Kimberly-Clark leverages powerful brand recognition and deep distribution channels. This supports stable margins near 35% gross and 14% EBIT. However, declining revenue signals pressure on its moat in 2026.
Kenvue Inc.: Innovation and Expanding Product Ecosystem
Kenvue’s competitive edge lies in product innovation across health and beauty, driving a growing ROIC trend despite current margin pressures. Its diversified portfolio fuels expansion opportunities globally in 2026.
Brand Recognition vs. Innovation: Which Moat Holds Stronger?
Kimberly-Clark’s entrenched brand offers margin stability, but shrinking top-line growth weakens its fortress. Kenvue’s rising ROIC and innovation pipeline suggest a deeper moat developing. I see Kenvue better positioned to defend and grow market share in the evolving consumer health landscape.
Which stock offers better returns?
Over the past year, Kimberly-Clark Corporation and Kenvue Inc. showed notable price declines with distinct momentum shifts and trading volume trends.
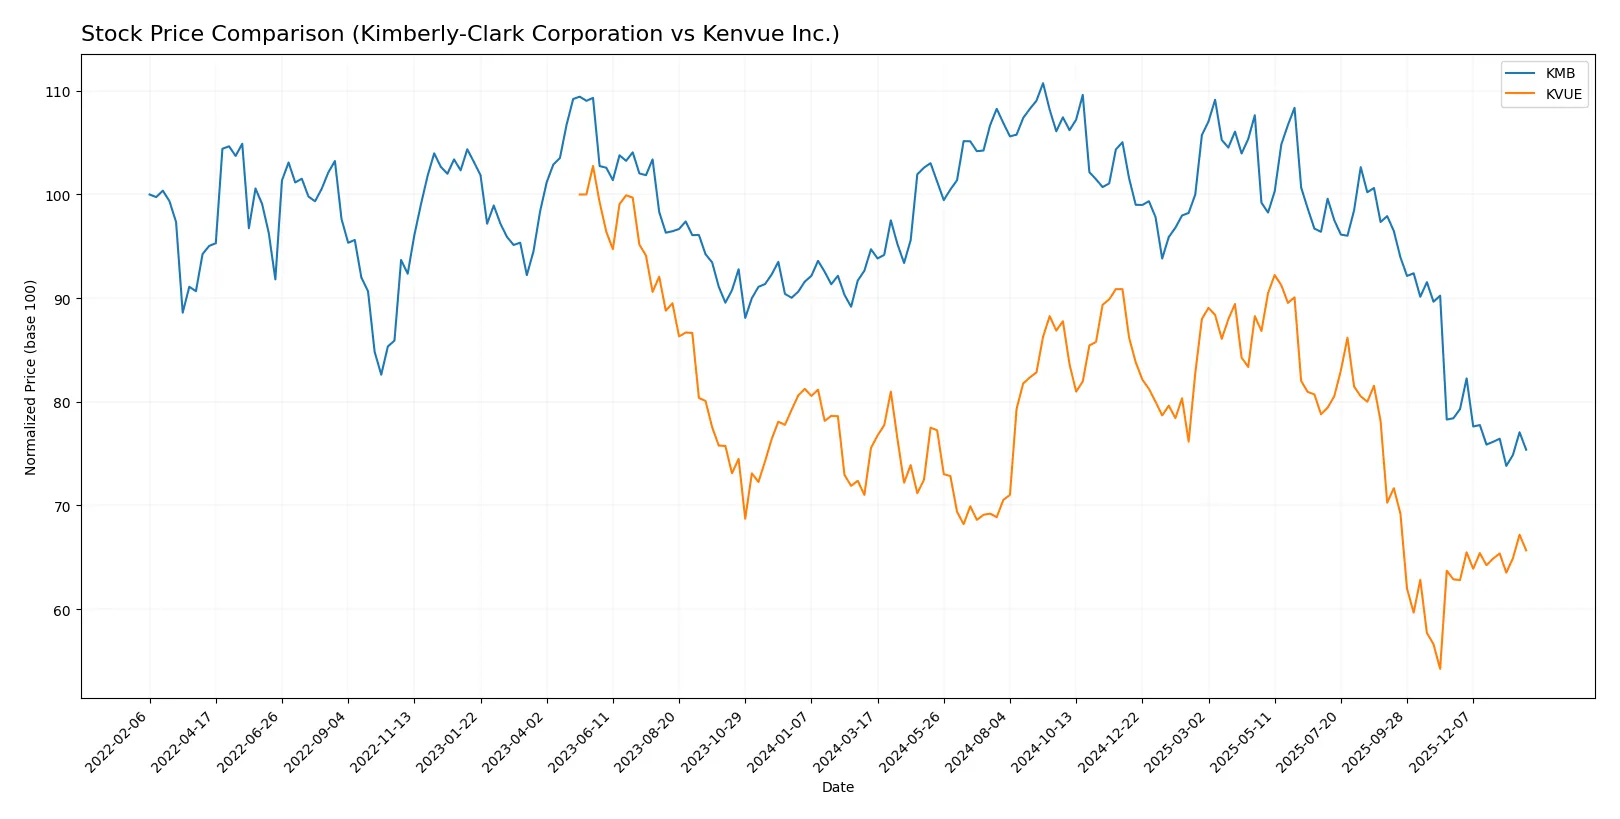
Trend Comparison
Kimberly-Clark’s stock fell 20.42% over the last 12 months, indicating a bearish trend with decelerating losses and a high 12.48 volatility. The recent quarter showed a continued decline of 3.87%.
Kenvue’s stock dropped 13.09% over the same period, also bearish but with accelerating losses and lower volatility at 2.49. Recently, it reversed direction, gaining 4.44%, signaling a mild recovery.
Kimberly-Clark suffered a steeper overall decline, while Kenvue’s recent positive momentum suggests it delivered better market performance in the last quarter.
Target Prices
Analysts present a cautiously optimistic consensus for Kimberly-Clark Corporation and Kenvue Inc.
| Company | Target Low | Target High | Consensus |
|---|---|---|---|
| Kimberly-Clark Corporation | 102 | 162 | 122.38 |
| Kenvue Inc. | 15 | 22 | 17.86 |
The target consensus for Kimberly-Clark sits about 22% above its current price of $99.99, suggesting notable upside potential. Kenvue’s consensus is near its $17.40 price, indicating a more balanced outlook from analysts.

Don’t Let Luck Decide Your Entry Point
Optimize your entry points with our advanced ProRealTime indicators. You’ll get efficient buy signals with precise price targets for maximum performance. Start outperforming now!
How do institutions grade them?
This section compares the latest institutional grades for Kimberly-Clark Corporation and Kenvue Inc.:
Kimberly-Clark Corporation Grades
The table below shows recent grades from reputable financial institutions for Kimberly-Clark Corporation.
| Grading Company | Action | New Grade | Date |
|---|---|---|---|
| UBS | Maintain | Neutral | 2026-01-28 |
| Citigroup | Maintain | Sell | 2026-01-14 |
| UBS | Maintain | Neutral | 2026-01-14 |
| TD Cowen | Maintain | Hold | 2026-01-08 |
| Wells Fargo | Maintain | Equal Weight | 2026-01-05 |
| Citigroup | Maintain | Sell | 2025-12-17 |
| BNP Paribas Exane | Maintain | Neutral | 2025-12-01 |
| Argus Research | Upgrade | Buy | 2025-11-13 |
| Wells Fargo | Maintain | Equal Weight | 2025-11-04 |
| Evercore ISI Group | Downgrade | In Line | 2025-11-04 |
Kenvue Inc. Grades
The table below lists recent institutional grades for Kenvue Inc. from well-known grading firms.
| Grading Company | Action | New Grade | Date |
|---|---|---|---|
| Jefferies | Downgrade | Hold | 2026-01-30 |
| Barclays | Maintain | Equal Weight | 2025-11-10 |
| Canaccord Genuity | Downgrade | Hold | 2025-10-29 |
| Jefferies | Maintain | Buy | 2025-10-27 |
| JP Morgan | Maintain | Overweight | 2025-10-10 |
| Citigroup | Maintain | Neutral | 2025-10-09 |
| UBS | Maintain | Neutral | 2025-10-08 |
| B of A Securities | Maintain | Buy | 2025-10-08 |
| Goldman Sachs | Maintain | Neutral | 2025-10-02 |
| Barclays | Maintain | Equal Weight | 2025-10-01 |
Which company has the best grades?
Kimberly-Clark mostly holds Neutral to Sell ratings, with a rare Buy upgrade. Kenvue carries more Buy and Overweight ratings but recent downgrades to Hold signal caution. Investors may find Kenvue’s grades slightly more optimistic but should consider the recent downgrade trend.
Risks specific to each company
The following categories identify critical pressure points and systemic threats facing Kimberly-Clark Corporation and Kenvue Inc. in the 2026 market environment:
1. Market & Competition
Kimberly-Clark Corporation
- Established brand portfolio in personal care, tissue, and professional segments; faces intense consumer product competition.
Kenvue Inc.
- Operates in consumer health with strong brands; competes in a fragmented health and beauty market with fast innovation cycles.
2. Capital Structure & Debt
Kimberly-Clark Corporation
- Favorable debt-to-equity metrics; strong interest coverage at 9.73x reduce financial distress risk.
Kenvue Inc.
- Moderate leverage with debt-to-equity around 0.9; interest coverage weaker at 4.28x signals moderate financial risk.
3. Stock Volatility
Kimberly-Clark Corporation
- Low beta at 0.277 indicates defensive stock with low market sensitivity.
Kenvue Inc.
- Higher beta at 0.551 suggests more price volatility and greater market risk exposure.
4. Regulatory & Legal
Kimberly-Clark Corporation
- Global operations expose it to evolving product safety and environmental regulations.
Kenvue Inc.
- As a newer public entity, faces regulatory scrutiny in health product compliance and post-spin-off governance.
5. Supply Chain & Operations
Kimberly-Clark Corporation
- Longstanding supply chain but faces risks from raw material inflation and logistics disruptions.
Kenvue Inc.
- Supply chain still maturing post-spin-off; operational efficiency improving but sensitive to input cost volatility.
6. ESG & Climate Transition
Kimberly-Clark Corporation
- Increasing ESG commitments required; pressure to reduce carbon footprint in manufacturing.
Kenvue Inc.
- Growing investor focus on sustainability; must accelerate climate initiatives to meet sector norms.
7. Geopolitical Exposure
Kimberly-Clark Corporation
- Moderate international footprint with exposure to trade tensions and currency fluctuations.
Kenvue Inc.
- Global operations subject to geopolitical risks, especially in emerging markets with regulatory unpredictability.
Which company shows a better risk-adjusted profile?
Kimberly-Clark’s strongest risk lies in operational cost pressures amid supply chain inflation. Kenvue faces its largest risk from higher stock volatility and moderate leverage. Kimberly-Clark’s conservative capital structure and lower beta offer a more favorable risk-adjusted profile. Notably, Kimberly-Clark’s interest coverage of 9.73x contrasts with Kenvue’s 4.28x, underscoring its stronger financial resilience.
Final Verdict: Which stock to choose?
Kimberly-Clark’s superpower lies in its resilient cash generation and strong dividend yield, appealing to income-focused investors. However, its shrinking revenue and declining ROIC serve as points of vigilance. It suits portfolios aiming for steady income with moderate growth risk.
Kenvue’s moat is its improving profitability and growing ROIC trend, signaling emerging competitive strength. Its higher valuation reflects market confidence but adds risk. Relative to Kimberly-Clark, it offers better growth potential with a slightly riskier profile, fitting GARP-oriented portfolios.
If you prioritize reliable income and capital preservation, Kimberly-Clark is the compelling choice due to its strong cash flow and dividend yield. However, if you seek growth with improving profitability, Kenvue offers better stability in ROIC and earnings expansion, despite its premium valuation.
Disclaimer: Investment carries a risk of loss of initial capital. The past performance is not a reliable indicator of future results. Be sure to understand risks before making an investment decision.
Go Further
I encourage you to read the complete analyses of Kimberly-Clark Corporation and Kenvue Inc. to enhance your investment decisions: