Kenvue Inc. and e.l.f. Beauty, Inc. are both key players in the Household & Personal Products industry, yet they occupy distinct niches within the consumer health and beauty market. Kenvue leverages a broad portfolio of established health and skincare brands, while e.l.f. Beauty drives innovation with a digitally native, trend-focused approach. This article will explore which company presents the most compelling investment opportunity for your portfolio in 2026.
Table of contents
Companies Overview
I will begin the comparison between Kenvue Inc. and e.l.f. Beauty, Inc. by providing an overview of these two companies and their main differences.
Kenvue Inc. Overview
Kenvue Inc. operates globally as a consumer health company focused on household and personal products. It segments its business into Self Care, Skin Health and Beauty, and Essential Health, offering well-known brands like Tylenol, Neutrogena, and Band-Aid. Established in 2022 and headquartered in Skillman, New Jersey, Kenvue is a subsidiary of Johnson & Johnson, with a market cap of $32.6B and 22,000 employees.
e.l.f. Beauty, Inc. Overview
e.l.f. Beauty, Inc. specializes in cosmetics and skin care products, marketing brands such as e.l.f. Cosmetics and Well People worldwide. It sells through retailers and e-commerce, focusing on eye, lip, face, and skin care. Founded in 2004 and based in Oakland, California, e.l.f. has a market cap of $4.9B, employs 633 people, and emphasizes direct-to-consumer channels alongside distribution.
Key similarities and differences
Both companies operate in the household and personal products sector, targeting consumer health and beauty markets. Kenvue’s larger scale and broad product segments contrast with e.l.f.’s focused cosmetic and skin care offerings and smaller workforce. Kenvue is a recent spin-off of a major conglomerate, while e.l.f. is an independent, growth-oriented beauty brand with a stronger emphasis on e-commerce and direct sales.
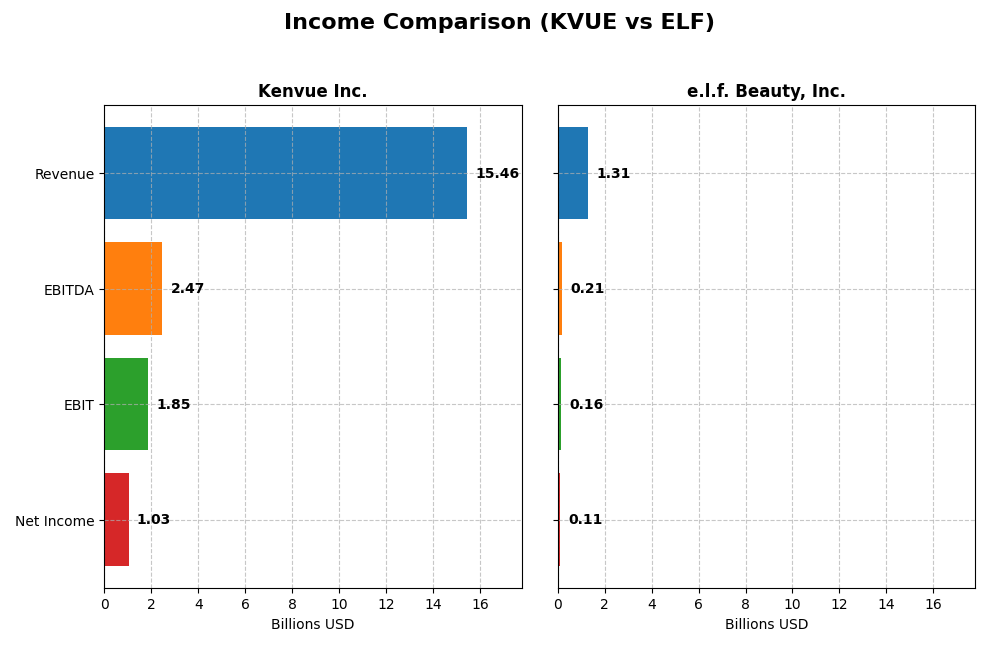
Income Statement Comparison
This table presents a factual comparison of key income statement metrics for Kenvue Inc. and e.l.f. Beauty, Inc. for their most recent fiscal years.
| Metric | Kenvue Inc. (KVUE) | e.l.f. Beauty, Inc. (ELF) |
|---|---|---|
| Market Cap | 32.6B | 4.9B |
| Revenue | 15.46B | 1.31B |
| EBITDA | 2.47B | 206M |
| EBIT | 1.85B | 162M |
| Net Income | 1.03B | 112M |
| EPS | 0.54 | 1.99 |
| Fiscal Year | 2024 | 2025 |
Income Statement Interpretations
Kenvue Inc.
Kenvue’s revenue showed modest growth from 2020 to 2024, increasing from $14.5B to $15.45B, while net income improved significantly overall despite a recent decline. Margins remained generally stable with a favorable gross margin near 58%, but the latest year saw a sharp drop in EBIT and net margin, reflecting operational challenges and slower growth. The 2024 results highlight a notable slowdown, with net income falling to $1.03B from $1.66B.
e.l.f. Beauty, Inc.
e.l.f. Beauty exhibited strong revenue growth, rising from $318M in 2021 to $1.31B in 2025, supported by expanding gross and EBIT margins above 70% and 12%, respectively. Despite favorable growth in revenue and EBIT in the latest year, net margin and EPS declined, indicating margin pressure. The company posted net income of $112M in 2025, down from $128M in 2024, reflecting mixed profitability trends amid rapid expansion.
Which one has the stronger fundamentals?
Both companies demonstrate favorable income statement fundamentals overall, with e.l.f. Beauty showing stronger revenue and net income growth percentages over the period. Kenvue maintains higher absolute revenue and scale but faces recent margin and profitability headwinds. e.l.f. Beauty’s higher gross margin and consistent revenue expansion contrast with Kenvue’s slower growth and margin contraction, highlighting different operational dynamics and growth profiles.
Financial Ratios Comparison
The table below presents a side-by-side comparison of key financial ratios for Kenvue Inc. (KVUE) and e.l.f. Beauty, Inc. (ELF) based on their most recent fiscal year data.
| Ratios | Kenvue Inc. (2024 FY) | e.l.f. Beauty, Inc. (2025 FY) |
|---|---|---|
| ROE | 10.7% | 14.7% |
| ROIC | 6.2% | 11.2% |
| P/E | 39.4 | 31.5 |
| P/B | 4.20 | 4.64 |
| Current Ratio | 0.96 | 3.05 |
| Quick Ratio | 0.69 | 2.00 |
| D/E (Debt-to-Equity) | 0.90 | 0.41 |
| Debt-to-Assets | 34.1% | 25.1% |
| Interest Coverage | 4.27 | 9.20 |
| Asset Turnover | 0.60 | 1.05 |
| Fixed Asset Turnover | 8.36 | 45.63 |
| Payout Ratio | 151% | 0% |
| Dividend Yield | 3.83% | 0% |
Interpretation of the Ratios
Kenvue Inc.
Kenvue’s ratios present a mixed picture with key metrics such as ROE (10.65%) and net margin (6.66%) rated neutral, while valuation multiples like PE (39.38) and PB (4.2) are unfavorable. Liquidity ratios are below 1, indicating potential short-term risk. The dividend yield of 3.83% is favorable, supported by a stable payout, but free cash flow to equity is negative, raising caution on sustainability.
e.l.f. Beauty, Inc.
e.l.f. Beauty shows stronger operational efficiency with favorable asset turnover (1.05) and interest coverage (9.44), but faces challenges from a high WACC (11.49%) and valuation concerns, including PE (31.49). The company does not pay dividends, likely focusing on reinvestment and growth, as reflected in a favorable debt-to-equity ratio (0.41) and strong liquidity with a quick ratio of 2.0.
Which one has the best ratios?
e.l.f. Beauty exhibits more favorable operational and liquidity ratios, suggesting efficient asset use and financial stability, despite some valuation concerns. Kenvue has a slightly unfavorable overall ratio profile with weaker liquidity and valuation metrics but offers a dividend yield. The choice depends on investor priorities between income and growth metrics.
Strategic Positioning
This section compares the strategic positioning of Kenvue Inc. and e.l.f. Beauty, Inc. regarding market position, key segments, and exposure to technological disruption:
Kenvue Inc.
- Large market cap of 32.6B with moderate beta 0.55; operates worldwide in consumer health sector.
- Diversified segments: Self Care, Skin Health and Beauty, Essential Health, with established brands.
- No explicit mention of technological disruption exposure in the consumer health products sector.
e.l.f. Beauty, Inc.
- Smaller market cap of 4.9B with higher beta 1.72; focuses on cosmetics and skin care worldwide.
- Concentrated in eye, lip, face, skin care products sold via retail and direct-to-consumer channels.
- No explicit mention of technological disruption exposure in cosmetics and skin care product offerings.
Kenvue Inc. vs e.l.f. Beauty, Inc. Positioning
Kenvue’s diversified portfolio across multiple health and beauty segments contrasts with e.l.f.’s focused cosmetic product line. Kenvue benefits from established global brands and scale, while e.l.f. emphasizes direct-to-consumer sales and niche branding but with a smaller employee base.
Which has the best competitive advantage?
Kenvue shows a slightly favorable moat with growing profitability despite shedding value, indicating improving competitive positioning. e.l.f. has a slightly unfavorable moat, shedding value but also showing growing profitability, suggesting a weaker competitive advantage currently.
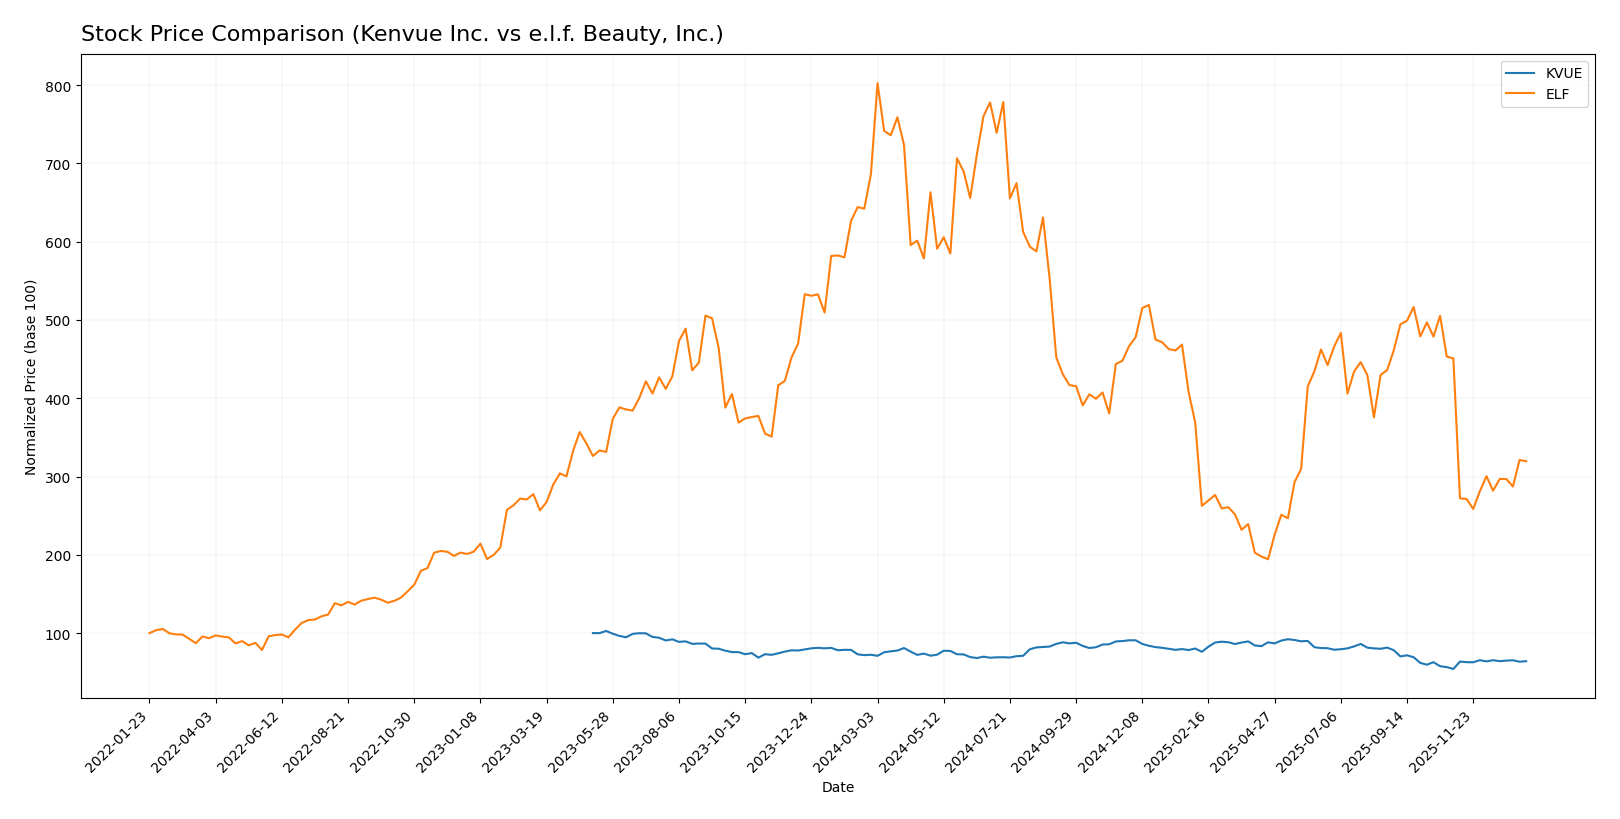
Stock Comparison
The stock price dynamics over the past 12 months reveal contrasting bearish trends for Kenvue Inc. and e.l.f. Beauty, Inc., with Kenvue showing recent recovery while e.l.f. continues to face downward pressure.
Trend Analysis
Kenvue Inc. experienced a bearish trend with an 11.37% decline over the past year, marked by accelerating downward momentum, a standard deviation of 2.47, and prices ranging from 14.37 to 24.44. Recently, the stock reversed course with an 18.3% gain, showing moderate volatility and a positive slope.
e.l.f. Beauty, Inc. showed a pronounced bearish trend with a 53.44% drop over the same period, accelerating losses, and high volatility reflected in a 43.02 standard deviation. Recent performance worsened with a 29.11% decrease, increasing downward slope and elevated volatility.
Comparing both, Kenvue’s stock delivered a significantly better market performance, showing a smaller overall decline and recent price recovery, while e.l.f. stock remained deeply bearish with higher volatility and sustained losses.
Target Prices
Analysts present a clear target price consensus for both Kenvue Inc. and e.l.f. Beauty, Inc.
| Company | Target High | Target Low | Consensus |
|---|---|---|---|
| Kenvue Inc. | 23 | 15 | 18.57 |
| e.l.f. Beauty, Inc. | 165 | 85 | 128.17 |
The consensus target prices suggest moderate upside potential for Kenvue, slightly above its current price of $17, while e.l.f. Beauty’s target indicates significant growth potential versus its current price near $86.58.
Analyst Opinions Comparison
This section compares analysts’ ratings and grades for Kenvue Inc. and e.l.f. Beauty, Inc.:
Rating Comparison
Kenvue Inc. Rating
- Rating: B+ indicating a very favorable evaluation
- Discounted Cash Flow Score: 4, favorable
- ROE Score: 4, favorable
- ROA Score: 4, favorable
- Debt To Equity Score: 2, moderate
- Overall Score: 3, moderate
e.l.f. Beauty, Inc. Rating
- Rating: C+ also noted as very favorable
- Discounted Cash Flow Score: 3, moderate
- ROE Score: 3, moderate
- ROA Score: 3, moderate
- Debt To Equity Score: 2, moderate
- Overall Score: 2, moderate
Which one is the best rated?
Kenvue Inc. is generally better rated than e.l.f. Beauty, with higher scores in discounted cash flow, ROE, ROA, and overall score. Both have the same debt-to-equity score, but Kenvue’s rating is a notch above.
Scores Comparison
Here is a comparison of the Altman Z-Score and Piotroski Score for Kenvue and e.l.f. Beauty:
Kenvue Scores
- Altman Z-Score: 1.95, in the grey zone indicating moderate bankruptcy risk.
- Piotroski Score: 5, reflecting average financial strength.
e.l.f. Beauty Scores
- Altman Z-Score: 3.44, in the safe zone indicating low bankruptcy risk.
- Piotroski Score: 5, reflecting average financial strength.
Which company has the best scores?
e.l.f. Beauty has a higher Altman Z-Score, placing it in the safe zone, while Kenvue is in the grey zone. Both companies have the same average Piotroski Score of 5.
Grades Comparison
Here is a detailed comparison of the latest reliable grades for Kenvue Inc. and e.l.f. Beauty, Inc.:
Kenvue Inc. Grades
The following table shows recent grades assigned to Kenvue Inc. by recognized grading companies:
| Grading Company | Action | New Grade | Date |
|---|---|---|---|
| Barclays | Maintain | Equal Weight | 2025-11-10 |
| Canaccord Genuity | Downgrade | Hold | 2025-10-29 |
| Jefferies | Maintain | Buy | 2025-10-27 |
| JP Morgan | Maintain | Overweight | 2025-10-10 |
| Citigroup | Maintain | Neutral | 2025-10-09 |
| B of A Securities | Maintain | Buy | 2025-10-08 |
| UBS | Maintain | Neutral | 2025-10-08 |
| Goldman Sachs | Maintain | Neutral | 2025-10-02 |
| Barclays | Maintain | Equal Weight | 2025-10-01 |
| Rothschild & Co | Upgrade | Buy | 2025-09-26 |
Kenvue’s grades generally range from Neutral to Buy, with a trend of maintaining current ratings and occasional upgrades.
e.l.f. Beauty, Inc. Grades
Below are the recent grades from established grading firms for e.l.f. Beauty, Inc.:
| Grading Company | Action | New Grade | Date |
|---|---|---|---|
| Piper Sandler | Maintain | Neutral | 2025-12-22 |
| JP Morgan | Maintain | Overweight | 2025-12-18 |
| Goldman Sachs | Maintain | Buy | 2025-11-07 |
| Baird | Maintain | Outperform | 2025-11-06 |
| Jefferies | Maintain | Buy | 2025-11-06 |
| Piper Sandler | Downgrade | Neutral | 2025-11-06 |
| UBS | Maintain | Neutral | 2025-11-06 |
| Canaccord Genuity | Maintain | Buy | 2025-11-06 |
| JP Morgan | Maintain | Overweight | 2025-11-06 |
| Jefferies | Maintain | Buy | 2025-10-28 |
e.l.f. Beauty’s ratings mostly fall between Neutral and Buy, with some Outperform ratings, showing stable and positive sentiment.
Which company has the best grades?
e.l.f. Beauty, Inc. holds a stronger consensus with more frequent Buy and Outperform ratings compared to Kenvue’s Hold and Neutral grades. This suggests potentially higher investor confidence and growth expectations for e.l.f. Beauty, which could influence portfolio positioning accordingly.
Strengths and Weaknesses
Below is a comparative overview of key strengths and weaknesses for Kenvue Inc. (KVUE) and e.l.f. Beauty, Inc. (ELF) based on recent financial and strategic data.
| Criterion | Kenvue Inc. (KVUE) | e.l.f. Beauty, Inc. (ELF) |
|---|---|---|
| Diversification | Strong product diversification across Essential Health (4.69B), Self Care (6.53B), Skin Health and Beauty (4.24B) | Focused primarily on beauty products; less diversified |
| Profitability | Moderate with net margin 6.66%, ROIC 6.25%, slightly favorable WACC 5.83% | Higher net margin 8.53%, ROIC 11.21% but ROIC below WACC (11.49%), indicating value destruction |
| Innovation | Growing ROIC trend (+261%), slightly favorable moat status indicating improving profitability | Strong ROIC growth (+418%) but slightly unfavorable moat; innovation driving profitability despite value shedding |
| Global presence | Established global reach in health and beauty sectors | Primarily US-focused with growing international presence but less diversified globally |
| Market Share | Large presence in multiple health and beauty segments with steady revenue growth | Niche player with strong brand recognition but smaller market share |
Key takeaways: Kenvue offers broad diversification and stable profitability with improving returns, making it a slightly favorable investment. e.l.f. Beauty shows strong innovation and profitability growth but struggles to create shareholder value due to high capital costs, suggesting higher risk despite growth potential.
Risk Analysis
Below is a comparative overview of key risks facing Kenvue Inc. and e.l.f. Beauty, Inc. as of their most recent fiscal years.
| Metric | Kenvue Inc. (KVUE) | e.l.f. Beauty, Inc. (ELF) |
|---|---|---|
| Market Risk | Moderate, beta 0.55 indicating lower volatility | Higher, beta 1.72 reflecting greater sensitivity to market swings |
| Debt level | Moderate, debt/equity 0.9, debt to assets 34% | Low, debt/equity 0.41, debt to assets 25% |
| Regulatory Risk | Moderate, consumer health focus with compliance needs | Moderate, cosmetics industry faces evolving regulations |
| Operational Risk | Moderate, 22K employees and broad product lines | Moderate, smaller scale with 633 employees but reliance on retail channels |
| Environmental Risk | Moderate, potential concerns from consumer product ingredients | Moderate, growing scrutiny on sustainability in beauty products |
| Geopolitical Risk | Low, primarily US-based with global operations | Low, US-based with international distributors |
Kenvue’s most impactful risks include moderate debt levels and regulatory compliance in consumer health, while e.l.f. Beauty faces higher market risk due to its beta and operational risks tied to retail channel dependence. Both companies show average financial strength scores, demanding cautious portfolio inclusion considering market volatility and sector-specific regulatory shifts.
Which Stock to Choose?
Kenvue Inc. (KVUE) shows a favorable income statement with a 6.66% net margin and growing profitability over 2020-2024, despite a slight one-year decline. Financial ratios are slightly unfavorable overall, with some strong points like a 3.83% dividend yield and fixed asset turnover, while debt levels and liquidity ratios remain neutral to unfavorable. Its rating is very favorable (B+), supported by moderate overall scores.
e.l.f. Beauty, Inc. (ELF) presents a favorable income statement with an 8.53% net margin and strong revenue and net income growth over 2021-2025, although one-year net margin and EPS growth are negative. Its financial ratios are balanced with equal favorable and unfavorable metrics; notably, debt is well managed and liquidity strong. The company holds a very favorable rating (C+), but with moderate overall scores and some valuation concerns.
For investors, KVUE’s very favorable rating and consistent income statement performance might appear more suitable for those valuing stability and dividend income, whereas ELF’s robust growth trends and improving profitability could be more appealing to growth-oriented investors, despite some valuation and financial ratio caution signals.
Disclaimer: Investment carries a risk of loss of initial capital. The past performance is not a reliable indicator of future results. Be sure to understand risks before making an investment decision.
Go Further
I encourage you to read the complete analyses of Kenvue Inc. and e.l.f. Beauty, Inc. to enhance your investment decisions: