Xylem Inc. and Kadant Inc. are two prominent players in the industrial machinery sector, each delivering specialized engineered solutions across water management and material handling industries. Both companies emphasize innovation to meet evolving environmental and operational challenges, making them relevant contenders for investors focused on industrial growth and sustainability. This article will analyze their strengths and risks to help you decide which stock could be a smarter addition to your portfolio.
Table of contents
Companies Overview
I will begin the comparison between Xylem Inc. and Kadant Inc. by providing an overview of these two companies and their main differences.
Xylem Inc. Overview
Xylem Inc. focuses on designing, manufacturing, and servicing engineered products and solutions for water and wastewater applications globally. Operating through Water Infrastructure, Applied Water, and Measurement & Control Solutions segments, Xylem offers pumps, filtration equipment, smart meters, and software services. The company serves residential, commercial, and industrial markets and is headquartered in Rye Brook, New York, with a workforce of 23K employees.
Kadant Inc. Overview
Kadant Inc. supplies technologies and engineered systems worldwide, operating through Flow Control, Industrial Processing, and Material Handling segments. Its products include fluid-handling systems, industrial machinery, and conveying equipment, serving industries like packaging and wood products. Kadant is headquartered in Westford, Massachusetts, with about 3.5K employees, focusing on specialized industrial solutions for diverse manufacturing sectors.
Key similarities and differences
Both Xylem and Kadant operate in the industrial machinery sector, providing engineered solutions globally. Xylem concentrates on water-related applications with a broader product range including software and smart technologies, while Kadant focuses on fluid handling, industrial processing, and material handling systems for manufacturing industries. Xylem’s workforce and market cap are significantly larger, reflecting a broader scale of operations compared to Kadant’s more specialized industrial focus.
Income Statement Comparison
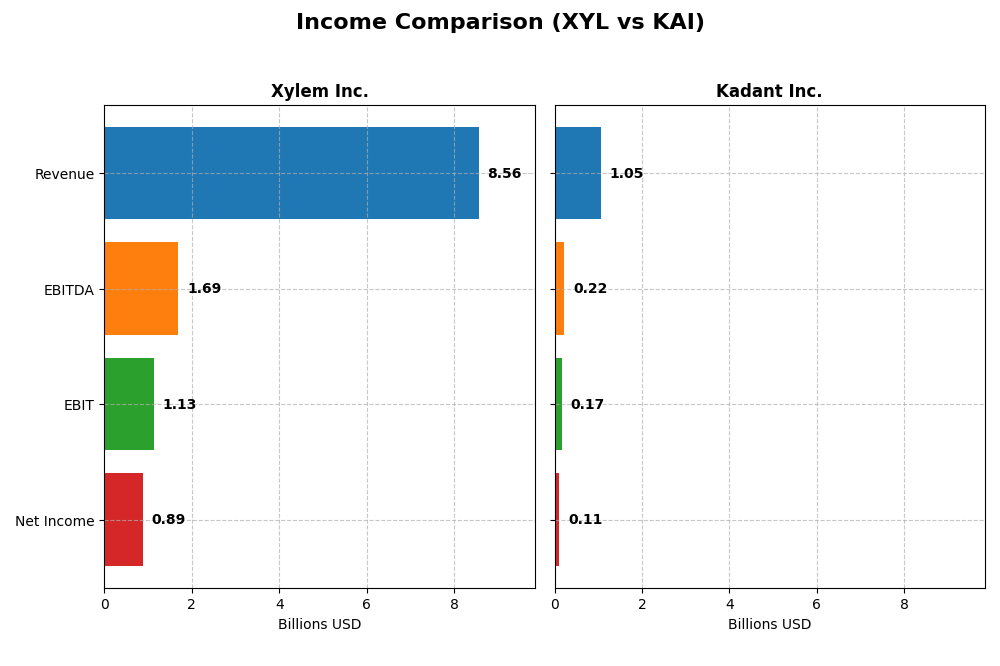
Below is a comparison of key income statement metrics for Xylem Inc. and Kadant Inc. for the fiscal year 2024.
| Metric | Xylem Inc. (XYL) | Kadant Inc. (KAI) |
|---|---|---|
| Market Cap | 34B | 3.8B |
| Revenue | 8.56B | 1.05B |
| EBITDA | 1.69B | 223M |
| EBIT | 1.13B | 173M |
| Net Income | 890M | 112M |
| EPS | 3.67 | 9.51 |
| Fiscal Year | 2024 | 2024 |
Income Statement Interpretations
Xylem Inc.
Xylem’s revenue and net income have shown strong growth from 2020 to 2024, with revenue rising from $4.9B to $8.6B and net income increasing from $254M to $890M. Margins improved notably, with a gross margin of 37.51% and net margin of 10.39% in 2024. The latest year saw a robust 16.3% revenue growth and a 25.7% net margin expansion, reflecting enhanced profitability.
Kadant Inc.
Kadant’s revenue increased steadily from $635M in 2020 to $1.05B in 2024, with net income growing from $55M to $112M. Gross and EBIT margins were solid at 44.25% and 16.43% respectively in 2024. However, recent performance showed slower EBIT growth of 3.4% and a 12.6% decline in net margin, signaling some margin pressure despite favorable overall trends.
Which one has the stronger fundamentals?
Xylem displays stronger fundamentals with consistent and substantial growth across revenue, net income, and margins, supported by favorable evaluations in all key metrics. Kadant, while showing solid longer-term growth and good margins, faces recent margin contraction and mixed growth signals. Overall, Xylem’s income statement trends appear more robust and stable.
Financial Ratios Comparison
The table below presents a side-by-side comparison of key financial ratios for Xylem Inc. (XYL) and Kadant Inc. (KAI) based on their most recent fiscal year data from 2024.
| Ratios | Xylem Inc. (XYL) | Kadant Inc. (KAI) |
|---|---|---|
| ROE | 8.36% | 13.17% |
| ROIC | 5.78% | 10.08% |
| P/E | 31.63 | 36.90 |
| P/B | 2.64 | 4.86 |
| Current Ratio | 1.75 | 2.31 |
| Quick Ratio | 1.33 | 1.55 |
| D/E | 0.20 | 0.38 |
| Debt-to-Assets | 12.88% | 22.57% |
| Interest Coverage | 22.93 | 8.55 |
| Asset Turnover | 0.52 | 0.74 |
| Fixed Asset Turnover | 7.43 | 6.18 |
| Payout Ratio | 39.33% | 13.15% |
| Dividend Yield | 1.24% | 0.36% |
Interpretation of the Ratios
Xylem Inc.
Xylem Inc. shows a mixed financial profile with half of its key ratios favorable, including a strong current ratio of 1.75 and a low debt-to-equity ratio of 0.2, indicating solid liquidity and conservative leverage. However, the return on equity at 8.36% and a price-to-earnings ratio of 31.63 are less favorable, suggesting moderate profitability and valuation concerns. The dividend yield stands at 1.24%, reflecting a neutral return to shareholders with manageable payout risk.
Kadant Inc.
Kadant Inc. presents a favorable ratio set overall, with 57% of key metrics rated positively, including a strong net margin of 10.59% and a robust return on invested capital of 10.08%. The company maintains good liquidity with a current ratio of 2.31 but faces valuation challenges with a high price-to-earnings ratio of 36.9 and price-to-book of 4.86. Its dividend yield is low at 0.36%, indicating limited income distribution to shareholders.
Which one has the best ratios?
Kadant Inc. exhibits a more favorable overall ratio profile, particularly in profitability and liquidity, despite valuation drawbacks. Xylem Inc. has a balanced but slightly less favorable ratio mix, with stronger leverage and interest coverage metrics. Both companies pay dividends, but Kadant’s lower yield and higher valuation reflect different shareholder return dynamics compared to Xylem.
Strategic Positioning
This section compares the strategic positioning of Xylem Inc. and Kadant Inc. regarding market position, key segments, and exposure to technological disruption:
Xylem Inc.
- Leading industrial machinery firm with a large market cap of 34B and exposure to NYSE competitive pressures.
- Diverse segments: Water Infrastructure, Applied Water, Measurement & Control Solutions drive revenues.
- Exposure includes smart meters, software, and advanced water treatment technologies.
Kadant Inc.
- Smaller industrial machinery player with 3.8B market cap facing competitive pressure on NYSE.
- Focused on Flow Control, Industrial Processing, and Material Handling segments with specialized products.
- Emphasizes engineered systems in fluid handling and industrial automation, with less mention of digital disruption.
Xylem Inc. vs Kadant Inc. Positioning
Xylem’s diversified water-related segments offer broad market coverage and technological integration, while Kadant’s more concentrated segments focus on niche industrial and material handling solutions. Xylem benefits from scale, Kadant from specialization.
Which has the best competitive advantage?
Kadant shows a slightly favorable moat with growing profitability but no clear competitive advantage yet. Xylem is slightly unfavorable, shedding value despite increasing ROIC, indicating weaker moat protection at present.
Stock Comparison
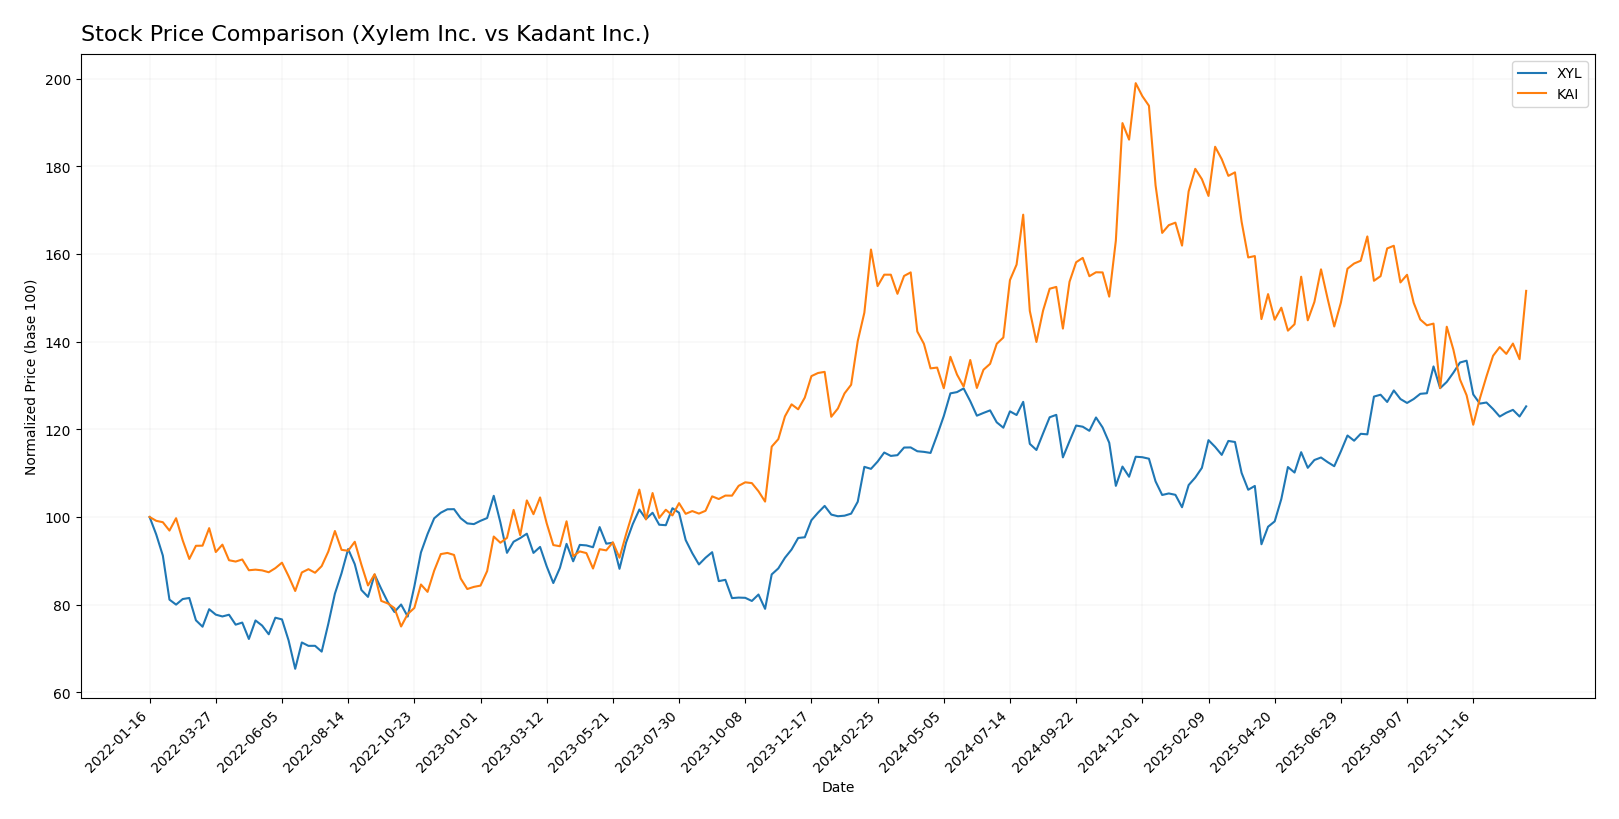
The stock price movements over the past 12 months reveal a bullish trend for Xylem Inc. with decelerating gains, while Kadant Inc. experienced an overall bearish trend despite recent acceleration in price recovery.
Trend Analysis
Xylem Inc. (XYL) showed a 12.84% price increase over the past year, indicating a bullish trend with deceleration. The stock ranged between 104.6 and 151.31, with moderate volatility at 9.45%.
Kadant Inc. (KAI) declined by 5.86%, marking a bearish trend with accelerating price changes. It exhibited higher volatility at 34.44%, with prices fluctuating from 254.91 to 419.01.
Comparing trends, Xylem delivered the highest market performance with a stable upward trajectory, while Kadant lagged despite recent positive momentum.
Target Prices
The current target price consensus reflects positive analyst expectations for both Xylem Inc. and Kadant Inc.
| Company | Target High | Target Low | Consensus |
|---|---|---|---|
| Xylem Inc. | 178 | 150 | 169.43 |
| Kadant Inc. | 410 | 275 | 342.5 |
Analysts expect Xylem’s stock to rise from its current price of 139.69 USD toward the consensus target of 169.43 USD, while Kadant’s stock, trading at 319.22 USD, shows potential upside to the 342.5 USD consensus target.
Analyst Opinions Comparison
This section compares analysts’ ratings and grades for Xylem Inc. and Kadant Inc.:
Rating Comparison
Xylem Inc. Rating
- Rating: B, classified as Very Favorable by analysts.
- Discounted Cash Flow Score: 3, indicating a moderate valuation based on future cash flows.
- ROE Score: 3, showing moderate efficiency in generating profit from shareholders’ equity.
- ROA Score: 4, reflecting favorable asset utilization to generate earnings.
- Debt To Equity Score: 3, indicating moderate financial risk with balanced debt levels.
- Overall Score: 3, representing a moderate overall financial standing.
Kadant Inc. Rating
- Rating: B, classified as Very Favorable by analysts.
- Discounted Cash Flow Score: 3, indicating a moderate valuation based on future cash flows.
- ROE Score: 3, showing moderate efficiency in generating profit from shareholders’ equity.
- ROA Score: 4, reflecting favorable asset utilization to generate earnings.
- Debt To Equity Score: 3, indicating moderate financial risk with balanced debt levels.
- Overall Score: 3, representing a moderate overall financial standing.
Which one is the best rated?
Both Xylem Inc. and Kadant Inc. share identical ratings and scores across all measured financial metrics. Neither company is rated higher than the other based on the provided data.
Scores Comparison
This section compares the Altman Z-Score and Piotroski Score for both companies:
Xylem Inc. Scores
- Altman Z-Score: 4.89, indicating financial safety and very low bankruptcy risk.
- Piotroski Score: 8, classified as very strong financial health and good investment potential.
Kadant Inc. Scores
- Altman Z-Score: 5.59, indicating financial safety and very low bankruptcy risk.
- Piotroski Score: 7, classified as strong financial health and good investment potential.
Which company has the best scores?
Kadant Inc. has a higher Altman Z-Score, signaling slightly better financial stability, while Xylem Inc. has a higher Piotroski Score, indicating stronger financial health. Each excels in a different score category.
Grades Comparison
The following section compares the recent grades assigned to Xylem Inc. and Kadant Inc. by recognized grading firms:
Xylem Inc. Grades
This table summarizes the latest grades given to Xylem Inc. by major financial institutions.
| Grading Company | Action | New Grade | Date |
|---|---|---|---|
| Barclays | Maintain | Overweight | 2026-01-07 |
| Mizuho | Maintain | Neutral | 2026-01-05 |
| TD Cowen | Maintain | Hold | 2025-12-05 |
| UBS | Maintain | Buy | 2025-11-06 |
| RBC Capital | Maintain | Outperform | 2025-10-29 |
| Stifel | Maintain | Buy | 2025-10-29 |
| Barclays | Maintain | Overweight | 2025-10-29 |
| Citigroup | Maintain | Buy | 2025-10-29 |
| Citigroup | Maintain | Buy | 2025-10-09 |
| Mizuho | Maintain | Neutral | 2025-09-12 |
Xylem’s grades consistently range between Hold and Buy equivalents, with multiple firms maintaining positive outlooks such as Overweight and Outperform.
Kadant Inc. Grades
This table presents the recent grades awarded to Kadant Inc. by credible grading firms.
| Grading Company | Action | New Grade | Date |
|---|---|---|---|
| Barrington Research | Maintain | Outperform | 2025-10-30 |
| Barrington Research | Maintain | Outperform | 2025-10-29 |
| Barrington Research | Maintain | Outperform | 2025-10-27 |
| Barrington Research | Maintain | Outperform | 2025-10-10 |
| Barrington Research | Maintain | Outperform | 2025-09-23 |
| DA Davidson | Maintain | Neutral | 2025-08-04 |
| Barrington Research | Maintain | Outperform | 2025-07-30 |
| Barrington Research | Maintain | Outperform | 2025-07-29 |
| Barrington Research | Maintain | Outperform | 2025-05-01 |
| DA Davidson | Maintain | Neutral | 2025-05-01 |
Kadant’s grades predominantly indicate an Outperform rating by Barrington Research, with occasional Neutral ratings by DA Davidson, reflecting a generally positive but less diversified analyst base.
Which company has the best grades?
Kadant Inc. holds consistently higher grades, largely marked as Outperform, compared to Xylem Inc.’s mixed range from Hold to Buy equivalents. This stronger consensus could influence investors seeking potentially higher growth prospects, while the breadth of Xylem’s analyst coverage suggests more varied opinions on its outlook.
Strengths and Weaknesses
Below is a comparative overview of key strengths and weaknesses for Xylem Inc. (XYL) and Kadant Inc. (KAI) based on the most recent financial and operational data.
| Criterion | Xylem Inc. (XYL) | Kadant Inc. (KAI) |
|---|---|---|
| Diversification | Broad product lines across water infrastructure and control solutions, generating ~7.56B USD revenue in 2024, showing good segment variety | Focused on capital equipment and parts for papermaking and related industries, narrower product range with ~1.05B USD revenue in 2024 |
| Profitability | Net margin 10.39% (favorable), ROIC 5.78% (neutral), but ROIC < WACC indicates value destruction | Net margin 10.59% (favorable), ROIC 10.08% (favorable), ROIC slightly above WACC indicating slight value creation |
| Innovation | Moderate, with growing ROIC trend (+31.7%) but a Slightly Unfavorable moat rating suggests limited competitive advantage | Moderate to strong innovation with ROIC growth (+31.3%) and Slightly Favorable moat, implying improving profitability and potential moat |
| Global presence | Strong global footprint supported by diversified water infrastructure and solutions | More specialized market presence, less diversified globally but solid in niche markets |
| Market Share | Leading in water infrastructure sectors with consistent revenue growth in key segments | Stable market share in paper and fiber processing equipment, with steady revenue growth in capital and parts segments |
In summary, Xylem Inc. has a broader diversification and strong global presence but is currently shedding value despite profitability. Kadant Inc. exhibits better value creation with favorable profitability ratios and growing ROIC, though with narrower market diversification. Both companies show positive ROIC trends, but Kadant’s financial metrics suggest a more favorable risk-reward profile for investors.
Risk Analysis
Below is a comparative risk overview of Xylem Inc. (XYL) and Kadant Inc. (KAI) based on their latest financial and operational data for 2024:
| Metric | Xylem Inc. (XYL) | Kadant Inc. (KAI) |
|---|---|---|
| Market Risk | Beta 1.17 – Moderate market volatility exposure | Beta 1.25 – Slightly higher market sensitivity |
| Debt level | Debt-to-Equity 0.20 – Low leverage, favorable | Debt-to-Equity 0.38 – Moderate leverage, favorable |
| Regulatory Risk | Moderate – Water infrastructure sector subject to environmental regulations | Moderate – Industrial machinery with compliance requirements |
| Operational Risk | Medium – Diverse product segments, some complexity | Medium – Specialized industrial systems with niche markets |
| Environmental Risk | High – Water treatment and infrastructure subject to environmental scrutiny | Moderate – Industrial processing with some emissions impact |
| Geopolitical Risk | Medium – Global operations with exposure to international markets | Medium – Global sales but smaller footprint than XYL |
Xylem’s most impactful risks stem from environmental regulation and moderate market volatility, while Kadant faces slightly higher market sensitivity and moderate leverage. Both companies operate in sectors with regulatory scrutiny but maintain strong financial stability and low bankruptcy risk as of 2024.
Which Stock to Choose?
Xylem Inc. (XYL) has demonstrated strong income growth, with favorable revenue and net margin increases, supported by mostly favorable financial ratios such as net margin and current ratio. However, its ROE is considered unfavorable and the company shows a slightly unfavorable moat status due to ROIC below WACC despite growing profitability. Its rating is very favorable with moderate scores in key financial metrics.
Kadant Inc. (KAI) exhibits solid income statement metrics with favorable gross and EBIT margins, though recent net margin and EPS growth have been negative. Its financial ratios are largely favorable, especially ROIC and current ratio, and it shows a slightly favorable moat reflecting improving profitability. The company holds a very favorable rating with moderate financial scores.
For investors prioritizing growth potential and consistent income improvement, Xylem’s strong earnings and income growth might appear attractive. Meanwhile, those valuing improving profitability and financial strength with a more favorable moat could view Kadant as a compelling option. The choice might depend on whether an investor prefers a company with accelerating income growth or one with improving capital efficiency.
Disclaimer: Investment carries a risk of loss of initial capital. The past performance is not a reliable indicator of future results. Be sure to understand risks before making an investment decision.
Go Further
I encourage you to read the complete analyses of Xylem Inc. and Kadant Inc. to enhance your investment decisions: