Home > Comparison > Industrials > ROP vs KAI
The strategic rivalry between Roper Technologies, Inc. and Kadant Inc. shapes the industrial machinery sector’s evolution. Roper, a diversified technology and software powerhouse, contrasts with Kadant’s specialized engineered systems focus. This matchup highlights a battle between broad technological integration and niche operational expertise. This analysis aims to identify which corporate path offers superior risk-adjusted returns for a diversified portfolio amid shifting industrial dynamics.
Table of contents
Companies Overview
Roper Technologies and Kadant represent key players in the industrial machinery sector with distinct market footprints and strategic priorities.
Roper Technologies, Inc.: Diversified Industrial Software & Solutions Leader
Roper dominates as a provider of software and engineered products across multiple verticals, including healthcare, finance, and energy. Its core revenue stems from cloud-based software and precision instruments. In the latest cycle, Roper focuses on expanding its cloud analytics and data-driven solutions to deepen customer integration and recurring revenue streams.
Kadant Inc.: Specialist in Industrial Processing Systems
Kadant asserts itself as a supplier of fluid-handling and industrial processing technologies worldwide. Its revenue base relies heavily on engineered systems for packaging, tissue, and wood products industries. The company’s strategic thrust in 2026 emphasizes innovation in flow control and material handling to capture niche market demands and improve operational efficiency.
Strategic Collision: Similarities & Divergences
Both companies operate within industrial machinery but diverge sharply in scope and approach. Roper pursues a broad, software-driven ecosystem, while Kadant focuses on specialized physical equipment and industrial processes. Their primary battleground lies in industrial automation and equipment markets. Roper presents a diversified, software-heavy profile versus Kadant’s concentrated, hardware-centric investment appeal.
Income Statement Comparison
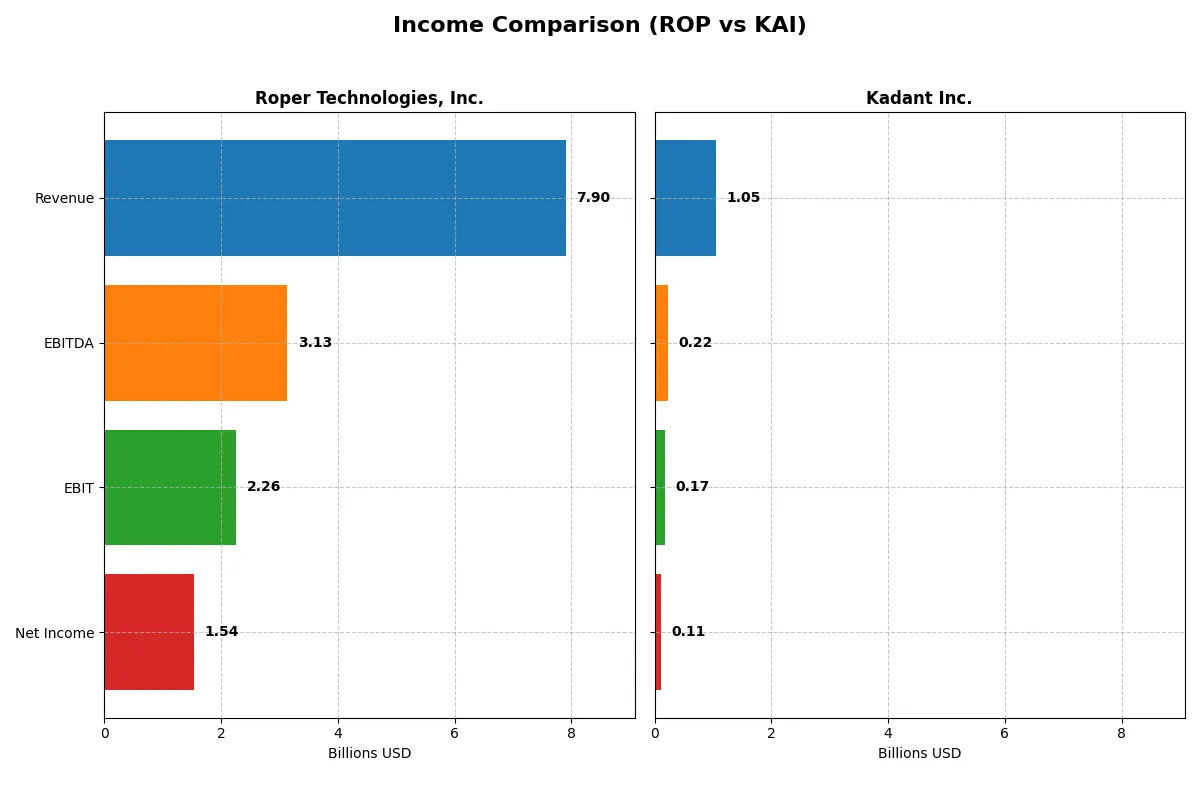
This data dissects the core profitability and scalability of both corporate engines to reveal who dominates the bottom line:
| Metric | Roper Technologies, Inc. (ROP) | Kadant Inc. (KAI) |
|---|---|---|
| Revenue | 7.9B | 1.05B |
| Cost of Revenue | 2.43B | 587M |
| Operating Expenses | 3.24B | 294M |
| Gross Profit | 5.47B | 466M |
| EBITDA | 3.13B | 223M |
| EBIT | 2.26B | 173M |
| Interest Expense | 325M | 20M |
| Net Income | 1.54B | 112M |
| EPS | 14.31 | 9.51 |
| Fiscal Year | 2025 | 2024 |
Income Statement Analysis: The Bottom-Line Duel
This income statement comparison reveals how effectively Roper Technologies and Kadant convert sales into profit and sustain growth momentum.
Roper Technologies, Inc. Analysis
Roper’s revenue climbed from $4.8B in 2021 to $7.9B in 2025, showing robust expansion. Net income also rose, reaching $1.54B in 2024 before a slight dip to $1.54B in 2025. Gross margins remain strong near 69%, while net margins hold at a healthy 19%, reflecting solid operational efficiency despite rising expenses.
Kadant Inc. Analysis
Kadant’s revenue grew steadily from $635M in 2020 to $1.05B in 2024. Net income doubled over the period, hitting $112M in 2024. Kadant’s gross margin sits at 44%, with net margin at 10.6%, showing moderate profitability. The company’s disciplined cost control supports a modest EBIT margin of 16%, sustaining positive momentum despite a slight net margin contraction last year.
Margin Strength vs. Growth Scale
Roper outperforms Kadant in margin strength, boasting superior gross and net profitability, essential for cushioning economic cycles. Kadant, however, delivers faster net income growth and a higher percentage rise in earnings per share. Investors seeking margin resilience may favor Roper, while those prioritizing growth potential might lean toward Kadant’s accelerating trajectory.
Financial Ratios Comparison
These vital ratios act as a diagnostic tool to expose the underlying fiscal health, valuation premiums, and capital efficiency of the companies compared below:
| Ratios | Roper Technologies, Inc. (ROP) | Kadant Inc. (KAI) |
|---|---|---|
| ROE | 8.2% | 13.2% |
| ROIC | 5.5% | 10.1% |
| P/E | 31.1 | 36.9 |
| P/B | 2.95 | 4.86 |
| Current Ratio | 0.40 | 2.31 |
| Quick Ratio | 0.37 | 1.55 |
| D/E | 0.41 | 0.38 |
| Debt-to-Assets | 24.5% | 22.6% |
| Interest Coverage | 7.7x | 8.6x |
| Asset Turnover | 0.22 | 0.74 |
| Fixed Asset Turnover | 47.0 | 6.18 |
| Payout ratio | 20.8% | 13.1% |
| Dividend yield | 0.58% | 0.36% |
| Fiscal Year | 2024 | 2024 |
Efficiency & Valuation Duel: The Vital Signs
Financial ratios serve as a company’s DNA, unveiling hidden risks and operational strengths crucial for sound investment decisions.
Roper Technologies, Inc.
Roper shows a strong net margin at 19.44%, signaling solid profitability. However, its 31.06 P/E ratio appears stretched compared to sector norms. The company’s low dividend yield of 0.74% suggests limited shareholder payouts, likely prioritizing reinvestment in R&D with a 10.6% revenue allocation, aiming for long-term growth.
Kadant Inc.
Kadant posts a moderate net margin of 10.59% but delivers a healthier 13.17% ROE and 10.08% ROIC, reflecting efficient capital use. Its P/E of 36.9 signals an expensive valuation, while a 0.36% dividend yield indicates modest shareholder returns. Kadant maintains strong liquidity (current ratio 2.31), supporting operational flexibility.
Valuation Stretch vs. Operational Efficiency
Kadant balances operational efficiency with a premium valuation, while Roper offers higher profitability but a stretched price multiple and weaker ROE. Kadant’s liquidity and capital returns suit investors favoring stability and growth. Roper fits those willing to tolerate valuation risk for margin strength.
Which one offers the Superior Shareholder Reward?
I see Roper Technologies (ROP) pays a 0.74% dividend yield with a 23% payout ratio, supported by strong free cash flow coverage near 100%. It also executes moderate buybacks, boosting total returns. Kadant (KAI) yields less at 0.36%, with a lighter 13% payout ratio, retaining more for growth and acquisitions. KAI’s buyback activity is less intense but free cash flow coverage remains solid above 85%. ROP’s distribution balances dividends and buybacks sustainably, while KAI prioritizes reinvestment. For 2026, I favor Roper for a superior total shareholder return profile, blending income and capital return more effectively.
Comparative Score Analysis: The Strategic Profile
The radar chart reveals the fundamental DNA and trade-offs of Roper Technologies, Inc. and Kadant Inc., highlighting their core financial strengths and vulnerabilities:
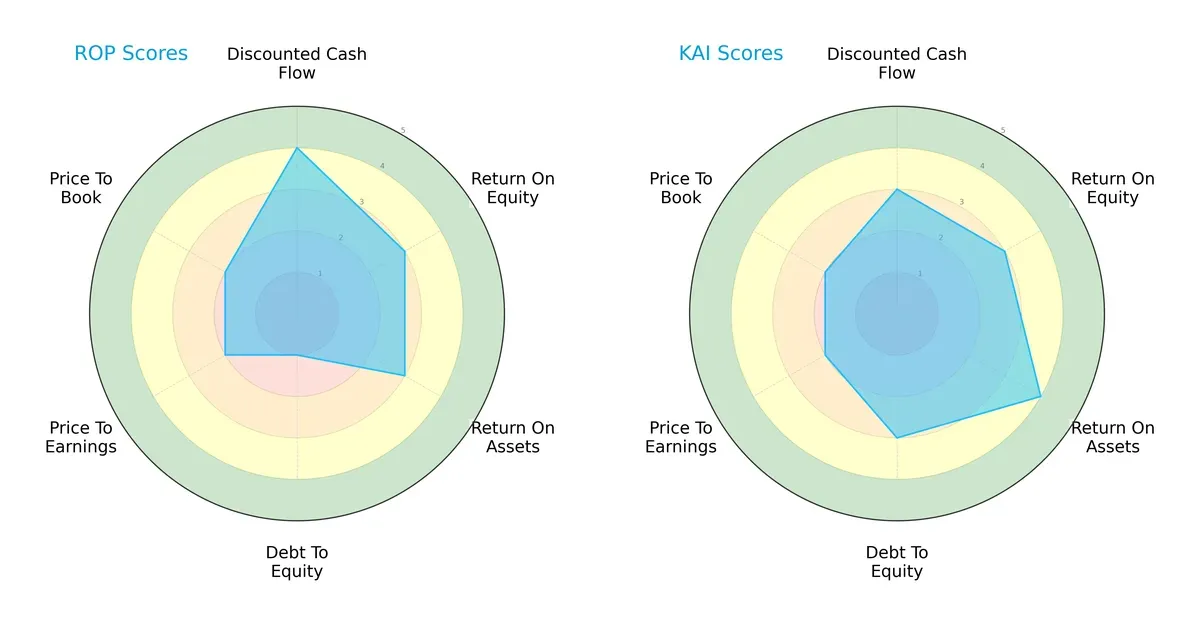
Roper excels in discounted cash flow with a score of 4 but suffers from a very unfavorable debt-to-equity score of 1. Kadant presents a more balanced profile, with solid return on assets at 4 and moderate debt management at 3. Roper relies heavily on cash flow strength, while Kadant manages risk and asset utilization more evenly.
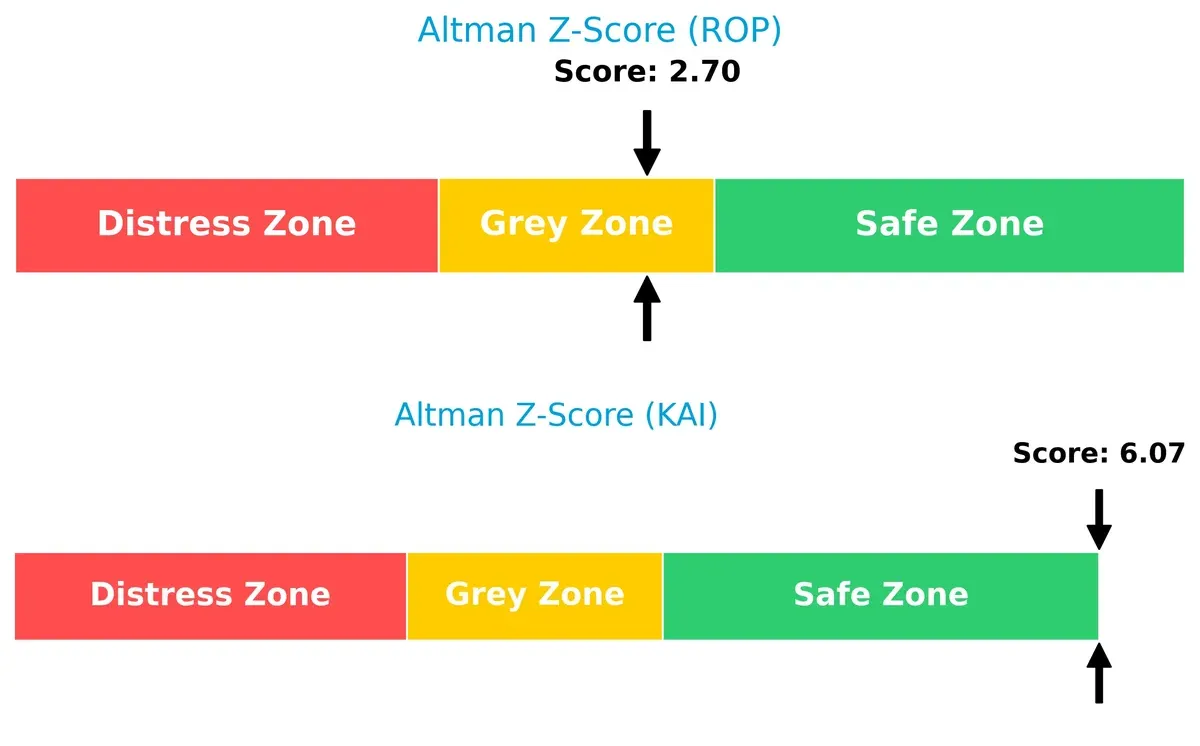
Bankruptcy Risk: Solvency Showdown
Kadant’s Altman Z-Score of 6.07 places it safely above distress, signaling strong long-term survival prospects. Roper’s 2.70 lands in the grey zone, indicating moderate bankruptcy risk during economic downturns:
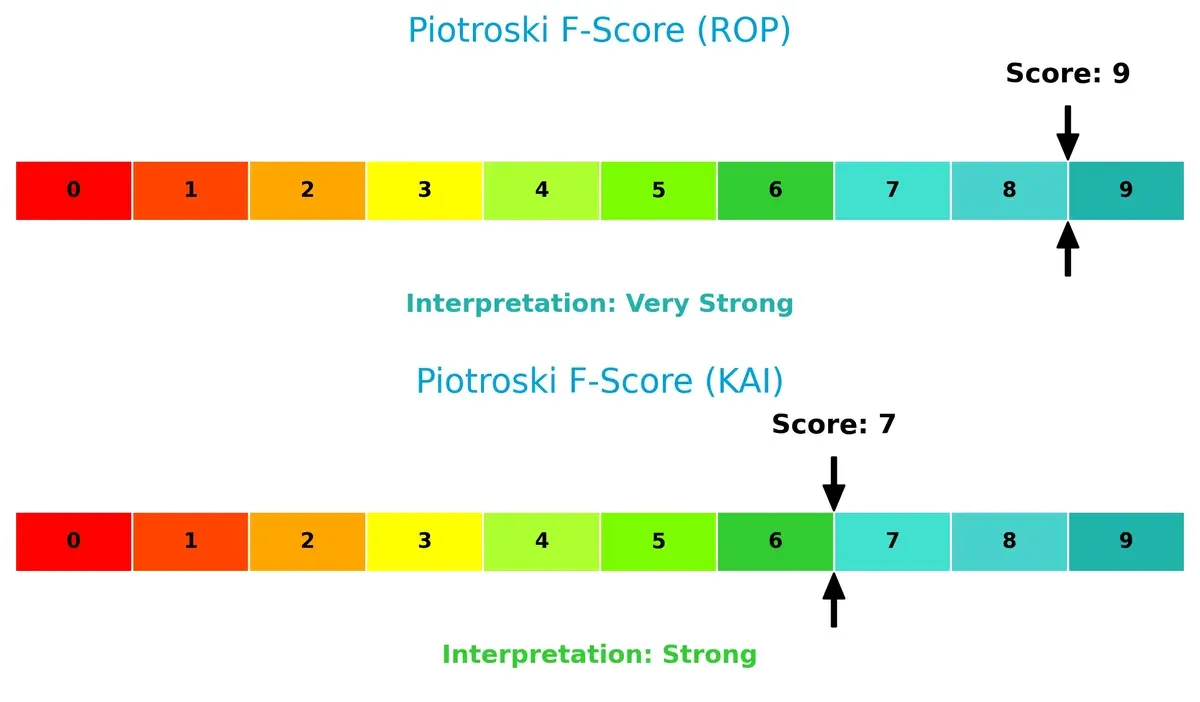
Financial Health: Quality of Operations
Roper’s Piotroski F-Score of 9 signals peak financial health, reflecting robust operations and internal controls. Kadant’s score of 7 is strong but suggests minor red flags compared to Roper’s near-perfect rating:
How are the two companies positioned?
This section dissects ROP and KAI’s operational DNA by comparing revenue distribution and internal dynamics. The objective is to confront their economic moats and identify which model offers the most resilient, sustainable advantage today.
Revenue Segmentation: The Strategic Mix
This comparison dissects how Roper Technologies and Kadant diversify income streams and where their primary sector bets lie:
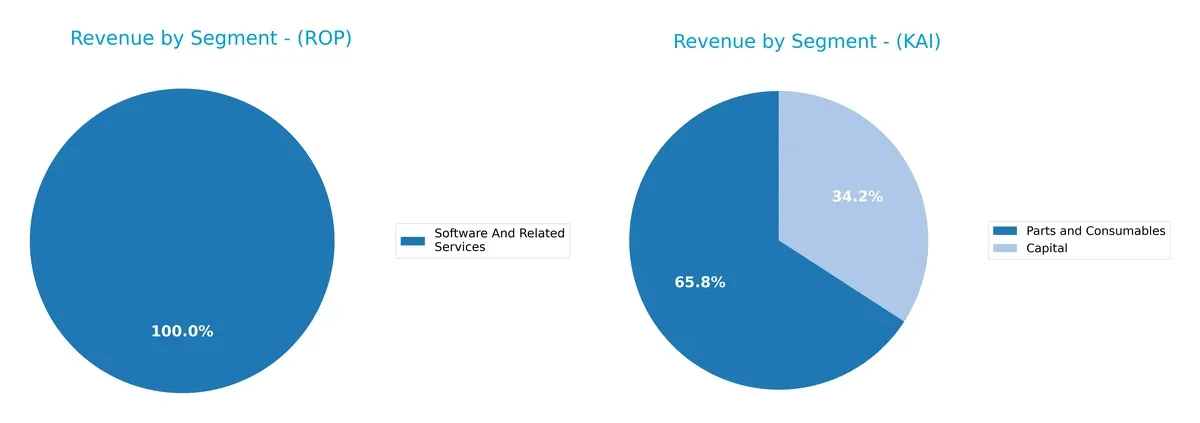
Roper Technologies anchors its revenue in the Software and Related Services segment with $10.7B in 2024, overshadowing smaller, fragmented units. Meanwhile, Kadant shows a more balanced mix between Parts and Consumables ($694M) and Capital ($360M). Roper’s concentration signals strong ecosystem lock-in but heightens sector risk. Kadant’s diversified base suggests resilience through product variety, mitigating volatility in any single segment.
Strengths and Weaknesses Comparison
This table compares the strengths and weaknesses of Roper Technologies and Kadant Inc. based on diversification, profitability, financials, innovation, global presence, and market share:
Roper Technologies Strengths
- Highly diversified product segments with strong software revenue
- Favorable net margin of 19.44%
- Low debt to assets and good interest coverage of 6.96x
- Large US market presence with over $6B revenue
- Consistent innovation in technology-enabled products
Kadant Inc. Strengths
- Favorable net margin of 10.59% and ROIC above WACC at 10.08%
- Strong liquidity ratios (current 2.31, quick 1.55)
- Moderate debt levels with favorable debt-to-assets of 22.57%
- Global footprint with significant North American and European sales
- High fixed asset turnover indicating efficient capital use
Roper Technologies Weaknesses
- Unfavorable ROE and ROIC metrics
- Unavailable WACC data limits capital efficiency assessment
- Unfavorable liquidity ratios raise short-term risk concerns
- High P/E of 31.06 suggests premium valuation
- Low asset turnover may reflect underutilized assets
- Low dividend yield at 0.74%
Kadant Inc. Weaknesses
- High P/E of 36.9 and elevated PB ratio at 4.86 imply valuation risk
- Dividend yield low at 0.36%
- Neutral asset turnover at 0.74 may constrain growth
- ROE neutral at 13.17% limits return on equity upside
Roper shows strength in product diversification and profitability but faces challenges in capital efficiency and liquidity. Kadant demonstrates solid financial health and capital use but contends with valuation and moderate returns. Each company’s profile highlights different strategic priorities in managing growth and risk.
The Moat Duel: Analyzing Competitive Defensibility
A structural moat shields long-term profits from relentless competitive pressure. It’s the true barrier between growth and decline:
Roper Technologies, Inc.: Intangible Assets and Diversification Moat
Roper’s moat stems from its diverse software and engineered products portfolio, delivering stable margins near 28%. Its broad industrial reach supports resilience, yet declining ROIC warns of potential margin pressure in 2026.
Kadant Inc.: Operational Efficiency and Focused Industrial Niche
Kadant’s moat relies on specialized flow control and material handling tech, driving a rising ROIC trend despite a modest margin of 16%. This growing profitability hints at expanding competitive strength and market penetration ahead.
Moat Strength Battle: Diversification vs. Operational Focus
Roper’s broad segment diversification creates a wide moat but faces headwinds from declining capital returns. Kadant’s narrower yet improving moat suggests deeper competitive gains. Kadant appears better positioned to defend and grow market share in 2026.
Which stock offers better returns?
The past year shows a sharp decline for Roper Technologies and a nearly flat trend for Kadant Inc., with recent trading dynamics diverging notably between the two.
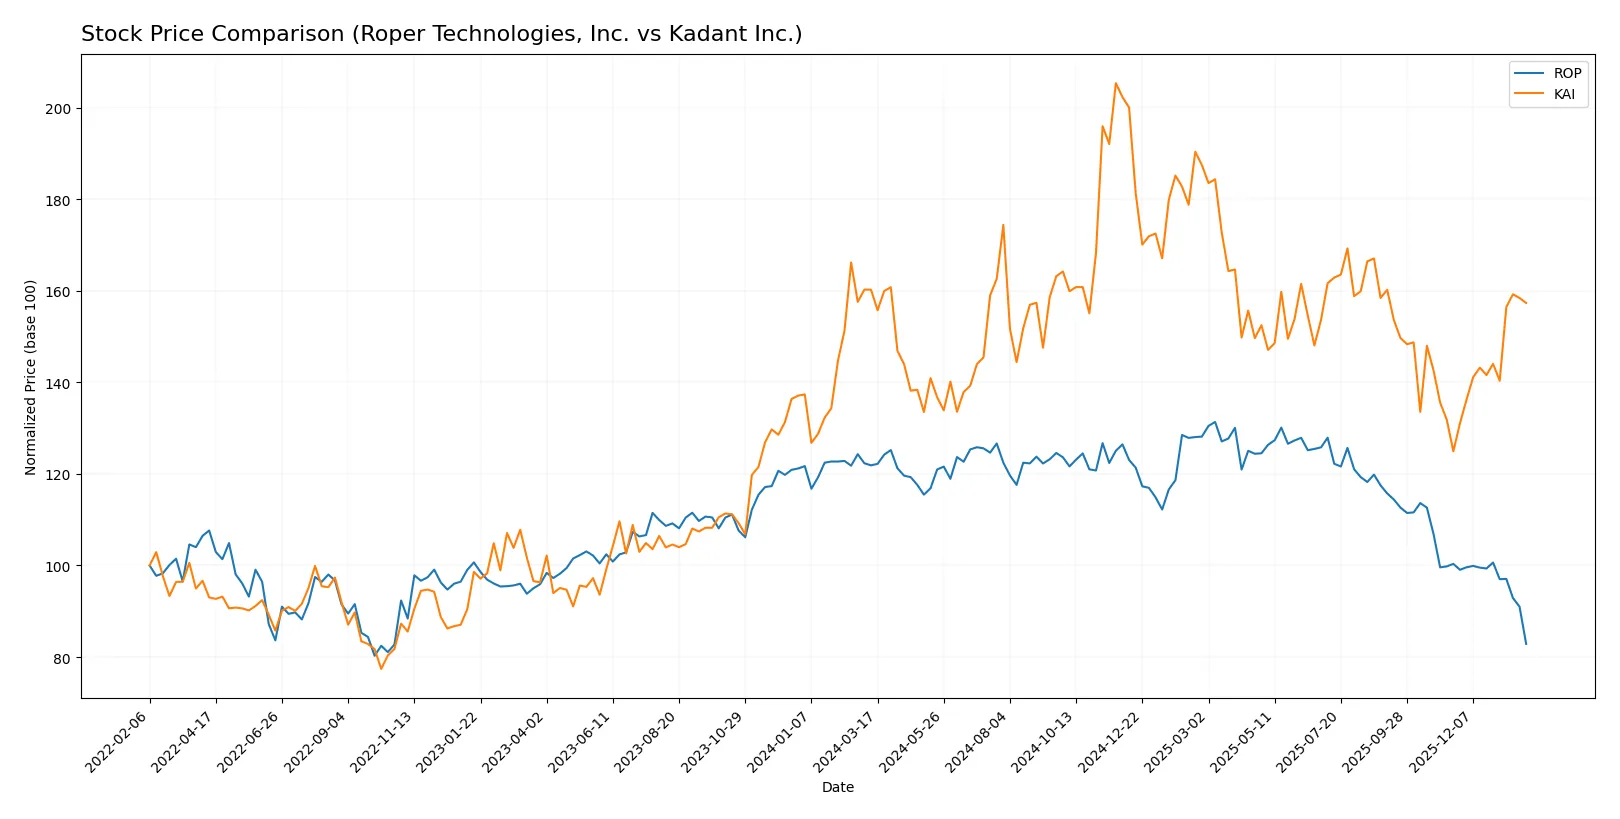
Trend Comparison
Roper Technologies, Inc. fell 32.0% over the past 12 months, marking a bearish trend with decelerating losses. The stock ranged from a high of 588.38 to a low of 371.23, reflecting significant volatility.
Kadant Inc. declined 1.82% over the year—a bearish but nearly neutral trend. Recent acceleration lifted the price 25.94% from November 2025 to February 2026, showing buyer dominance amid increased volume.
Kadant outperformed Roper over the full year, delivering higher relative market returns and recent bullish momentum compared to Roper’s sustained decline.
Target Prices
Analysts present a solid target consensus for Roper Technologies and Kadant, reflecting confident growth expectations.
| Company | Target Low | Target High | Consensus |
|---|---|---|---|
| Roper Technologies, Inc. | 365 | 575 | 475.5 |
| Kadant Inc. | 275 | 410 | 342.5 |
Roper’s consensus target of 475.5 implies roughly 28% upside versus the current 371.23 price. Kadant’s 342.5 target suggests a moderate 7% potential gain from 321.04.

Don’t Let Luck Decide Your Entry Point
Optimize your entry points with our advanced ProRealTime indicators. You’ll get efficient buy signals with precise price targets for maximum performance. Start outperforming now!
How do institutions grade them?
Here is a comparison of recent institutional grades for Roper Technologies, Inc. and Kadant Inc.:
Roper Technologies, Inc. Grades
This table summarizes the latest rating actions from major grading companies for Roper Technologies, Inc.
| Grading Company | Action | New Grade | Date |
|---|---|---|---|
| Goldman Sachs | Maintain | Neutral | 2026-01-29 |
| Argus Research | Downgrade | Hold | 2026-01-28 |
| Mizuho | Maintain | Underperform | 2026-01-28 |
| RBC Capital | Maintain | Sector Perform | 2026-01-28 |
| Stifel | Downgrade | Hold | 2026-01-28 |
| Citigroup | Maintain | Buy | 2026-01-28 |
| JP Morgan | Maintain | Underweight | 2026-01-28 |
| Truist Securities | Maintain | Buy | 2026-01-28 |
| Barclays | Maintain | Underweight | 2026-01-28 |
| Oppenheimer | Downgrade | Perform | 2026-01-28 |
Kadant Inc. Grades
Below is a summary of consistent ratings from Barrington Research and DA Davidson for Kadant Inc.
| Grading Company | Action | New Grade | Date |
|---|---|---|---|
| Barrington Research | Maintain | Outperform | 2025-10-30 |
| Barrington Research | Maintain | Outperform | 2025-10-29 |
| Barrington Research | Maintain | Outperform | 2025-10-27 |
| Barrington Research | Maintain | Outperform | 2025-10-10 |
| Barrington Research | Maintain | Outperform | 2025-09-23 |
| DA Davidson | Maintain | Neutral | 2025-08-04 |
| Barrington Research | Maintain | Outperform | 2025-07-30 |
| Barrington Research | Maintain | Outperform | 2025-07-29 |
| Barrington Research | Maintain | Outperform | 2025-05-01 |
| DA Davidson | Maintain | Neutral | 2025-05-01 |
Which company has the best grades?
Kadant Inc. consistently earns “Outperform” ratings from Barrington Research. Roper Technologies faces mixed reviews, including downgrades and neutral stances. Kadant’s stronger grades may signal higher institutional confidence, influencing investor sentiment positively.
Risks specific to each company
The following categories identify the critical pressure points and systemic threats facing both firms in the 2026 market environment:
1. Market & Competition
Roper Technologies, Inc.
- Operates in diverse industrial software and engineered products, facing intense tech and industrial competition.
Kadant Inc.
- Focuses on niche engineered systems with moderate competition but less diversification risk.
2. Capital Structure & Debt
Roper Technologies, Inc.
- Shows favorable debt ratios and interest coverage but has unfavorable liquidity ratios, posing short-term risk.
Kadant Inc.
- Maintains a healthier liquidity position and moderate debt, supporting stable capital structure.
3. Stock Volatility
Roper Technologies, Inc.
- Exhibits lower beta (0.93), indicating less stock volatility versus the market.
Kadant Inc.
- Higher beta (1.23) signals greater stock price swings and market sensitivity.
4. Regulatory & Legal
Roper Technologies, Inc.
- Faces regulatory complexities due to broad software and healthcare segments exposure.
Kadant Inc.
- Regulatory risk is moderate, focused mainly on industrial and environmental standards.
5. Supply Chain & Operations
Roper Technologies, Inc.
- Complex supply chain with global operations may be vulnerable to disruptions.
Kadant Inc.
- Smaller scale and focused product lines reduce supply chain complexity and risk.
6. ESG & Climate Transition
Roper Technologies, Inc.
- Pressure to adapt software and industrial products to ESG standards; transition risks rising.
Kadant Inc.
- Faces rising ESG compliance costs in manufacturing and material handling sectors.
7. Geopolitical Exposure
Roper Technologies, Inc.
- Global operations expose it to trade tensions and geopolitical uncertainty.
Kadant Inc.
- Primarily US-based with less direct exposure to geopolitical risks.
Which company shows a better risk-adjusted profile?
Kadant’s moderate debt, strong liquidity, and safe Altman Z-Score indicate a more resilient financial profile. Roper’s diversified operations carry higher market and operational complexity, with liquidity red flags. Kadant’s stable capital structure and lower bankruptcy risk justify a better risk-adjusted stance despite higher stock volatility.
Final Verdict: Which stock to choose?
Roper Technologies, Inc. (ROP) excels as a cash-generating machine with a robust gross margin and consistent revenue growth. Its superpower lies in operational efficiency and strong income quality. However, its liquidity position is a point of vigilance, reflecting potential short-term constraints. ROP suits portfolios focused on aggressive growth and capital appreciation.
Kadant Inc. (KAI) offers a strategic moat rooted in improving profitability and a steadily growing return on invested capital. It benefits from superior balance sheet strength and liquidity compared to ROP, providing better stability. KAI fits well within Growth at a Reasonable Price (GARP) portfolios seeking a blend of growth and financial prudence.
If you prioritize aggressive growth and operational cash flow strength, ROP is compelling due to its efficiency and income quality despite liquidity risks. However, if you seek a more balanced profile with improving profitability and financial stability, KAI offers better stability and a growing competitive edge. Both present analytical scenarios aligned with distinct investor profiles.
Disclaimer: Investment carries a risk of loss of initial capital. The past performance is not a reliable indicator of future results. Be sure to understand risks before making an investment decision.
Go Further
I encourage you to read the complete analyses of Roper Technologies, Inc. and Kadant Inc. to enhance your investment decisions: