In the competitive industrial machinery sector, Pentair plc (PNR) and Kadant Inc. (KAI) stand out as key players with overlapping markets in fluid handling and process technologies. Both companies emphasize innovation in water solutions and industrial processing systems, targeting diverse global industries. This article will analyze their strategies, financial health, and growth potential to help you identify which company could be the most compelling addition to your investment portfolio.
Table of contents
Companies Overview
I will begin the comparison between Pentair plc and Kadant Inc. by providing an overview of these two companies and their main differences.
Pentair plc Overview
Pentair plc focuses on water solutions worldwide, operating through Consumer Solutions and Industrial & Flow Technologies segments. It designs and sells pool equipment, water treatment products, and fluid treatment systems for residential, commercial, and industrial applications. Pentair holds a strong market position with a 17B market cap and a broad product portfolio under multiple brand names, serving diverse water filtration and fluid management needs globally.
Kadant Inc. Overview
Kadant Inc. supplies engineered systems and technologies globally, divided into Flow Control, Industrial Processing, and Material Handling segments. It offers fluid-handling equipment, debarkers, recycling systems, and biodegradable absorbents for industries like packaging, wood products, and agriculture. With a market cap of 3.8B, Kadant is a specialized industrial machinery provider headquartered in the US, focusing on niche process equipment and materials handling solutions.
Key similarities and differences
Both companies operate in the industrial machinery sector and serve global markets with engineered solutions involving fluid handling and processing technologies. Pentair has a larger scale and a broader focus on water solutions, while Kadant targets specialized industrial processing and material handling applications. Pentair’s product range spans consumer and industrial markets, whereas Kadant concentrates on industrial automation and environmental solutions, reflecting distinct business models despite sector overlap.
Income Statement Comparison
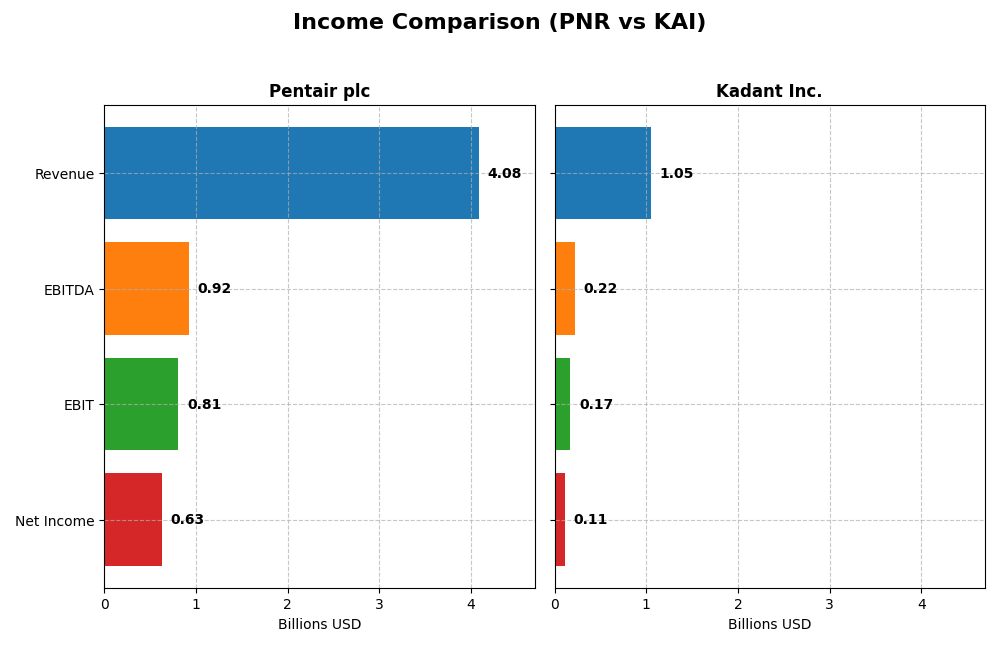
This table compares the key income statement metrics for Pentair plc and Kadant Inc. for the fiscal year 2024, providing a snapshot of their financial performance.
| Metric | Pentair plc (PNR) | Kadant Inc. (KAI) |
|---|---|---|
| Market Cap | 16.9B | 3.8B |
| Revenue | 4.08B | 1.05B |
| EBITDA | 922M | 223M |
| EBIT | 808M | 173M |
| Net Income | 625M | 112M |
| EPS | 3.78 | 9.51 |
| Fiscal Year | 2024 | 2024 |
Income Statement Interpretations
Pentair plc
Pentair plc showed a 35.3% revenue increase and a 74.4% net income rise from 2020 to 2024, with mostly stable and favorable margins. Gross margin improved to 39.16% in 2024, alongside an EBIT margin of 19.78%. Although revenue slightly declined by 0.53% in the last year, net income and EBIT grew, reflecting margin improvements and cost control.
Kadant Inc.
Kadant Inc. experienced a 65.9% revenue growth and a 102.2% net income increase over the 2020-2024 period, maintaining strong margins with a 44.25% gross margin and 16.43% EBIT margin in 2024. The latest year saw a 10% revenue rise but a 12.6% net margin decline, indicating rising operating expenses that tempered net income growth despite solid top-line expansion.
Which one has the stronger fundamentals?
Both companies exhibit favorable overall income statement evaluations with strong revenue and net income growth. Pentair maintains higher EBIT and net margins with slight recent revenue softness, while Kadant shows stronger revenue growth but faces margin pressure from increased expenses. Each has balanced strengths, reflecting solid fundamentals but with differing short-term margin dynamics.
Financial Ratios Comparison
Below is a comparison of key financial ratios for Pentair plc (PNR) and Kadant Inc. (KAI) based on their most recent fiscal year data of 2024.
| Ratios | Pentair plc (PNR) | Kadant Inc. (KAI) |
|---|---|---|
| ROE | 17.6% | 13.2% |
| ROIC | 12.5% | 10.1% |
| P/E | 26.9 | 36.9 |
| P/B | 4.72 | 4.86 |
| Current Ratio | 1.60 | 2.31 |
| Quick Ratio | 0.92 | 1.55 |
| D/E (Debt-to-Equity) | 0.50 | 0.38 |
| Debt-to-Assets | 27.4% | 22.6% |
| Interest Coverage | 9.07 | 8.55 |
| Asset Turnover | 0.63 | 0.74 |
| Fixed Asset Turnover | 8.60 | 6.18 |
| Payout Ratio | 24.4% | 13.1% |
| Dividend Yield | 0.91% | 0.36% |
Interpretation of the Ratios
Pentair plc
Pentair shows strong profitability with favorable net margin (15.32%), ROE (17.55%), and ROIC (12.52%), supported by a solid current ratio (1.6) and manageable debt levels. However, valuation ratios like PE (26.89) and PB (4.72) appear stretched, and dividend yield at 0.91% is low. The company pays dividends with a cautious payout, but yield remains modest relative to valuation.
Kadant Inc.
Kadant posts favorable net margin (10.59%) and ROIC (10.08%), while ROE is neutral at 13.17%. Liquidity is strong with current and quick ratios above 1.5, and leverage is conservative. Valuation remains elevated with a PE of 36.9 and PB of 4.86. Dividend yield is low at 0.36%, reflecting a modest return despite steady dividend payments.
Which one has the best ratios?
Both companies hold a favorable overall ratio profile with 57.14% favorable metrics each. Pentair excels in return on equity and fixed asset turnover, while Kadant offers stronger liquidity ratios. Both face valuation pressures and low dividend yields. The choice depends on prioritizing profitability or liquidity, as neither distinctly outperforms across all key financial ratios.
Strategic Positioning
This section compares the strategic positioning of Pentair plc and Kadant Inc., focusing on market position, key segments, and exposure to technological disruption:
Pentair plc
- Large market cap of 16.9B USD with broad industrial machinery presence; faces competitive pressure in water solutions and flow technologies.
- Diversified segments including Consumer Solutions and Industrial & Flow Technologies, driven by water treatment, pool equipment, and fluid transfer products.
- Exposure to technological disruption primarily in advanced filtration and fluid treatment technologies within water and industrial systems.
Kadant Inc.
- Smaller market cap of 3.8B USD; competes in industrial machinery with focus on fluid-handling and material handling systems.
- Operates in three segments: Flow Control, Industrial Processing, and Material Handling; key drivers include steam systems and recycling equipment.
- Faces disruption risk in automation, filtration, and engineered systems in paper, packaging, and material handling industries.
Pentair plc vs Kadant Inc. Positioning
Pentair adopts a diversified approach spanning consumer and industrial water solutions, providing scale advantages but broader operational complexity. Kadant focuses on specialized industrial systems with narrower segment concentration, potentially enabling targeted innovation but limited diversification.
Which has the best competitive advantage?
Pentair demonstrates a very favorable moat with ROIC exceeding WACC by 3.5% and growing profitability, indicating a durable competitive advantage. Kadant shows a slightly favorable moat, with ROIC close to WACC but improving, suggesting emerging but unconfirmed competitive strength.
Stock Comparison
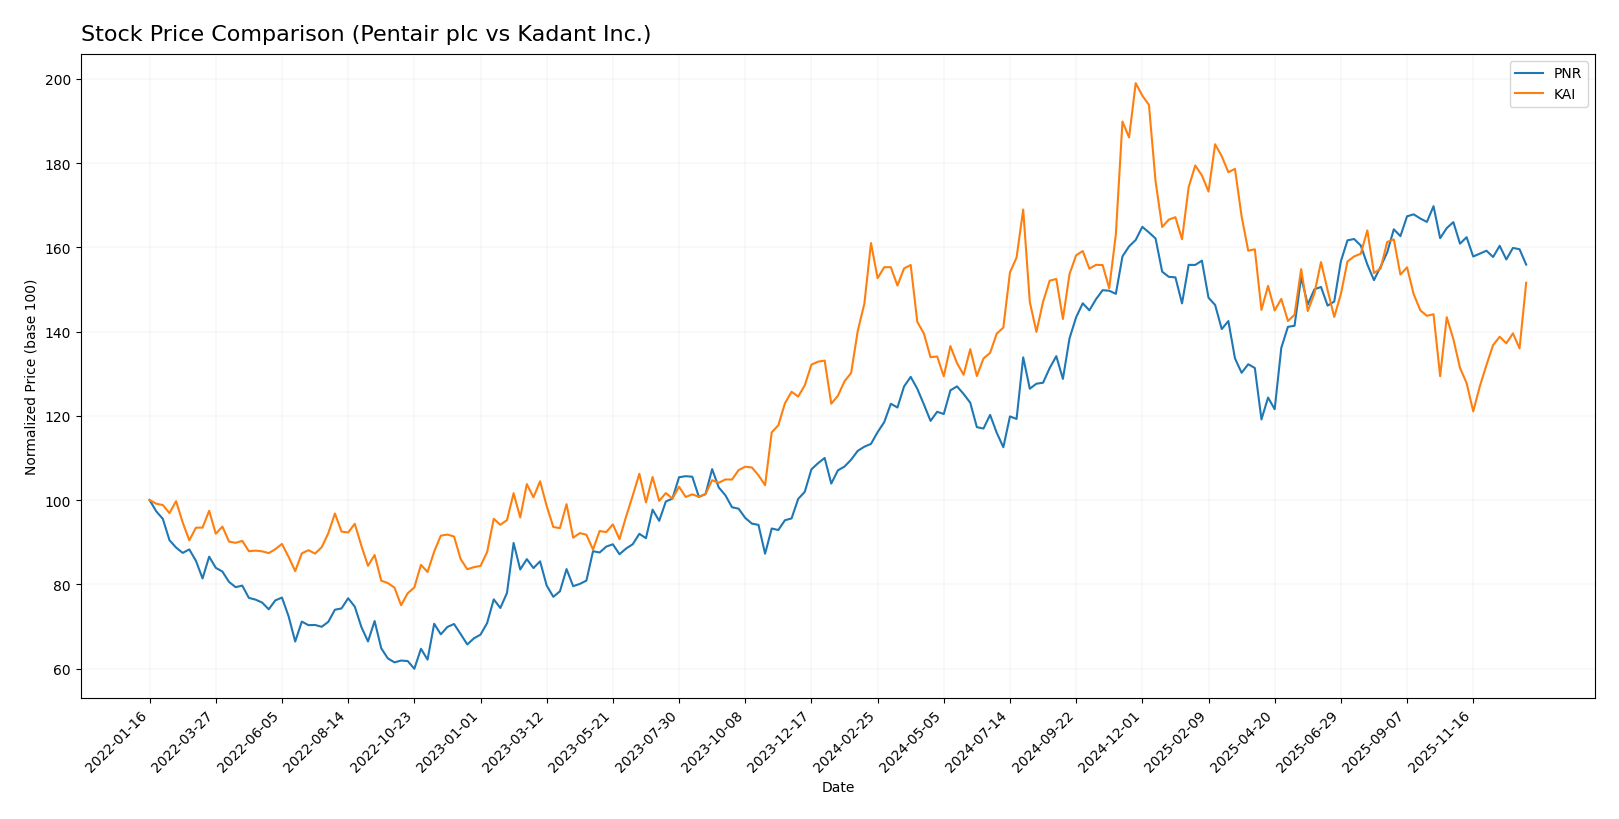
The stock price chart highlights significant price movements and contrasting trading dynamics for Pentair plc and Kadant Inc. over the past 12 months, with Pentair showing a strong bullish trend and Kadant experiencing bearish pressure.
Trend Analysis
Pentair plc’s stock demonstrated a bullish trend with a 37.56% increase over the past year, despite deceleration in momentum and a recent short-term decline of -6.08%. Volatility is moderate with an 11.1 std deviation.
Kadant Inc.’s stock showed a bearish trend over the last 12 months, falling by -5.86%, but with accelerating downward momentum. Recent data indicates a short-term recovery of +9.69% amid high volatility (34.44 std deviation).
Comparing both, Pentair plc delivered the highest market performance over the last year, outperforming Kadant Inc. which faced an overall decline despite recent gains.
Target Prices
The current target price consensus shows promising upside potential for both Pentair plc and Kadant Inc.
| Company | Target High | Target Low | Consensus |
|---|---|---|---|
| Pentair plc | 135 | 90 | 122.63 |
| Kadant Inc. | 410 | 275 | 342.5 |
Analysts expect Pentair’s stock to rise from $103.06 to around $122.63, indicating moderate upside. Kadant’s consensus target at $342.5 suggests a significant potential increase from its current price of $319.22.
Analyst Opinions Comparison
This section compares analysts’ ratings and grades for Pentair plc and Kadant Inc.:
Rating Comparison
Pentair plc Rating
- Rating: B, classified as very favorable by analysts.
- Discounted Cash Flow Score: 3, indicating moderate value.
- ROE Score: 4, a favorable indicator of profit efficiency.
- ROA Score: 5, very favorable asset utilization.
- Debt To Equity Score: 2, moderate financial risk.
- Overall Score: 3, moderate overall financial standing.
Kadant Inc. Rating
- Rating: B, also classified as very favorable.
- Discounted Cash Flow Score: 3, indicating moderate value.
- ROE Score: 3, showing moderate profit efficiency.
- ROA Score: 4, favorable asset utilization.
- Debt To Equity Score: 3, moderate financial risk.
- Overall Score: 3, moderate overall financial standing.
Which one is the best rated?
Both companies share the same overall rating of B with moderate overall scores. Pentair outperforms Kadant in ROE and ROA scores, while Kadant has a slightly better debt to equity score. Overall, their ratings are comparable based on the provided data.
Scores Comparison
Here is a comparison of the Altman Z-Score and Piotroski Score for Pentair plc and Kadant Inc.:
Pentair plc Scores
- Altman Z-Score: 5.05, indicating a safe zone, low bankruptcy risk.
- Piotroski Score: 8, classified as very strong financial health.
Kadant Inc. Scores
- Altman Z-Score: 5.59, indicating a safe zone, low bankruptcy risk.
- Piotroski Score: 7, classified as strong financial health.
Which company has the best scores?
Kadant Inc. has a slightly higher Altman Z-Score, indicating marginally lower bankruptcy risk, while Pentair plc has a higher Piotroski Score, reflecting stronger financial health. Both companies show solid scores within their respective categories.
Grades Comparison
The grades comparison for Pentair plc and Kadant Inc. from verified grading companies is as follows:
Pentair plc Grades
This table presents recent grades assigned to Pentair plc by recognized grading companies.
| Grading Company | Action | New Grade | Date |
|---|---|---|---|
| BNP Paribas Exane | Downgrade | Underperform | 2026-01-07 |
| TD Cowen | Downgrade | Sell | 2026-01-05 |
| Jefferies | Upgrade | Buy | 2025-12-10 |
| Barclays | Downgrade | Equal Weight | 2025-12-04 |
| Oppenheimer | Maintain | Outperform | 2025-11-20 |
| UBS | Maintain | Buy | 2025-10-22 |
| RBC Capital | Maintain | Outperform | 2025-10-22 |
| Barclays | Maintain | Overweight | 2025-10-22 |
| Oppenheimer | Maintain | Outperform | 2025-10-20 |
| JP Morgan | Maintain | Overweight | 2025-10-15 |
Pentair shows mixed grade movements with recent downgrades but also consistent maintain ratings at buy and outperform levels.
Kadant Inc. Grades
This table displays recent stable grades awarded to Kadant Inc. by credible grading firms.
| Grading Company | Action | New Grade | Date |
|---|---|---|---|
| Barrington Research | Maintain | Outperform | 2025-10-30 |
| Barrington Research | Maintain | Outperform | 2025-10-29 |
| Barrington Research | Maintain | Outperform | 2025-10-27 |
| Barrington Research | Maintain | Outperform | 2025-10-10 |
| Barrington Research | Maintain | Outperform | 2025-09-23 |
| DA Davidson | Maintain | Neutral | 2025-08-04 |
| Barrington Research | Maintain | Outperform | 2025-07-30 |
| Barrington Research | Maintain | Outperform | 2025-07-29 |
| Barrington Research | Maintain | Outperform | 2025-05-01 |
| DA Davidson | Maintain | Neutral | 2025-05-01 |
Kadant’s grades remain consistently positive, predominantly maintaining outperform ratings with some neutral assessments.
Which company has the best grades?
Kadant Inc. has received more consistently positive and stable grades, mainly outperform, compared to Pentair plc’s mixed recent downgrades and hold ratings. This may indicate a clearer positive market sentiment towards Kadant, potentially influencing investor confidence differently.
Strengths and Weaknesses
Below is a comparison of key strengths and weaknesses between Pentair plc (PNR) and Kadant Inc. (KAI), based on their latest financial and operational data.
| Criterion | Pentair plc (PNR) | Kadant Inc. (KAI) |
|---|---|---|
| Diversification | Strong diversification with Industrial & Flow Technologies, Pool, and Water Unit segments generating over $1B each in revenue. | Moderate diversification mainly between Capital and Parts & Consumables segments, smaller scale overall. |
| Profitability | Higher profitability with 15.32% net margin, 17.55% ROE, and 12.52% ROIC, indicating efficient capital use. | Lower net margin at 10.59%, ROE neutral at 13.17%, but favorable ROIC of 10.08%, showing improving efficiency. |
| Innovation | Demonstrates durable competitive advantage and growing ROIC, signaling sustained innovation and value creation. | Growing ROIC trend but still shedding value overall; innovation likely improving but not yet fully reflected in profitability. |
| Global presence | Large global footprint with diverse industrial and water solutions markets. | More niche market presence focused on papermaking and fiber-based products, with less global scale. |
| Market Share | Larger market share in water and industrial flow segments, supported by consistent revenue growth. | Smaller market share, focused on papermaking systems and consumables, with moderate revenue size. |
Pentair shows a very favorable competitive position with strong profitability and diversification, supporting long-term value creation. Kadant is improving its profitability and innovation but remains less diversified and smaller in scale, indicating higher risk but potential upside as efficiency grows.
Risk Analysis
Below is a comparative table outlining key risks for Pentair plc (PNR) and Kadant Inc. (KAI) based on the most recent available data for 2024-2026.
| Metric | Pentair plc (PNR) | Kadant Inc. (KAI) |
|---|---|---|
| Market Risk | Beta 1.214; exposed to industrial machinery cyclical demand fluctuations | Beta 1.245; similarly cyclical with industrial machinery exposure |
| Debt level | Debt-to-assets 27.41%, debt/equity 0.5; moderate, manageable leverage | Debt-to-assets 22.57%, debt/equity 0.38; lower leverage, stronger balance sheet |
| Regulatory Risk | Moderate; global water treatment regulations, environmental compliance | Moderate; industrial and environmental regulations, particularly in processing sectors |
| Operational Risk | Diverse product lines mitigate some risks; supply chain disruptions possible | Specialized segments; operational efficiency critical, potential automation risks |
| Environmental Risk | Exposure to water treatment and filtration industries; evolving compliance standards | Risks related to manufacturing and material handling; focus on sustainability growing |
| Geopolitical Risk | UK headquartered, global operations; sensitive to trade policies | US headquartered, global sales; sensitive to tariffs and supply chain geopolitics |
Pentair faces moderate market and regulatory risks due to its broad water solutions portfolio amid tightening environmental standards. Kadant’s lower debt and strong operational focus reduce financial risk, but market cyclicality and regulatory shifts remain key concerns. Both remain financially stable but require monitoring of supply chain and geopolitical dynamics.
Which Stock to Choose?
Pentair plc (PNR) shows a stable income evolution with favorable profitability and financial ratios including a 17.55% ROE and a strong debt profile. Its debt-to-equity ratio is favorable, and it holds a very favorable rating supported by a durable competitive advantage and growing ROIC above WACC.
Kadant Inc. (KAI) exhibits robust income growth overall but with mixed recent profitability trends. Its financial ratios are largely favorable, though ROE is moderate at 13.17%, and the company carries lower debt levels. KAI’s rating is very favorable but slightly less robust, reflecting a slightly favorable moat with improving profitability.
Investors focused on quality and durable competitive advantages might find Pentair’s stable profitability and strong moat appealing, while those prioritizing growth potential and improving returns might view Kadant’s trajectory and financial health as favorable. Risk-averse investors could interpret Pentair’s consistent value creation as a sign of stability, whereas more risk-tolerant profiles may see Kadant’s accelerating profitability as an opportunity.
Disclaimer: Investment carries a risk of loss of initial capital. The past performance is not a reliable indicator of future results. Be sure to understand risks before making an investment decision.
Go Further
I encourage you to read the complete analyses of Pentair plc and Kadant Inc. to enhance your investment decisions: