In the dynamic industrial machinery sector, Parsons Corporation and Kadant Inc. stand out as key players with distinct yet overlapping market focuses. Parsons excels in defense and critical infrastructure solutions, while Kadant specializes in engineered systems for fluid handling and industrial processing. This comparison highlights their innovation strategies and market positioning to help you identify which company aligns best with your investment goals. Let’s explore which stock offers the most compelling opportunity for your portfolio.
Table of contents
Companies Overview
I will begin the comparison between Parsons Corporation and Kadant Inc. by providing an overview of these two companies and their main differences.
Parsons Corporation Overview
Parsons Corporation operates in the industrial machinery sector, focusing on integrated solutions and services for defense, intelligence, and critical infrastructure markets globally. The company serves federal and critical infrastructure clients with cybersecurity, space and geospatial solutions, missile defense, environmental systems, and intelligent transportation management. Founded in 1944, Parsons is headquartered in Centreville, VA, and employs around 20,000 people.
Kadant Inc. Overview
Kadant Inc., also in industrial machinery, supplies engineered systems and technologies worldwide across three segments: Flow Control, Industrial Processing, and Material Handling. Its products include fluid-handling systems, pulping process equipment, and biodegradable absorbents for various industries such as packaging, tissue, and agriculture. Founded in 1991, Kadant is based in Westford, MA, with a workforce of approximately 3,500 employees.
Key similarities and differences
Both Parsons and Kadant operate within the industrial machinery industry but target different market niches. Parsons focuses heavily on federal defense, intelligence, and infrastructure solutions, while Kadant specializes in engineered systems for industrial processing and material handling. Parsons has a much larger workforce and market capitalization, reflecting its broad federal contracts, whereas Kadant serves commercial sectors with a narrower product scope and smaller scale.
Income Statement Comparison
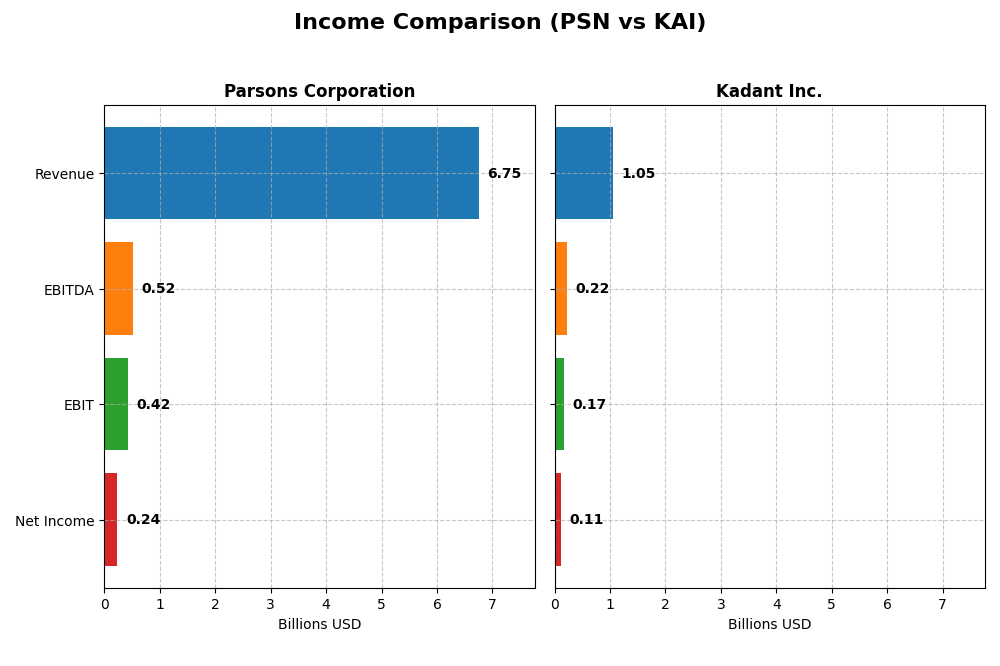
Below is a comparison of key income statement metrics for Parsons Corporation and Kadant Inc. for the fiscal year 2024.
| Metric | Parsons Corporation (PSN) | Kadant Inc. (KAI) |
|---|---|---|
| Market Cap | 7.47B | 3.76B |
| Revenue | 6.75B | 1.05B |
| EBITDA | 518M | 223M |
| EBIT | 419M | 173M |
| Net Income | 238M | 112M |
| EPS | 2.21 | 9.51 |
| Fiscal Year | 2024 | 2024 |
Income Statement Interpretations
Parsons Corporation
Parsons Corporation showed strong revenue growth from $3.66B in 2021 to $6.75B in 2024, with net income rising from $66M to $238M. Gross margins remained favorable around 20.8%, while net margins were stable at approximately 3.5%. The 2024 year reflected a notable acceleration in revenue growth (+24%) and net income (+49%), indicating improved profitability and operational efficiency.
Kadant Inc.
Kadant Inc. experienced steady revenue growth from $786M in 2021 to $1.05B in 2024, with net income increasing from $84M to $112M. Its gross margin stayed favorable at 44.3%, and net margin remained solid near 10.6%. However, 2024 showed slowed EBIT growth (+3.4%) and declines in net margin (-12.6%) and EPS (-4.2%), suggesting some pressure on profitability despite overall expansion.
Which one has the stronger fundamentals?
Parsons exhibits stronger fundamentals with higher growth rates in revenue, net income, and EPS over the past year and period, alongside favorable margin improvements and controlled interest expenses. Kadant, while maintaining higher margins, faced unfavorable margin and EPS declines recently, reflecting mixed signals. Overall, Parsons’ robust growth and margin stability present a more favorable income statement profile.
Financial Ratios Comparison
This table compares the most recent key financial ratios for Parsons Corporation (PSN) and Kadant Inc. (KAI) based on their fiscal year 2024 data.
| Ratios | Parsons Corporation (PSN) | Kadant Inc. (KAI) |
|---|---|---|
| ROE | 9.73% | 13.17% |
| ROIC | 8.28% | 10.08% |
| P/E | 41.7 | 36.9 |
| P/B | 4.06 | 4.86 |
| Current Ratio | 1.29 | 2.31 |
| Quick Ratio | 1.29 | 1.55 |
| D/E (Debt-to-Equity) | 0.59 | 0.38 |
| Debt-to-Assets | 25.9% | 22.6% |
| Interest Coverage | 8.30 | 8.55 |
| Asset Turnover | 1.23 | 0.74 |
| Fixed Asset Turnover | 25.51 | 6.18 |
| Payout Ratio | 0% | 13.1% |
| Dividend Yield | 0% | 0.36% |
Interpretation of the Ratios
Parsons Corporation
Parsons Corporation shows a mixed ratio profile with favorable marks in debt management and asset turnover but unfavorable net margin and return on equity, signaling moderate profitability concerns. Its payout ratio is zero as it does not pay dividends, likely reflecting reinvestment priorities or strategic growth focus without shareholder distributions.
Kadant Inc.
Kadant Inc. presents generally stronger financial ratios, including favorable net margin and return on invested capital, alongside good liquidity and debt metrics. Despite paying a modest dividend with a 0.36% yield, its payout and buyback programs appear conservative, balancing shareholder returns with reinvestment and operational needs amid a slightly elevated P/E ratio.
Which one has the best ratios?
Kadant Inc. has the more favorable ratio set overall, with 57% favorable metrics versus Parsons’ 43%. Kadant’s stronger profitability and liquidity ratios contrast with Parsons’ weaker profitability and higher valuation multiples. However, both show areas needing caution, such as elevated price multiples and modest returns.
Strategic Positioning
This section compares the strategic positioning of Parsons Corporation and Kadant Inc., focusing on Market position, Key segments, and Exposure to technological disruption:
Parsons Corporation
- Leading defense and critical infrastructure solutions provider with moderate competitive pressure.
- Operates two segments: Federal Solutions and Critical Infrastructure, driven by government contracts.
- Exposure to disruption through cybersecurity, geospatial, and advanced defense technologies.
Kadant Inc.
- Specialist in industrial machinery with focused competition in flow control and material handling.
- Operates three segments: Flow Control, Industrial Processing, and Material Handling, industry-specific.
- Exposure to technological changes in fluid handling and industrial automation systems.
Parsons Corporation vs Kadant Inc. Positioning
Parsons has a diversified approach targeting defense and critical infrastructure sectors, providing broad technology-driven solutions. Kadant focuses on industrial machinery segments, with a narrower market scope and specialized product lines, reflecting different competitive dynamics and growth drivers.
Which has the best competitive advantage?
Parsons demonstrates a very favorable moat with a durable competitive advantage and growing profitability, while Kadant shows a slightly favorable moat with improving but less established value creation.
Stock Comparison
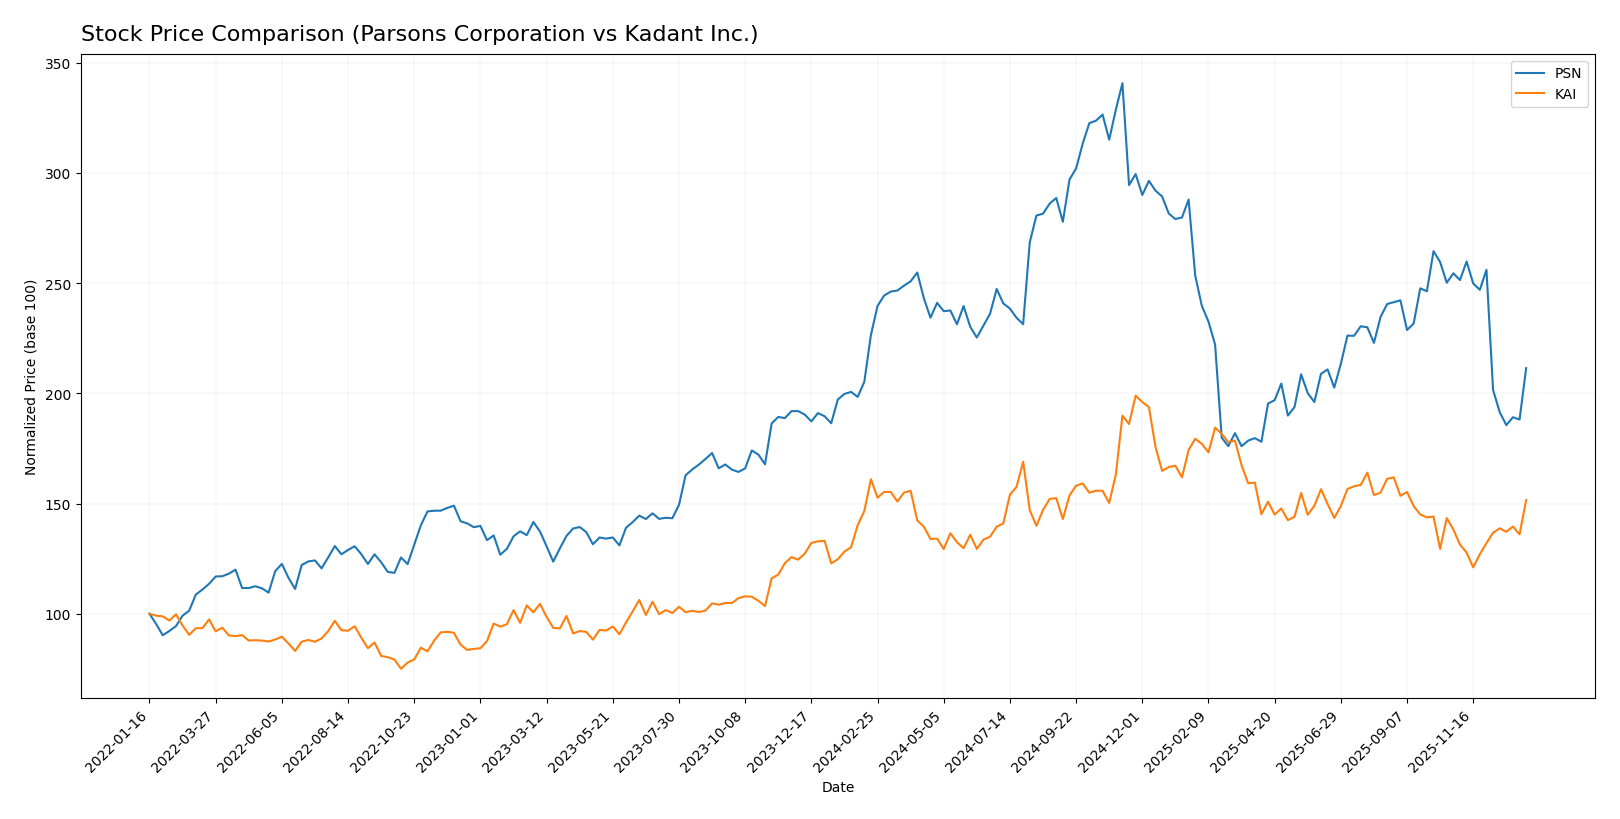
The stock prices of Parsons Corporation (PSN) and Kadant Inc. (KAI) have shown contrasting dynamics over the past 12 months, with both experiencing overall bearish trends but diverging recently in price direction and trading activity.
Trend Analysis
Parsons Corporation (PSN) exhibited a bearish trend over the past year with a 6.64% price decline and decelerating momentum. The stock’s price volatility was moderate, with a standard deviation of 12.98, ranging between $58.22 and $112.69.
Kadant Inc. (KAI) also faced a bearish trend with a 5.86% price drop overall but showed accelerating momentum. Notably, KAI’s price volatility was higher, with a standard deviation of 34.44, fluctuating between $254.91 and $419.01. The recent period saw a 9.69% price increase.
Comparing both, Kadant’s stock delivered the highest market performance recently with a positive 9.69% price change, contrasting with Parsons’ further decline of 16.91% during the same timeframe.
Target Prices
Analysts present a clear consensus on target prices for Parsons Corporation and Kadant Inc.
| Company | Target High | Target Low | Consensus |
|---|---|---|---|
| Parsons Corporation | 107 | 70 | 85 |
| Kadant Inc. | 410 | 275 | 342.5 |
The consensus target prices suggest upside potential for both stocks compared to current prices: Parsons at $69.93 versus an $85 consensus, Kadant at $319.22 versus a $342.5 consensus. This indicates moderate analyst optimism in both cases.
Analyst Opinions Comparison
This section compares analysts’ ratings and grades for Parsons Corporation and Kadant Inc.:
Rating Comparison
Parsons Corporation Rating
- Rating: A- indicating a very favorable outlook.
- Discounted Cash Flow Score: 5, very favorable DCF.
- ROE Score: 4, favorable efficiency in equity use.
- ROA Score: 4, favorable asset utilization.
- Debt To Equity Score: 2, moderate financial risk.
- Overall Score: 4, favorable overall financial health.
Kadant Inc. Rating
- Rating: B indicating a very favorable outlook.
- Discounted Cash Flow Score: 3, moderate DCF.
- ROE Score: 3, moderate efficiency in equity.
- ROA Score: 4, favorable asset utilization.
- Debt To Equity Score: 3, moderate financial risk.
- Overall Score: 3, moderate overall financial health.
Which one is the best rated?
Based on the provided data, Parsons Corporation holds a superior rating overall with an A- and higher scores in discounted cash flow, ROE, and overall assessment compared to Kadant Inc., which has a B rating and generally moderate scores.
Scores Comparison
Here is the comparison of the Altman Z-Score and Piotroski Score for Parsons Corporation and Kadant Inc.:
PSN Scores
- Altman Z-Score: 3.59, indicating a safe zone.
- Piotroski Score: 6, categorized as average.
KAI Scores
- Altman Z-Score: 5.59, indicating a safe zone.
- Piotroski Score: 7, categorized as strong.
Which company has the best scores?
Kadant Inc. has higher scores in both the Altman Z-Score and Piotroski Score compared to Parsons Corporation, indicating stronger financial stability and overall financial health based on the provided data.
Grades Comparison
Here is a comparison of the latest available grades from reputable grading companies for Parsons Corporation and Kadant Inc.:
Parsons Corporation Grades
The following table summarizes recent grades assigned to Parsons Corporation by established grading firms:
| Grading Company | Action | New Grade | Date |
|---|---|---|---|
| B of A Securities | Maintain | Buy | 2025-12-30 |
| Stifel | Maintain | Buy | 2025-12-23 |
| Jefferies | Maintain | Hold | 2025-12-11 |
| TD Cowen | Upgrade | Buy | 2025-12-10 |
| Baird | Maintain | Outperform | 2025-12-08 |
| Truist Securities | Maintain | Buy | 2025-12-08 |
| Keybanc | Maintain | Overweight | 2025-12-08 |
| Truist Securities | Maintain | Buy | 2025-12-05 |
| William Blair | Upgrade | Outperform | 2025-11-20 |
| Keybanc | Maintain | Overweight | 2025-10-20 |
Overall, Parsons Corporation’s grades predominantly fall into the Buy and Outperform categories, with several recent upgrades and no downgrades.
Kadant Inc. Grades
The following table shows recent grades assigned to Kadant Inc. by recognized grading companies:
| Grading Company | Action | New Grade | Date |
|---|---|---|---|
| Barrington Research | Maintain | Outperform | 2025-10-30 |
| Barrington Research | Maintain | Outperform | 2025-10-29 |
| Barrington Research | Maintain | Outperform | 2025-10-27 |
| Barrington Research | Maintain | Outperform | 2025-10-10 |
| Barrington Research | Maintain | Outperform | 2025-09-23 |
| DA Davidson | Maintain | Neutral | 2025-08-04 |
| Barrington Research | Maintain | Outperform | 2025-07-30 |
| Barrington Research | Maintain | Outperform | 2025-07-29 |
| Barrington Research | Maintain | Outperform | 2025-05-01 |
| DA Davidson | Maintain | Neutral | 2025-05-01 |
Kadant Inc.’s grades mainly indicate an Outperform rating from Barrington Research, complemented by Neutral ratings from DA Davidson, without any upgrades or downgrades.
Which company has the best grades?
Parsons Corporation holds a consensus Buy rating with multiple firms maintaining or upgrading their grades, while Kadant Inc. has a Hold consensus with mostly Outperform and Neutral grades. Parsons’ overall stronger and more frequent Buy and Outperform ratings may reflect higher confidence from analysts, potentially influencing investor sentiment more positively.
Strengths and Weaknesses
Below is a comparative overview of key strengths and weaknesses of Parsons Corporation (PSN) and Kadant Inc. (KAI) based on their latest financial and operational data.
| Criterion | Parsons Corporation (PSN) | Kadant Inc. (KAI) |
|---|---|---|
| Diversification | Strongly diversified with Critical Infrastructure ($2.74B) and Federal Solutions ($4.01B) segments | Less diversified, focused on Capital ($360M) and Parts & Consumables ($694M) |
| Profitability | Moderate net margin (3.48%) and ROIC (8.28%), but ROE is low (9.73%) | Higher net margin (10.59%) and ROIC (10.08%), with moderate ROE (13.17%) |
| Innovation | Demonstrates a very favorable economic moat with growing ROIC, indicating sustainable competitive advantage | Slightly favorable moat with growing ROIC, suggesting improving but limited competitive advantage |
| Global presence | Large presence in federal and infrastructure sectors, indicating broad market reach | More niche presence with industrial product focus, less global scale |
| Market Share | Strong position in government-related sectors with stable revenue streams | Smaller market share, concentrated in industrial capital and consumables |
In summary, Parsons Corporation shows a robust and growing competitive advantage with diversified revenue streams, though profitability margins are moderate. Kadant Inc. offers higher profitability ratios and improving returns but operates in a narrower market segment with a less established moat. Investors should weigh diversification and stability against profitability and growth potential.
Risk Analysis
Below is a comparative table outlining key risks for Parsons Corporation (PSN) and Kadant Inc. (KAI) based on the most recent data from 2024:
| Metric | Parsons Corporation (PSN) | Kadant Inc. (KAI) |
|---|---|---|
| Market Risk | Moderate (Beta 0.664) | Higher (Beta 1.245) |
| Debt level | Moderate (D/E 0.59, Debt/Assets 25.89%) | Lower (D/E 0.38, Debt/Assets 22.57%) |
| Regulatory Risk | Elevated due to defense and government contracts | Moderate, exposure to industrial regulations |
| Operational Risk | High complexity in defense & infrastructure projects | Moderate, diversified industrial segments |
| Environmental Risk | Moderate, involved in environmental solutions | Moderate, biodegradable products & industrial handling |
| Geopolitical Risk | High, significant exposure to US and Middle East defense contracts | Low to moderate, global industrial exposure |
The most impactful risks lie with Parsons’ geopolitical and regulatory exposure due to its defense sector focus, which can be sensitive to government policy shifts and international tensions. Kadant’s higher market volatility and moderate operational complexity pose a risk but with less geopolitical sensitivity. Investors should weigh Parsons’ stable balance sheet and safety scores against its sector risks, while Kadant shows stronger profitability but greater price fluctuations.
Which Stock to Choose?
Parsons Corporation (PSN) shows favorable income growth with a 24% revenue increase in 2024 and solid profitability metrics, including a 9.73% ROE and an 8.28% ROIC. Its debt levels are moderate with a net debt to EBITDA of 1.87, and the company holds a very favorable A- rating, supported by a very favorable moat status indicating durable competitive advantage.
Kadant Inc. (KAI) demonstrates strong profitability with a 10.59% net margin and a 13.17% ROE. Revenue growth is positive but moderate at 10% in 2024, and debt is relatively low with a net debt to EBITDA of 1.02. The firm has a favorable B rating and a slightly favorable moat, suggesting improving but less established competitive positioning than PSN.
Investors favoring growth and durable competitive advantages may find PSN’s strong income growth and very favorable rating appealing, whereas those prioritizing higher current profitability and financial stability might view KAI’s favorable ratios and strong scores as advantageous. The choice could depend on the investor’s tolerance for risk and focus on either value creation durability or current profitability metrics.
Disclaimer: Investment carries a risk of loss of initial capital. The past performance is not a reliable indicator of future results. Be sure to understand risks before making an investment decision.
Go Further
I encourage you to read the complete analyses of Parsons Corporation and Kadant Inc. to enhance your investment decisions: