Home > Comparison > Industrials > PH vs KAI
The strategic rivalry between Parker-Hannifin Corporation and Kadant Inc. shapes the industrial machinery landscape. Parker-Hannifin, a diversified industrial and aerospace systems giant, contrasts with Kadant’s specialized engineered systems focus in fluid handling and material processing. This analysis pits a broad capital-intensive model against a niche, innovation-driven approach. I aim to reveal which company offers the superior risk-adjusted return for a diversified industrial portfolio in 2026.
Table of contents
Companies Overview
Parker-Hannifin and Kadant stand as key players shaping the industrial machinery landscape.
Parker-Hannifin Corporation: Global Motion and Control Leader
Parker-Hannifin dominates as a industrial machinery giant, generating revenue through motion and control technologies. Its two core segments serve mobile, industrial, and aerospace markets worldwide. In 2026, it sharpened focus on expanding its aerospace systems and diversified industrial solutions, emphasizing precision and durability in harsh environments.
Kadant Inc.: Specialized Industrial Systems Innovator
Kadant positions itself as a niche technology supplier with fluid handling, industrial processing, and material handling segments. It drives revenue from engineered systems supporting packaging, wood products, and alternative fuels. The company’s 2026 strategy centers on innovation in flow control and industrial automation to enhance operational efficiency and sustainability.
Strategic Collision: Similarities & Divergences
Both companies serve industrial sectors but differ in scale and scope. Parker-Hannifin pursues a broad, integrated product offering, while Kadant focuses on specialized engineered systems. Their primary battleground lies in fluid handling and industrial processing solutions. Investors face distinct profiles: Parker-Hannifin offers diversified global exposure, Kadant targets niche innovation within specific industrial verticals.
Income Statement Comparison
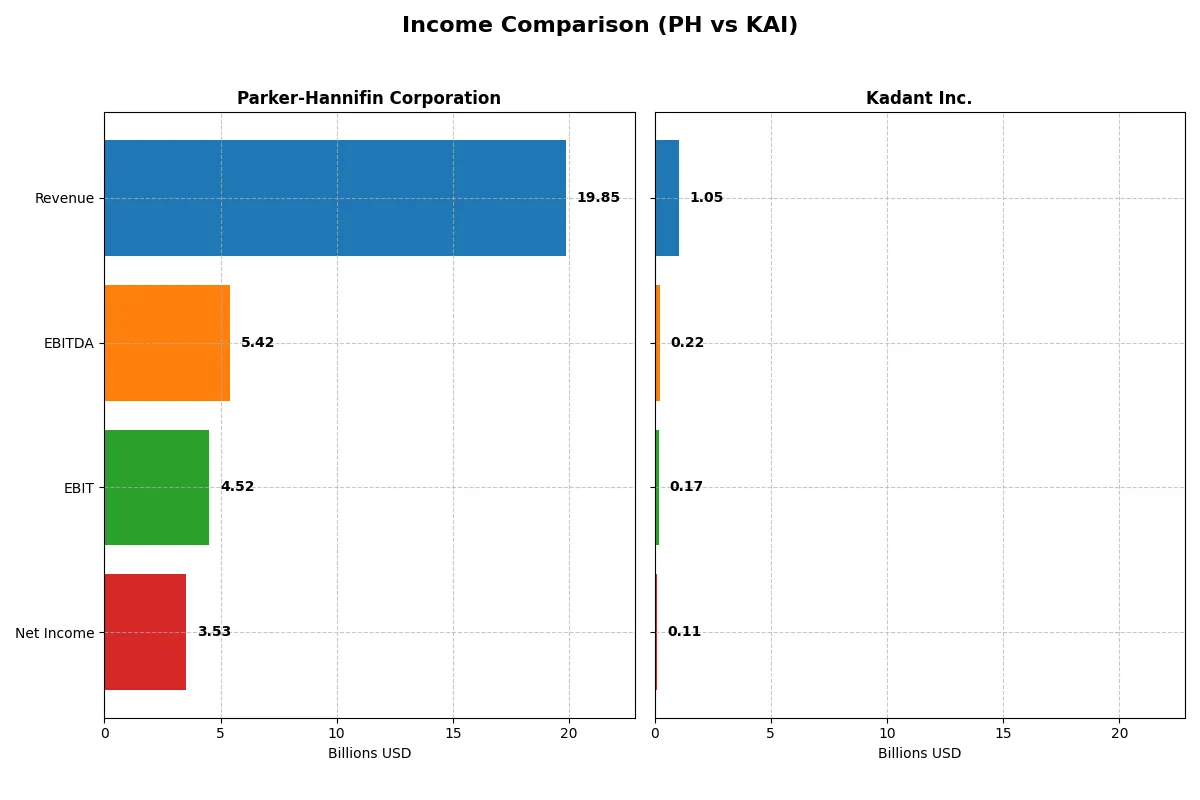
The following data dissects the core profitability and scalability of both corporate engines to reveal who dominates the bottom line:
| Metric | Parker-Hannifin Corporation (PH) | Kadant Inc. (KAI) |
|---|---|---|
| Revenue | 19.85B | 1.05B |
| Cost of Revenue | 12.54B | 587M |
| Operating Expenses | 3.26B | 294M |
| Gross Profit | 7.32B | 466M |
| EBITDA | 5.42B | 223M |
| EBIT | 4.52B | 173M |
| Interest Expense | 409M | 20M |
| Net Income | 3.53B | 112M |
| EPS | 27.52 | 9.51 |
| Fiscal Year | 2025 | 2024 |
Income Statement Analysis: The Bottom-Line Duel
This income statement comparison reveals which company runs its financial engine with the most efficiency and momentum.
Parker-Hannifin Corporation Analysis
Parker-Hannifin’s revenue grew from $14.3B in 2021 to $19.9B in 2024 before a slight dip to $19.85B in 2025. Net income more than doubled over five years, reaching $3.53B in 2025. Gross and net margins remain robust at 36.9% and 17.8%, respectively, signaling strong operational control and improving profitability momentum.
Kadant Inc. Analysis
Kadant’s revenue climbed steadily from $635M in 2020 to $1.05B in 2024, a 66% rise. Despite a 10% revenue jump in 2024, net income declined to $112M, down 4% from the prior year. Its superior gross margin of 44.3% contrasts with a lower net margin of 10.6%, reflecting rising operating expenses that dampen bottom-line gains.
Margin Strength vs. Growth Scalability
Parker-Hannifin leads with superior net margins and consistent net income growth, outperforming Kadant’s higher gross margin but weaker net margin and recent profit contraction. For investors prioritizing stable profitability and margin expansion, Parker-Hannifin’s disciplined cost management and earnings momentum present a more attractive profile.
Financial Ratios Comparison
These vital ratios act as a diagnostic tool to expose the underlying fiscal health, valuation premiums, and capital efficiency of the companies compared below:
| Ratios | Parker-Hannifin (PH) | Kadant (KAI) |
|---|---|---|
| ROE | 25.81% | 13.17% |
| ROIC | 13.69% | 10.08% |
| P/E | 25.38x | 36.90x |
| P/B | 6.55x | 4.86x |
| Current Ratio | 1.19 | 2.31 |
| Quick Ratio | 0.71 | 1.55 |
| D/E (Debt-to-Equity) | 0.69 | 0.38 |
| Debt-to-Assets | 32.16% | 22.57% |
| Interest Coverage | 9.93x | 8.55x |
| Asset Turnover | 0.67 | 0.74 |
| Fixed Asset Turnover | 6.76 | 6.18 |
| Payout Ratio | 24.38% | 13.15% |
| Dividend Yield | 0.96% | 0.36% |
| Fiscal Year | 2025 | 2024 |
Efficiency & Valuation Duel: The Vital Signs
Financial ratios act as a company’s DNA, uncovering hidden risks and operational strengths that shape investor confidence and valuation.
Parker-Hannifin Corporation
Parker-Hannifin demonstrates robust profitability with a 25.8% ROE and a strong 17.8% net margin, signaling operational efficiency. However, its valuation is stretched, with a P/E of 25.4 and a high P/B of 6.55. The stock offers a modest 0.96% dividend yield, reflecting a cautious but steady shareholder return approach.
Kadant Inc.
Kadant presents moderate profitability with a 13.2% ROE and 10.6% net margin, reflecting solid but less dominant efficiency. Its valuation is more expensive, shown by a high P/E of 36.9 and P/B of 4.86. Kadant pays a lower dividend yield of 0.36%, focusing more on reinvestment to drive growth.
Premium Valuation vs. Operational Safety
Kadant’s ratios reflect a growth-oriented, higher-risk profile with expensive valuation metrics. Parker-Hannifin balances superior profitability and operational efficiency against a stretched valuation. Investors prioritizing stable returns and operational safety might prefer Parker-Hannifin, while those seeking growth at a premium may lean toward Kadant.
Which one offers the Superior Shareholder Reward?
I compare Parker-Hannifin Corporation (PH) and Kadant Inc. (KAI) by focusing on dividends, payout ratios, and buyback intensity. PH yields ~1.0% with a 24% payout ratio, supported by strong free cash flow (FCF) coverage above 88%. KAI’s yield is much lower at ~0.4%, with a 13% payout ratio and modest FCF conversion. PH also deploys more capital to dividends and buybacks, signaling a shareholder-friendly approach. KAI retains capital, likely for R&D and growth, given its higher margins but lower payout. PH’s model appears more sustainable and attractive for total return in 2026, delivering consistent income plus buyback-driven value. I conclude PH offers the superior shareholder reward.
Comparative Score Analysis: The Strategic Profile
The radar chart reveals the fundamental DNA and trade-offs of Parker-Hannifin Corporation and Kadant Inc., highlighting their financial strengths and vulnerabilities:
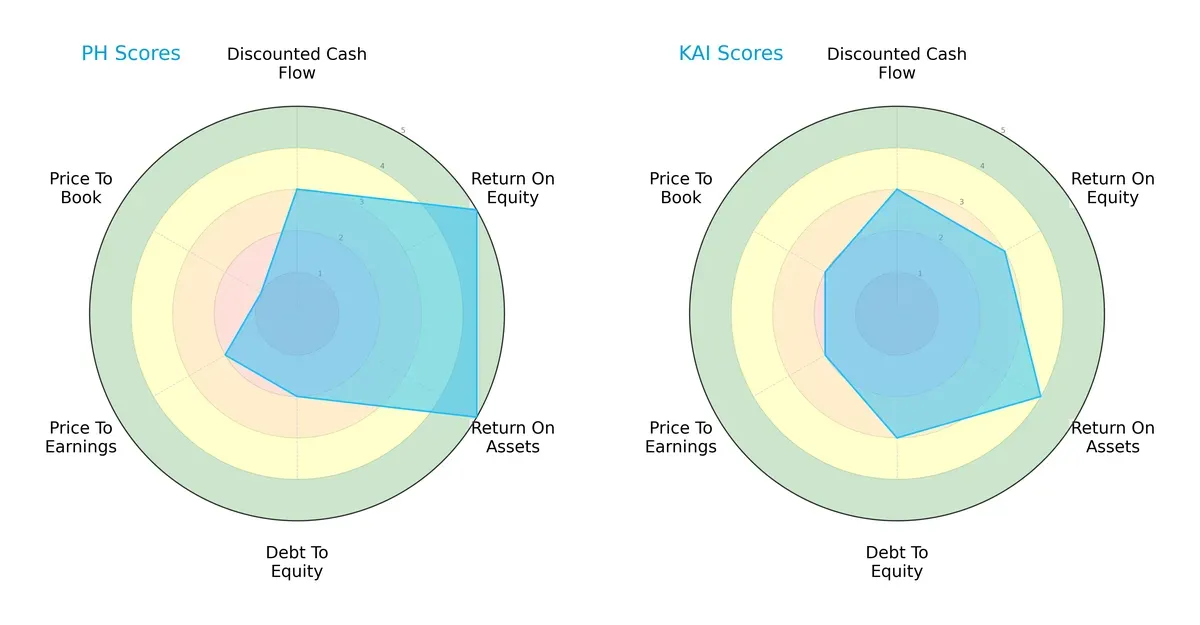
Parker-Hannifin leads with superior ROE and ROA scores (5 vs. 3 and 5 vs. 4), demonstrating stronger profitability and asset efficiency. Kadant shows a more balanced debt-to-equity score (3 vs. 2) and slightly better price-to-book valuation (2 vs. 1). Parker-Hannifin relies heavily on operational excellence, while Kadant maintains steadier financial leverage and valuation metrics.
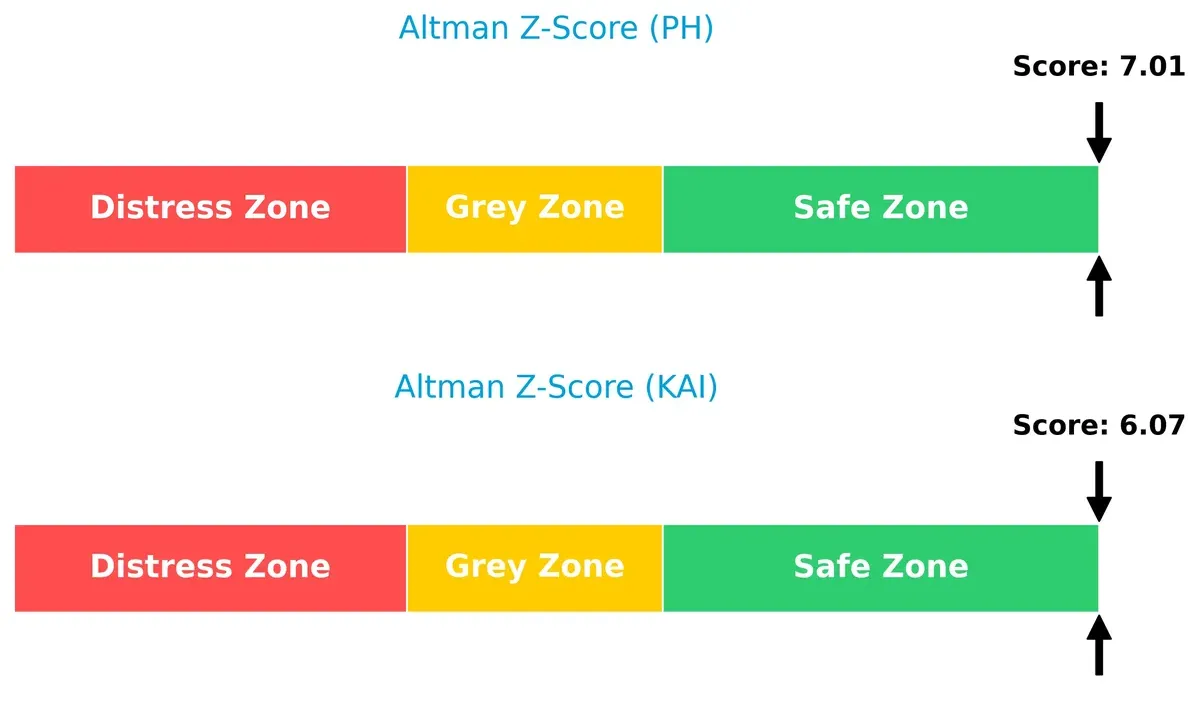
Bankruptcy Risk: Solvency Showdown
Parker-Hannifin’s Altman Z-Score of 7.01 surpasses Kadant’s 6.07, both comfortably in the safe zone, signaling strong solvency and low bankruptcy risk in today’s cycle:
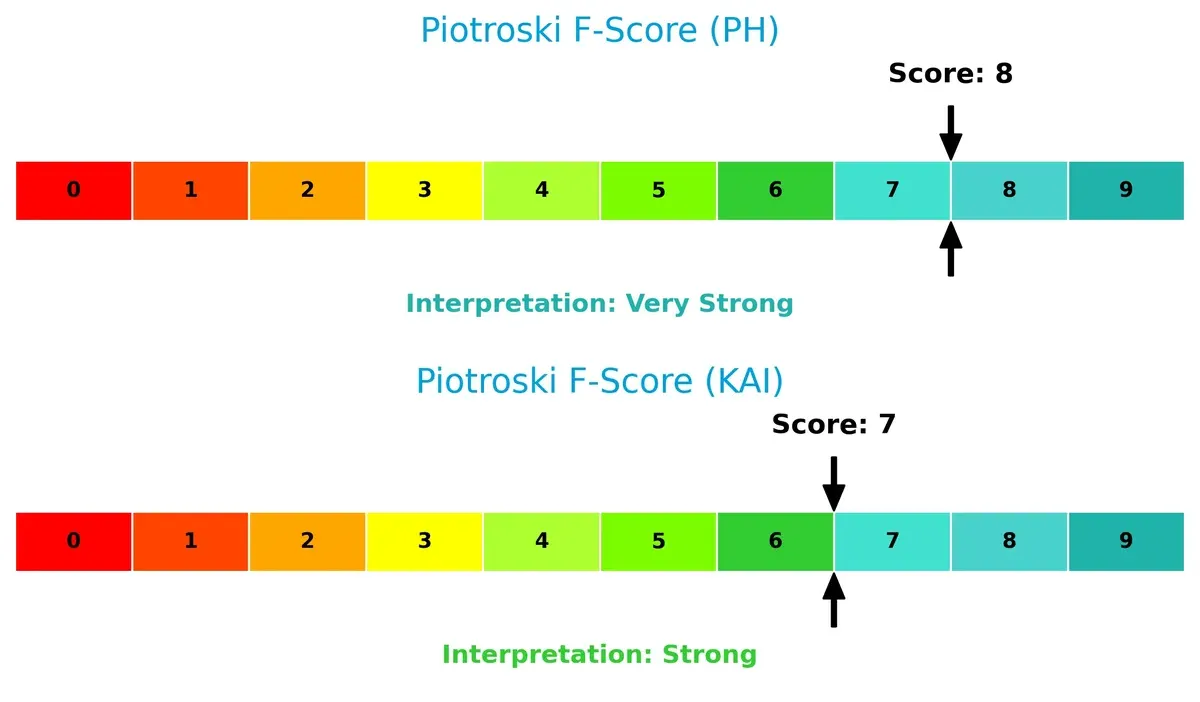
Financial Health: Quality of Operations
Parker-Hannifin’s Piotroski F-Score of 8 outperforms Kadant’s 7, indicating Parker-Hannifin is in peak financial health with fewer internal red flags:
How are the two companies positioned?
This section dissects PH and KAI’s operational DNA by comparing their revenue distribution and internal strengths and weaknesses. The goal is to confront their economic moats to reveal which model offers the most resilient competitive advantage in today’s market.
Revenue Segmentation: The Strategic Mix
This visual comparison dissects how Parker-Hannifin and Kadant diversify their income streams and where their primary sector bets lie:
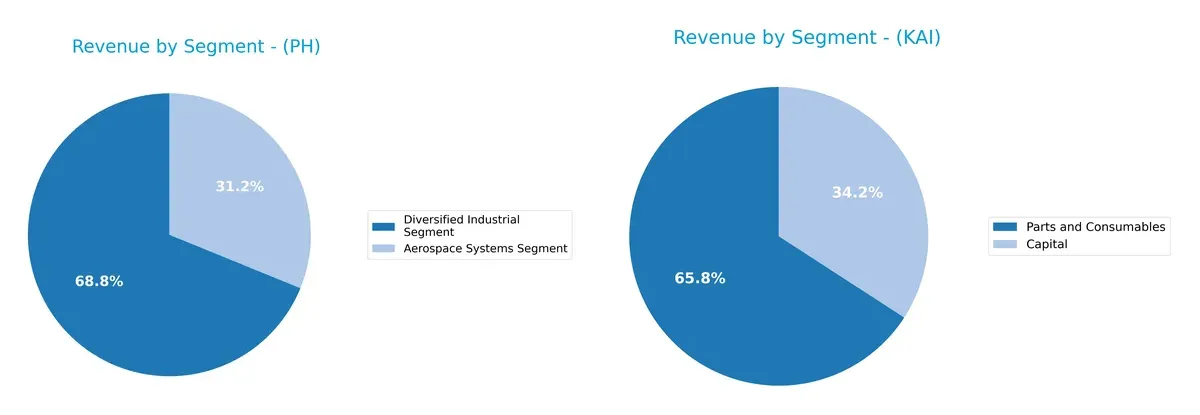
Parker-Hannifin anchors its revenue in a two-segment mix: $13.7B in Diversified Industrial and $6.2B in Aerospace Systems for 2025, showing a robust industrial base complemented by aerospace. Kadant leans heavily on Parts and Consumables at $694M and Capital at $360M, signaling reliance on aftermarket sales and equipment. Parker-Hannifin’s broader mix reduces concentration risk, while Kadant’s focus suggests strong niche dominance but potential vulnerability to sector shifts.
Strengths and Weaknesses Comparison
This table compares the Strengths and Weaknesses of Parker-Hannifin Corporation (PH) and Kadant Inc. (KAI):
PH Strengths
- Diversified industrial and aerospace segments
- Strong profitability with 17.79% net margin and 25.81% ROE
- Favorable ROIC of 13.69% above WACC
- Solid interest coverage at 11.04
- Global presence in North America, Europe, and Asia Pacific with billions in revenue
KAI Strengths
- Favorable net margin at 10.59% and ROIC of 10.08%
- Strong liquidity with current ratio 2.31 and quick ratio 1.55
- Lower debt-to-equity at 0.38 and debt-to-assets at 22.57%
- Favorable interest coverage of 8.64
- Global sales presence including North America and Europe with consistent revenue from capital and parts segments
PH Weaknesses
- Elevated P/E of 25.38 and high P/B at 6.55, indicating possible overvaluation
- Quick ratio weak at 0.71, suggesting liquidity risk
- Dividend yield low at 0.96%
- Moderate leverage with debt-to-equity 0.69
- Neutral asset turnover at 0.67
KAI Weaknesses
- High P/E ratio of 36.9 and P/B at 4.86, signaling valuation concerns
- Lower ROE at 13.17%, only neutral
- Dividend yield very low at 0.36%
- Asset turnover neutral at 0.74
- Smaller scale and less diversification compared to PH
Both companies show strong profitability and global reach, but PH benefits from broader diversification and higher returns on equity and capital. KAI outperforms on liquidity and lower leverage but faces valuation pressure and less diversification. These factors shape each firm’s financial flexibility and strategic options going forward.
The Moat Duel: Analyzing Competitive Defensibility
Structural moats protect long-term profits from relentless competitive pressures. Only durable advantages shield earnings sustainably:
Parker-Hannifin Corporation: Engineering Scale and Innovation Moat
Parker-Hannifin’s moat stems from complex motion-control technologies and high switching costs embedded in industrial and aerospace sectors. Its 23% EBIT margin and growing ROIC confirm stable, high-value returns. New aerospace system launches in 2026 could further deepen this moat.
Kadant Inc.: Niche Process Expertise Moat
Kadant leverages specialized flow control and industrial processing systems, differentiating itself with process know-how rather than broad scale. Despite solid revenue growth, its 16% EBIT margin and ROIC below WACC signal a narrower moat. Expansion into alternative fuel markets may boost its defensibility.
Engineering Scale vs. Niche Expertise: Moat Strength Showdown
Parker-Hannifin’s wider, more durable moat outpaces Kadant’s niche advantage, as evidenced by superior ROIC and margin stability. I see Parker-Hannifin better positioned to defend and grow its market share amid intensifying competition.
Which stock offers better returns?
Over the past 12 months, Parker-Hannifin’s stock surged substantially with accelerating gains, while Kadant’s shares showed a mild decline despite recent positive momentum.
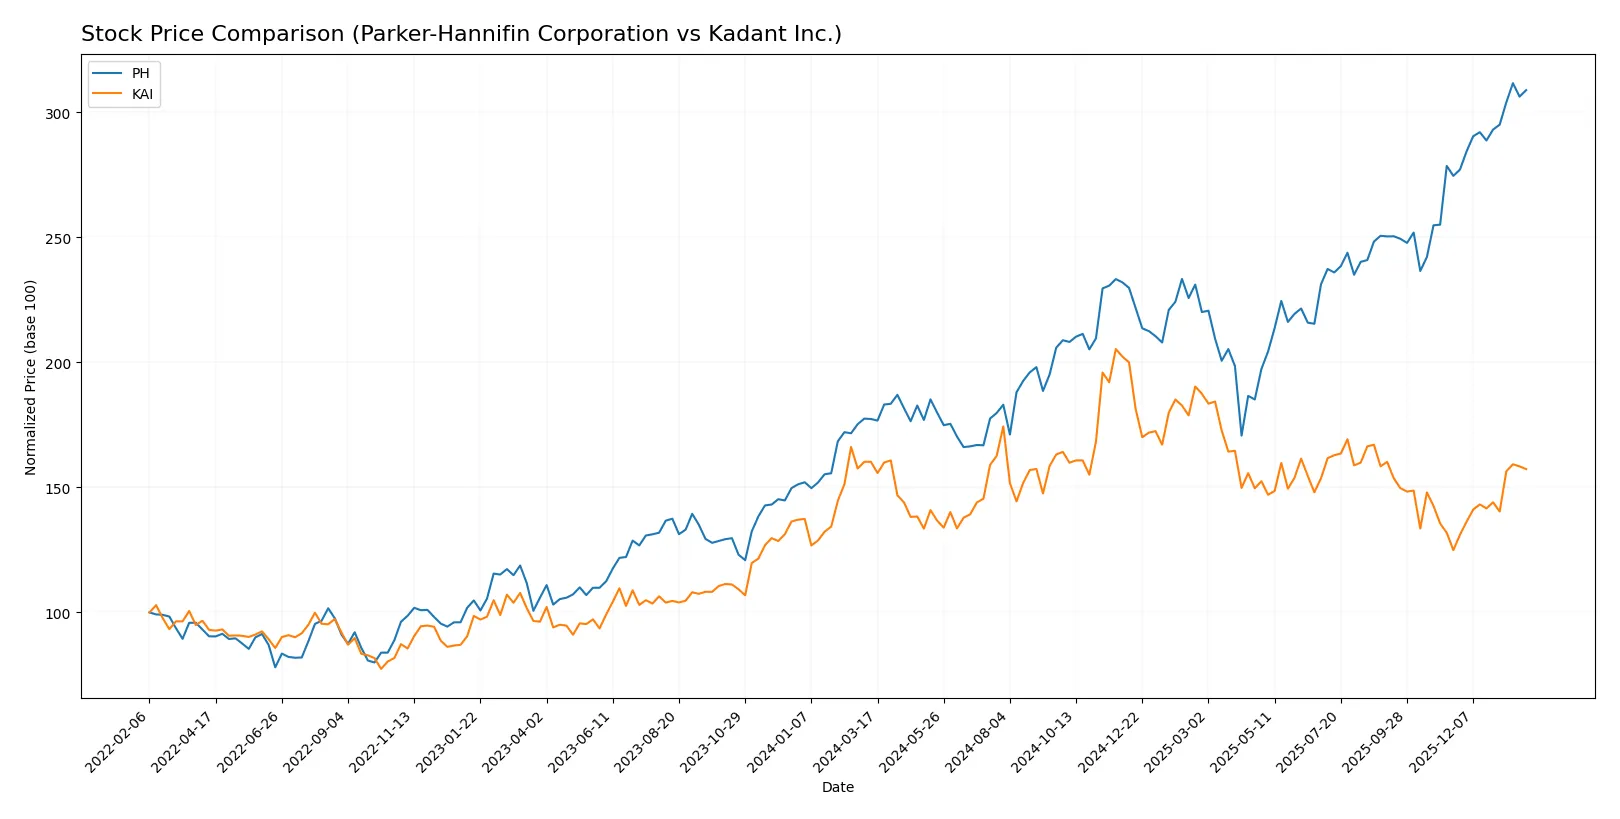
Trend Comparison
Parker-Hannifin’s stock price increased 74.16% over the past year, reflecting a strong bullish trend with accelerating momentum and significant volatility. Its highest price reached 944.27, and the trend accelerated notably.
Kadant’s stock declined 1.82% over the same period, indicating a bearish trend despite recent acceleration and a 25.94% price rise in the last two and a half months. Volatility remained moderate.
Parker-Hannifin clearly outperformed Kadant, delivering the highest market returns over the analyzed year, driven by sustained and accelerating price appreciation.
Target Prices
Analysts project solid upside potential for Parker-Hannifin Corporation and Kadant Inc. based on recent consensus targets.
| Company | Target Low | Target High | Consensus |
|---|---|---|---|
| Parker-Hannifin Corporation | 825 | 1,139 | 995.46 |
| Kadant Inc. | 275 | 410 | 342.5 |
The consensus target for Parker-Hannifin stands about 6% above its current price of 935.84 USD, signaling moderate upside. Kadant’s target consensus exceeds the present 321.04 USD price by roughly 7%, indicating cautious optimism.

Don’t Let Luck Decide Your Entry Point
Optimize your entry points with our advanced ProRealTime indicators. You’ll get efficient buy signals with precise price targets for maximum performance. Start outperforming now!
How do institutions grade them?
Parker-Hannifin Corporation Grades
This table summarizes recent institutional grades for Parker-Hannifin Corporation.
| Grading Company | Action | New Grade | Date |
|---|---|---|---|
| Wells Fargo | Maintain | Overweight | 2026-01-30 |
| Citigroup | Maintain | Buy | 2026-01-30 |
| JP Morgan | Maintain | Overweight | 2026-01-30 |
| Jefferies | Maintain | Buy | 2026-01-30 |
| Barclays | Maintain | Overweight | 2026-01-30 |
| Stifel | Maintain | Hold | 2026-01-30 |
| Stifel | Maintain | Hold | 2026-01-23 |
| JP Morgan | Maintain | Overweight | 2026-01-16 |
| Morgan Stanley | Maintain | Equal Weight | 2026-01-14 |
| Barclays | Maintain | Overweight | 2026-01-07 |
Kadant Inc. Grades
This table summarizes recent institutional grades for Kadant Inc.
| Grading Company | Action | New Grade | Date |
|---|---|---|---|
| Barrington Research | Maintain | Outperform | 2025-10-30 |
| Barrington Research | Maintain | Outperform | 2025-10-29 |
| Barrington Research | Maintain | Outperform | 2025-10-27 |
| Barrington Research | Maintain | Outperform | 2025-10-10 |
| Barrington Research | Maintain | Outperform | 2025-09-23 |
| DA Davidson | Maintain | Neutral | 2025-08-04 |
| Barrington Research | Maintain | Outperform | 2025-07-30 |
| Barrington Research | Maintain | Outperform | 2025-07-29 |
| Barrington Research | Maintain | Outperform | 2025-05-01 |
| DA Davidson | Maintain | Neutral | 2025-05-01 |
Which company has the best grades?
Parker-Hannifin shows consistent “Overweight” and “Buy” ratings, signaling strong institutional confidence. Kadant’s “Outperform” ratings are mostly from one firm, with some “Neutral” grades. Investors might view Parker-Hannifin’s broader endorsement as a sign of wider market support.
Risks specific to each company
The following categories identify critical pressure points and systemic threats facing Parker-Hannifin Corporation and Kadant Inc. in the 2026 market environment:
1. Market & Competition
Parker-Hannifin Corporation
- Dominates diversified industrial and aerospace segments with strong product breadth but faces high competition and margin pressures.
Kadant Inc.
- Operates in niche industrial machinery sectors with less scale, facing competitive pressure from specialized players.
2. Capital Structure & Debt
Parker-Hannifin Corporation
- Moderate leverage (D/E 0.69), with solid interest coverage (11.04x) but quick ratio (0.71) signals liquidity caution.
Kadant Inc.
- Lower leverage (D/E 0.38) and strong liquidity (quick ratio 1.55) reflect a more conservative balance sheet.
3. Stock Volatility
Parker-Hannifin Corporation
- Beta at 1.253 indicates slightly higher volatility than market, impacted by aerospace cyclicality.
Kadant Inc.
- Beta at 1.228 shows moderately high volatility typical for mid-cap industrials.
4. Regulatory & Legal
Parker-Hannifin Corporation
- Aerospace exposure subjects it to stringent FAA and defense regulations, elevating compliance risk.
Kadant Inc.
- Industrial focus limits regulatory risks but environmental and safety standards continue to tighten.
5. Supply Chain & Operations
Parker-Hannifin Corporation
- Global operations risk supply disruptions, especially in aerospace components with complex supplier networks.
Kadant Inc.
- Smaller scale aids supply chain agility, but reliance on specific industrial inputs could cause bottlenecks.
6. ESG & Climate Transition
Parker-Hannifin Corporation
- Faces pressure to reduce carbon footprint in aerospace and industrial manufacturing.
Kadant Inc.
- Opportunities exist in sustainable product lines but must manage operational emissions carefully.
7. Geopolitical Exposure
Parker-Hannifin Corporation
- Aerospace and defense sales expose it to geopolitical tensions and export restrictions.
Kadant Inc.
- Primarily domestic and commercial industrial markets reduce geopolitical risk sensitivity.
Which company shows a better risk-adjusted profile?
Parker-Hannifin’s largest risk is regulatory and geopolitical exposure due to aerospace reliance. Kadant’s key risk lies in market competition and operational bottlenecks. Kadant’s stronger liquidity and conservative leverage signal a better risk-adjusted profile. Notably, Parker-Hannifin’s weak quick ratio amid high debt suggests potential short-term liquidity stress, reinforcing caution despite its scale.
Final Verdict: Which stock to choose?
Parker-Hannifin Corporation’s superpower lies in its durable competitive advantage and efficient capital allocation, reflected in a robust and growing ROIC well above its cost of capital. Its point of vigilance remains its stretched valuation multiples, which might temper near-term upside. It suits portfolios seeking steady, long-term value creation with moderate growth.
Kadant Inc. boasts a strategic moat through consistent revenue growth and strong balance sheet health, underpinned by a favorable current ratio and manageable debt. While it lacks Parker-Hannifin’s margin strength, its safety profile appears higher, making it better suited for investors prioritizing capital preservation alongside growth—ideal for GARP strategies.
If you prioritize durable competitive advantage and proven value creation, Parker-Hannifin outshines due to its superior ROIC and accelerating bullish momentum. However, if you seek a safer balance sheet with solid growth prospects, Kadant offers better stability and an appealing growth trajectory despite a slightly weaker moat. Each presents a compelling analytical scenario tailored to distinct investor risk profiles.
Disclaimer: Investment carries a risk of loss of initial capital. The past performance is not a reliable indicator of future results. Be sure to understand risks before making an investment decision.
Go Further
I encourage you to read the complete analyses of Parker-Hannifin Corporation and Kadant Inc. to enhance your investment decisions: