Home > Comparison > Industrials > OTIS vs KAI
The strategic rivalry between Otis Worldwide Corporation and Kadant Inc. shapes the current trajectory of the industrial machinery sector. Otis operates as a capital-intensive leader in elevator and escalator manufacturing and service, while Kadant focuses on engineered systems across flow control and material handling. This head-to-head highlights a contrast between broad infrastructure scale and specialized technology innovation. This analysis will identify which path offers superior risk-adjusted returns for a diversified portfolio.

Table of contents
Companies Overview
Otis Worldwide Corporation and Kadant Inc. both hold significant roles in the industrial machinery sector with distinct operational models.
Otis Worldwide Corporation: Global Elevator and Escalator Leader
Otis dominates the elevator and escalator market by designing, manufacturing, and servicing these systems worldwide. Its core revenue stems from two segments: new equipment sales and extensive maintenance services. In 2026, Otis emphasizes expanding its service network to leverage its installed base, focusing on modernization and long-term contracts to secure recurring revenue.
Kadant Inc.: Specialized Industrial Technology Provider
Kadant specializes in engineered systems and technologies for industrial processing, flow control, and material handling. It generates revenue by supplying fluid-handling equipment, pulping machinery, and conveyor systems across diverse industries. The company’s 2026 strategy centers on innovation and segment diversification to strengthen its position in niche markets like renewable materials and industrial automation.
Strategic Collision: Similarities & Divergences
Both companies operate in industrial machinery but pursue contrasting approaches: Otis builds a closed ecosystem around elevators and services, while Kadant targets an open infrastructure with varied industrial solutions. Their primary market battleground lies in industrial facilities requiring equipment modernization. Otis offers stable, service-driven income; Kadant presents growth potential through technological diversification and niche specialization.
Income Statement Comparison
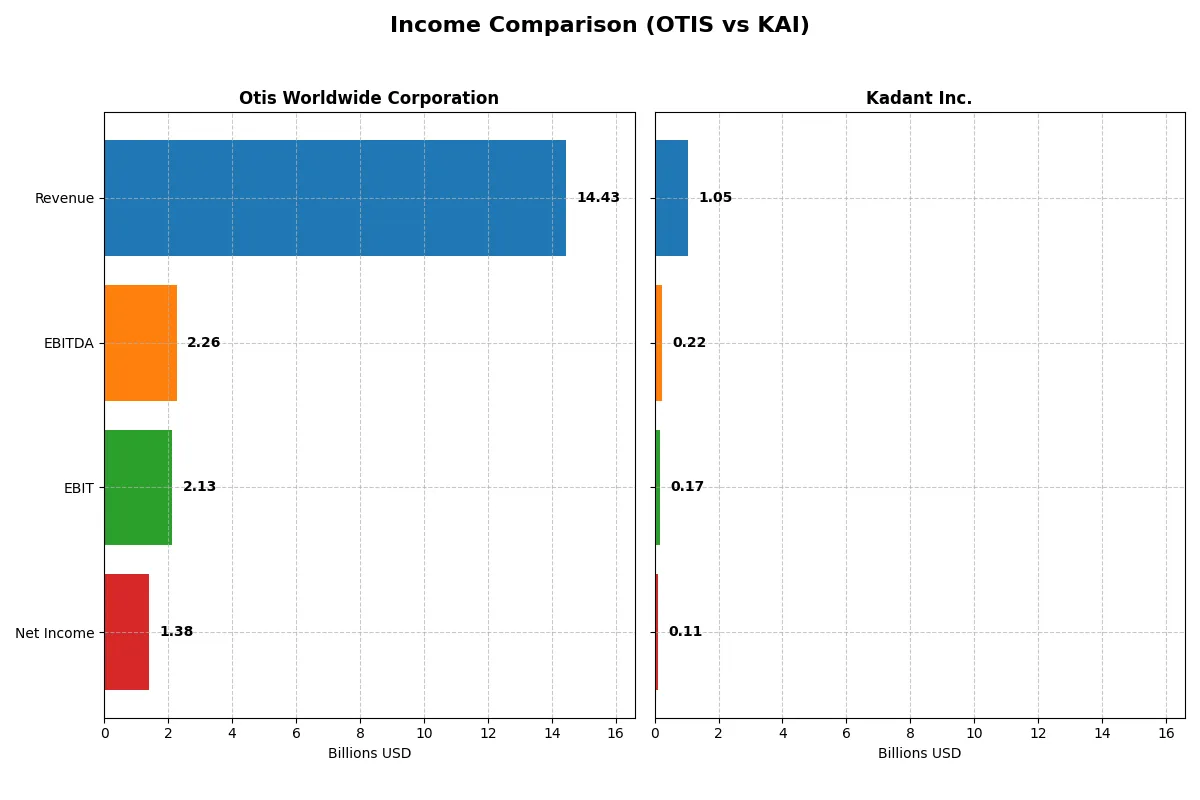
This table dissects the core profitability and scalability of both corporate engines to reveal who dominates the bottom line:
| Metric | Otis Worldwide Corporation (OTIS) | Kadant Inc. (KAI) |
|---|---|---|
| Revenue | 14.43B | 1.05B |
| Cost of Revenue | 10.04B | 587M |
| Operating Expenses | 2.20B | 294M |
| Gross Profit | 4.40B | 466M |
| EBITDA | 2.26B | 223M |
| EBIT | 2.13B | 173M |
| Interest Expense | 196M | 20M |
| Net Income | 1.38B | 112M |
| EPS | 3.53 | 9.51 |
| Fiscal Year | 2025 | 2024 |
Income Statement Analysis: The Bottom-Line Duel
This income statement comparison reveals which company operates with superior efficiency and profitability in their respective industries.
Otis Worldwide Corporation Analysis
Otis’s revenue grew modestly from 14.3B in 2024 to 14.4B in 2025, showing a slight upward trend. Its net income declined from 1.65B to 1.38B, pressuring net margins down to 9.6%. The gross margin remains solid at 30.5%, while operating expenses grew favorably in line with revenue. Efficiency slipped slightly, signaling margin compression despite steady top-line performance.
Kadant Inc. Analysis
Kadant’s revenue surged 10% to 1.05B in 2024, continuing strong growth momentum. Net income fell to 112M from 116M, dragging net margin down to 10.6%. Gross margin stands robust at 44.3%, and EBIT margin outpaces Otis at 16.4%. Although operating expenses rose faster than revenue, Kadant sustains attractive profitability with a clear growth trajectory and expanding earnings per share.
Margin Resilience vs. Growth Trajectory
Otis showcases stable revenue with compressing net income and margins, highlighting operational challenges in sustaining profitability. Kadant delivers stronger revenue growth and better margin profiles, though recent net income dipped slightly. The fundamental winner is Kadant, offering a more dynamic growth and margin expansion profile. Investors seeking growth and efficiency will find Kadant’s model more compelling.
Financial Ratios Comparison
These vital ratios act as a diagnostic tool to expose the underlying fiscal health, valuation premiums, and capital efficiency of the companies compared below:
| Ratios | Otis Worldwide Corporation (OTIS) | Kadant Inc. (KAI) |
|---|---|---|
| ROE | -25.7% (2025) | 13.2% (2024) |
| ROIC | 40.7% (2025) | 10.1% (2024) |
| P/E | 24.8x (2025) | 36.9x (2024) |
| P/B | -6.4 (2025) | 4.9 (2024) |
| Current Ratio | 0.85 (2025) | 2.31 (2024) |
| Quick Ratio | 0.77 (2025) | 1.55 (2024) |
| D/E (Debt-to-Equity) | -1.62 (2025) | 0.38 (2024) |
| Debt-to-Assets | 82.1% (2025) | 22.6% (2024) |
| Interest Coverage | 11.2x (2025) | 8.6x (2024) |
| Asset Turnover | 1.35 (2025) | 0.74 (2024) |
| Fixed Asset Turnover | 11.1 (2025) | 6.18 (2024) |
| Payout ratio | 46.7% (2025) | 13.1% (2024) |
| Dividend yield | 1.88% (2025) | 0.36% (2024) |
| Fiscal Year | 2025 | 2024 |
Efficiency & Valuation Duel: The Vital Signs
Financial ratios serve as a company’s DNA, uncovering hidden risks and operational excellence that numbers alone cannot reveal.
Otis Worldwide Corporation
Otis posts a negative ROE at -25.7%, signaling shareholder returns pressure despite a solid 40.7% ROIC well above its 7.4% WACC. The stock trades at a reasonable P/E of 24.9, suggesting a fairly priced valuation. Otis pays a 1.88% dividend, balancing shareholder returns with modest reinvestment in R&D.
Kadant Inc.
Kadant shows a healthier ROE of 13.2% and a net margin of 10.6%, reflecting efficient profitability. However, its P/E ratio of 36.9 marks the stock as expensive relative to peers. Kadant’s dividend yield is low at 0.36%, indicating a strategy focused on growth and reinvestment rather than income distribution.
Operational Efficiency vs. Premium Valuation
Otis offers a stronger capital efficiency and a balanced valuation, despite its ROE challenges and liquidity risks. Kadant delivers consistent profitability with a higher valuation premium and lower dividend yield. Risk-tolerant growth investors may prefer Kadant, while those valuing operational discipline and income might lean toward Otis.
Which one offers the Superior Shareholder Reward?
I see Otis pays a 1.88% dividend yield with a moderate 47% payout ratio, sustaining payments with strong free cash flow. Otis also executes steady buybacks, enhancing shareholder returns. Kadant yields just 0.36%, with a low 13% payout, preferring aggressive reinvestment and modest buybacks. Kadant’s growth focus suits long-term value creation, but Otis’s balanced dividends plus buybacks offer a more attractive total return profile in 2026.
Comparative Score Analysis: The Strategic Profile
The radar chart reveals the fundamental DNA and trade-offs of Otis Worldwide Corporation and Kadant Inc., highlighting their core financial strengths and weaknesses:
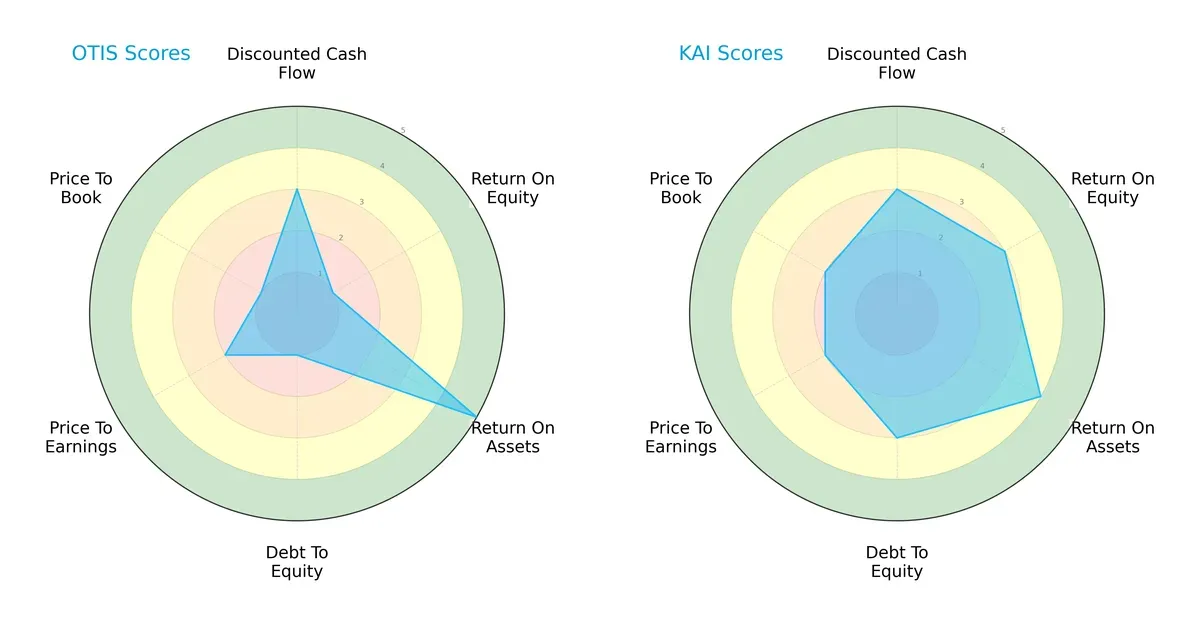
Kadant presents a more balanced financial profile with moderate scores across DCF, ROE, ROA, and debt-to-equity, reflecting steady profitability and manageable leverage. Otis relies heavily on asset efficiency (ROA score of 5) but shows vulnerability with very low ROE and debt-to-equity scores, indicating higher financial risk and weaker equity returns. Kadant’s higher overall score suggests stronger operational execution and capital allocation discipline.
Bankruptcy Risk: Solvency Showdown
The Altman Z-Score difference underscores Kadant’s superior solvency, implying a safer long-term survival outlook in this economic cycle:
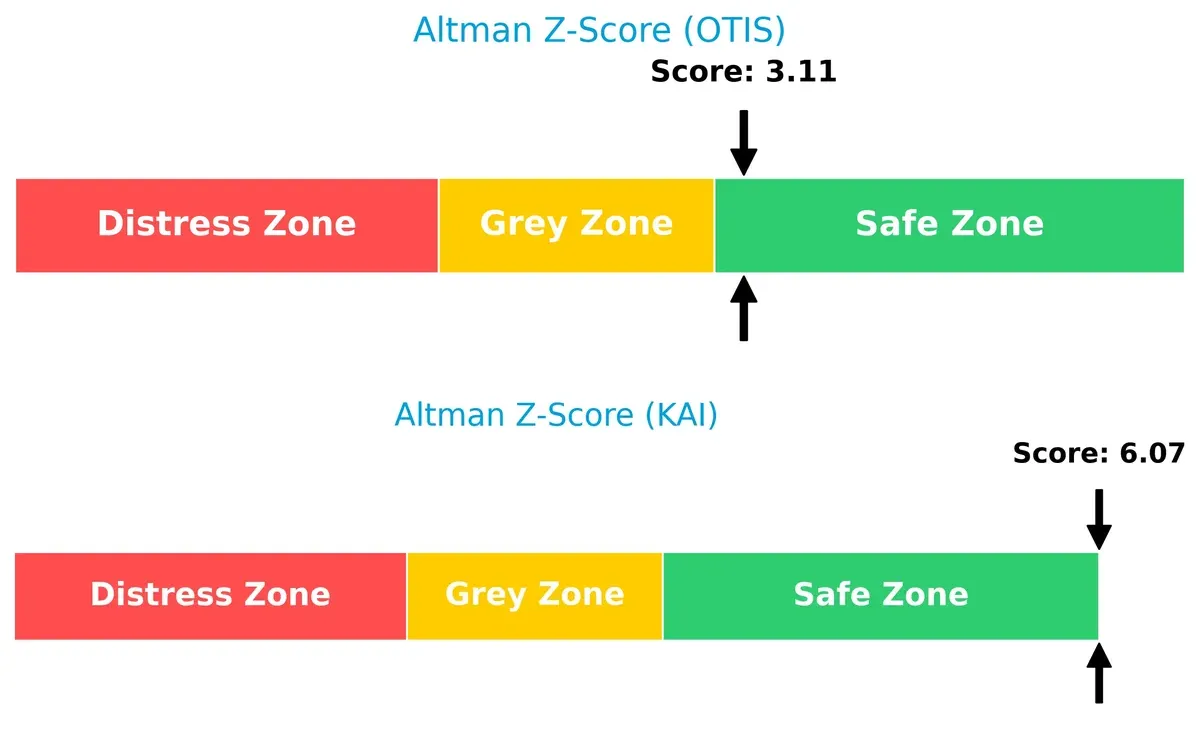
Kadant’s Z-Score of 6.07 places it comfortably in the safe zone, signaling low bankruptcy risk. Otis, with a score of 3.11, also sits in the safe zone but much closer to the grey area, indicating a comparatively higher financial risk that investors must monitor.
Financial Health: Quality of Operations
Kadant’s Piotroski F-Score of 7 signals strong financial health, outperforming Otis’s average score of 6, which hints at potential internal red flags:
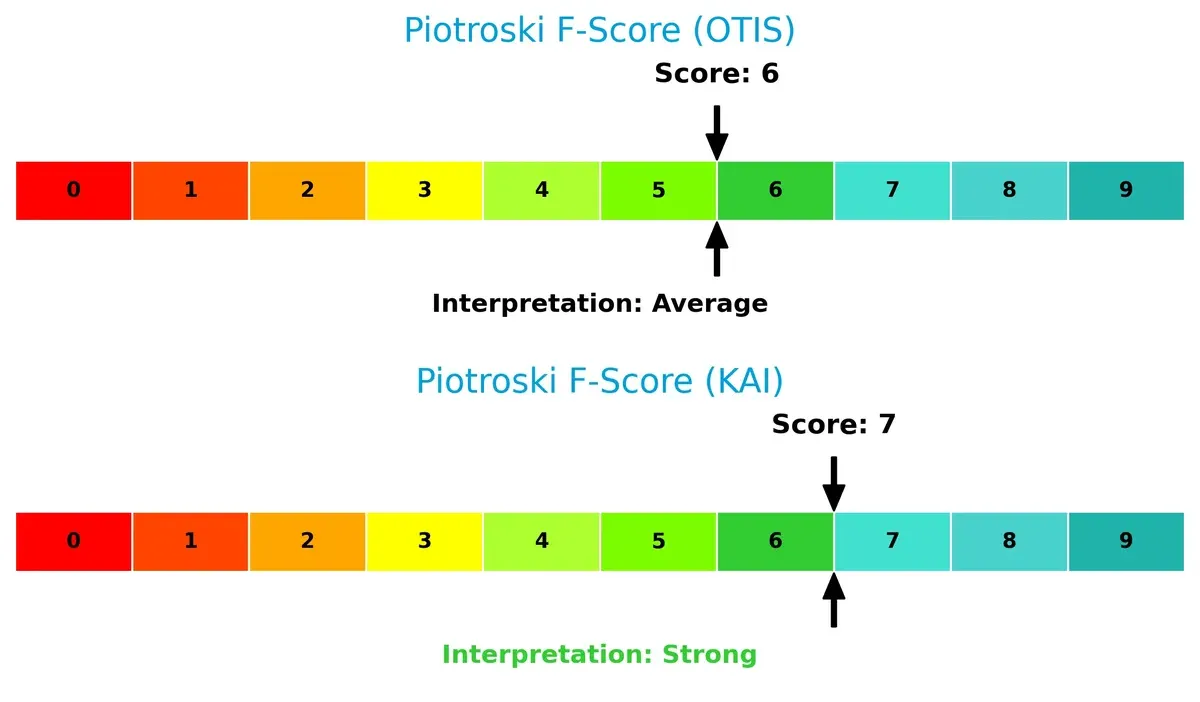
Kadant demonstrates superior profitability, liquidity, and operational efficiency metrics, providing a more robust quality of earnings. Otis’s lower score suggests caution; some internal metrics may warrant scrutiny, especially given its weaker debt and equity returns.
How are the two companies positioned?
This section dissects Otis and Kadant’s operational DNA by comparing revenue distribution and internal dynamics. The goal is to confront their economic moats and identify which business model offers the most resilient competitive advantage today.
Revenue Segmentation: The Strategic Mix
This visual comparison dissects how Otis Worldwide and Kadant diversify their income streams and where their primary sector bets lie:
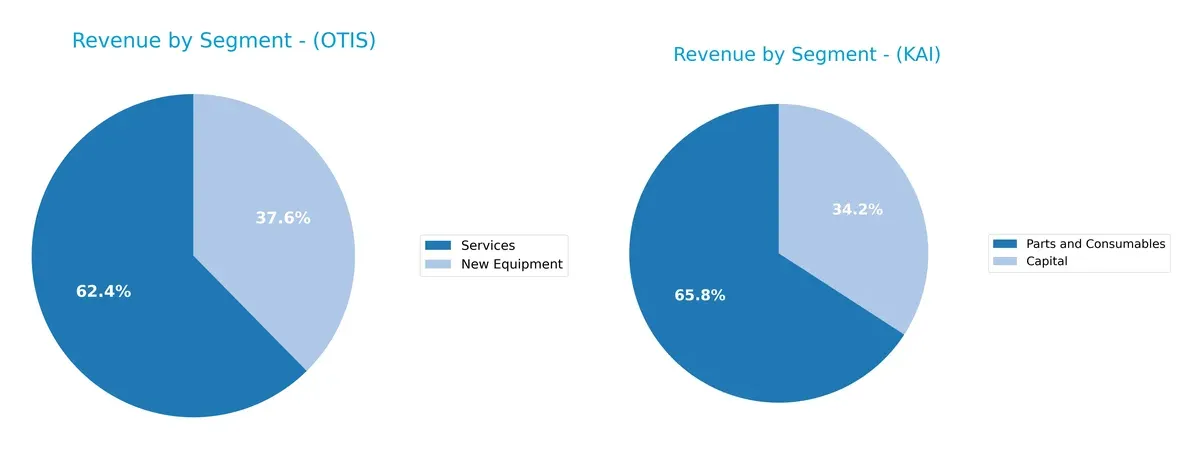
Otis anchors its revenue in two dominant segments: Services at $8.9B and New Equipment at $5.4B in 2024. Kadant leans heavily on Parts and Consumables at $694M, more than doubling its Capital segment at $360M. Otis’s balanced model signals ecosystem lock-in and steady recurring income. Kadant’s concentration in consumables suggests reliance on replacement cycles but heightens vulnerability to market shifts. Otis’s scale dwarfs Kadant’s niche focus.
Strengths and Weaknesses Comparison
This table compares the Strengths and Weaknesses of Otis Worldwide Corporation and Kadant Inc.:
Otis Strengths
- Strong service revenue base with $8.9B in 2024
- High ROIC at 40.74% well above WACC
- Favorable asset and fixed asset turnover ratios
- Solid interest coverage ratio
- High global diversification with significant U.S. and China sales
Kadant Strengths
- Favorable net margin and ROIC above WACC
- Strong liquidity ratios with current ratio of 2.31
- Low debt to assets ratio at 22.57%
- Favorable fixed asset turnover
- Diversified revenue across North America, Europe, Asia
- Consistent revenue growth in parts and consumables
Otis Weaknesses
- Negative ROE at -25.67% signals poor equity returns
- Low current and quick ratios below 1 indicate liquidity risk
- High debt to assets at 82.14% raises financial leverage concerns
- Negative price-to-book ratio
- Higher dependency on new equipment sales with volatility
Kadant Weaknesses
- Elevated PE and PB ratios suggest expensive valuation
- Lower asset turnover at 0.74 limits efficiency
- Low dividend yield of 0.36% may deter income investors
- Smaller scale with less revenue diversification compared to Otis
Otis demonstrates robust operational efficiency and global scale but faces balance sheet leverage and equity return challenges. Kadant shows healthier liquidity and profitability metrics but trades at higher valuation multiples with less asset efficiency. These factors shape their strategic priorities in capital management and market positioning.
The Moat Duel: Analyzing Competitive Defensibility
A structural moat is the sole barrier protecting long-term profits from relentless competitive erosion in any industry:
Otis Worldwide Corporation: Service Network & Installed Base Moat
Otis commands a durable moat through its vast service network and installed elevator base. Its ROIC outpaces WACC by 33%, reflecting efficient capital use and margin stability. Innovation in modernization services may deepen this moat in 2026.
Kadant Inc.: Specialized Engineering & Product Portfolio Moat
Kadant’s moat stems from specialized engineered systems and high-margin product niches, contrasting Otis’s service-driven model. Despite ROIC slightly below WACC, rising profitability signals improving capital efficiency. Expansion into new industrial segments could fortify its position.
Verdict: Service Network vs. Specialized Engineering – Who Defends Better?
Otis holds the deeper moat with a 33% ROIC premium over WACC, proving stronger value creation and resilience. Kadant’s improving ROIC trend is promising but still trails, making Otis better equipped to defend market share long-term.
Which stock offers better returns?
Over the past year, Otis Worldwide Corporation’s stock declined steadily while Kadant Inc. showed a mild overall drop but a strong recent rebound, highlighting contrasting trading dynamics.
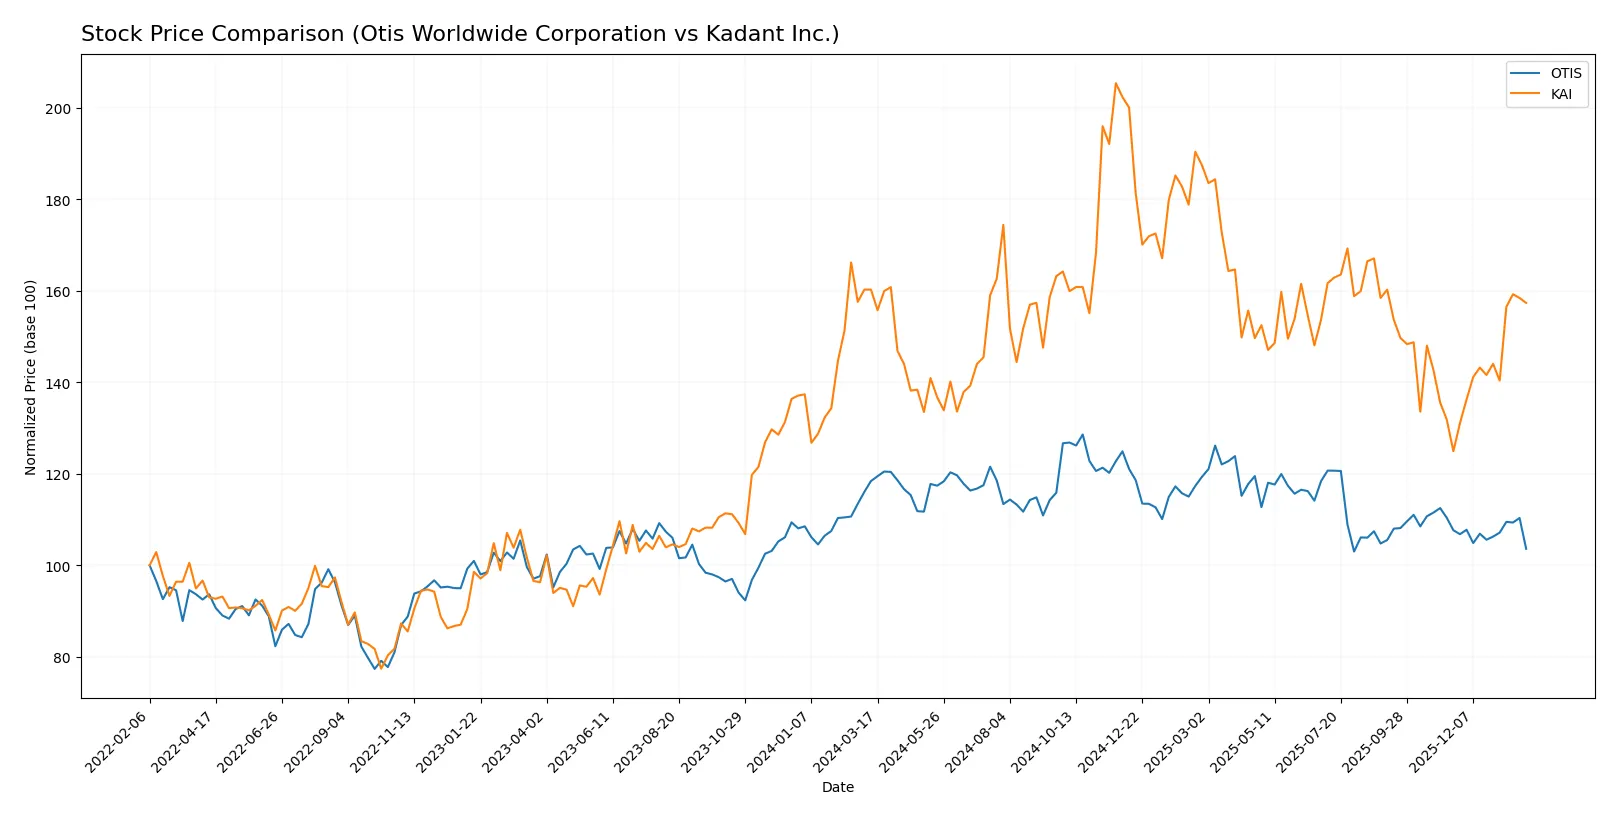
Trend Comparison
Otis Worldwide’s stock fell 12.51% over the last 12 months, marking a bearish trend with accelerating decline. Its price ranged between 84.93 and 106.01, showing moderate volatility (4.86 std dev).
Kadant Inc.’s stock experienced a slight 1.82% decrease overall, still bearish but less severe. Notably, it surged 25.94% recently, indicating accelerating recovery amid high volatility (34.39 std dev).
Kadant’s recent sharp rebound outperformed Otis’s persistent decline, delivering the highest market performance in the analyzed period.
Target Prices
Analysts present a bullish consensus for Otis Worldwide Corporation and Kadant Inc., signaling upside potential from current prices.
| Company | Target Low | Target High | Consensus |
|---|---|---|---|
| Otis Worldwide Corporation | 92 | 109 | 97.75 |
| Kadant Inc. | 275 | 410 | 342.5 |
Otis trades at $85.42, below its $97.75 consensus, indicating a potential 14% upside. Kadant’s $321.04 price sits slightly below the $342.5 consensus, suggesting moderate growth expectations.

Don’t Let Luck Decide Your Entry Point
Optimize your entry points with our advanced ProRealTime indicators. You’ll get efficient buy signals with precise price targets for maximum performance. Start outperforming now!
How do institutions grade them?
The following grades from reputable institutions summarize the current outlooks for Otis Worldwide Corporation and Kadant Inc.:
Otis Worldwide Corporation Grades
Here are the most recent institutional grades for Otis Worldwide Corporation:
| Grading Company | Action | New Grade | Date |
|---|---|---|---|
| JP Morgan | Maintain | Overweight | 2026-01-16 |
| Wells Fargo | Maintain | Equal Weight | 2025-12-15 |
| Barclays | Maintain | Underweight | 2025-10-30 |
| JP Morgan | Maintain | Overweight | 2025-10-15 |
| Wolfe Research | Upgrade | Outperform | 2025-10-08 |
Kadant Inc. Grades
These are the recent grades assigned to Kadant Inc. by institutional analysts:
| Grading Company | Action | New Grade | Date |
|---|---|---|---|
| Barrington Research | Maintain | Outperform | 2025-10-30 |
| Barrington Research | Maintain | Outperform | 2025-10-29 |
| Barrington Research | Maintain | Outperform | 2025-10-27 |
| Barrington Research | Maintain | Outperform | 2025-10-10 |
| DA Davidson | Maintain | Neutral | 2025-08-04 |
Which company has the best grades?
Kadant Inc. consistently earns “Outperform” ratings from Barrington Research, indicating a stronger consensus on growth potential. Otis Worldwide shows mixed views, with grades from “Underweight” to “Outperform,” reflecting more diverse analyst sentiment. Investors may perceive Kadant as having clearer institutional support, while Otis faces varied outlooks.
Risks specific to each company
The following categories identify the critical pressure points and systemic threats facing both Otis Worldwide Corporation and Kadant Inc. in the 2026 market environment:
1. Market & Competition
Otis Worldwide Corporation
- Faces intense competition in elevators and escalators globally, with pressure from innovation and infrastructure cycles.
Kadant Inc.
- Competes in niche industrial machinery markets, exposed to cyclical demand in packaging and pulp industries.
2. Capital Structure & Debt
Otis Worldwide Corporation
- High debt-to-assets ratio (82%) signals leverage risk despite good interest coverage.
Kadant Inc.
- Maintains moderate leverage (23% debt-to-assets) with solid coverage, reflecting prudent capital structure.
3. Stock Volatility
Otis Worldwide Corporation
- Beta near 1.0 suggests average market volatility; range steady but price recently dropped 2%.
Kadant Inc.
- Beta above 1.2 implies higher volatility; recent price declined nearly 1%, reflecting sensitivity to market swings.
4. Regulatory & Legal
Otis Worldwide Corporation
- Subject to stringent safety and building regulations across global markets, increasing compliance costs.
Kadant Inc.
- Operates in environmentally sensitive sectors, facing tightening emissions and waste disposal regulations.
5. Supply Chain & Operations
Otis Worldwide Corporation
- Large global supply chain vulnerable to raw material price shifts and service network disruptions.
Kadant Inc.
- Smaller scale operations more agile but exposed to delays in specialized components and raw materials.
6. ESG & Climate Transition
Otis Worldwide Corporation
- Increasing pressure to decarbonize manufacturing and service fleets; ESG compliance crucial for contracts.
Kadant Inc.
- Faces challenges adapting product lines for sustainability; benefits from biodegradable product segments.
7. Geopolitical Exposure
Otis Worldwide Corporation
- Significant exposure to China and emerging markets, risking tariff impacts and political tensions.
Kadant Inc.
- Primarily US-focused but dependent on global supply chains, vulnerable to trade policy shifts.
Which company shows a better risk-adjusted profile?
Kadant’s lower leverage, stronger liquidity ratios, and higher Altman Z-score illustrate a more resilient financial position. Otis’s high debt and weak current ratios present notable red flags despite market leadership. Kadant also boasts a stronger Piotroski score, signaling better financial health. Otis’s biggest risk is its leveraged balance sheet amid cyclical infrastructure demand. Kadant’s main concern lies in market volatility and sector-specific regulatory pressures. Recent financial data shows Otis’s debt-to-assets ratio above 80%, underscoring leverage risk. Overall, Kadant offers a superior risk-adjusted profile for cautious investors in 2026.
Final Verdict: Which stock to choose?
Otis Worldwide Corporation’s superpower lies in its durable competitive advantage and exceptional capital efficiency, demonstrated by a ROIC vastly exceeding its cost of capital. However, its stretched liquidity ratios present a point of vigilance. This stock fits well in a portfolio targeting stable, value-creating industrial leaders.
Kadant Inc. boasts a strategic moat rooted in solid recurring revenues and a robust balance sheet with low leverage. Its financial safety profile is stronger than Otis’s, though it trades at a higher valuation. Kadant suits investors seeking steady growth with a moderate risk appetite.
If you prioritize resilient value creation and proven capital allocation, Otis outshines due to its superior economic moat and operating returns. However, if you seek growth stability backed by financial strength and a cleaner balance sheet, Kadant offers better stability despite commanding a premium. Both present viable, differentiated investment scenarios depending on your risk and growth preferences.
Disclaimer: Investment carries a risk of loss of initial capital. The past performance is not a reliable indicator of future results. Be sure to understand risks before making an investment decision.
Go Further
I encourage you to read the complete analyses of Otis Worldwide Corporation and Kadant Inc. to enhance your investment decisions: