In the ever-evolving industrial machinery sector, Kadant Inc. and Nano Nuclear Energy Inc. represent two distinct yet intriguing investment opportunities. Kadant, with its established global footprint, focuses on engineered systems and fluid-handling solutions, while Nano Nuclear Energy pioneers microreactor technology and nuclear fuel innovation. This article will analyze both companies’ market positions and growth potential to help you decide which is the more compelling choice for your investment portfolio.
Table of contents
Companies Overview
I will begin the comparison between Kadant Inc. and Nano Nuclear Energy Inc by providing an overview of these two companies and their main differences.
Kadant Inc. Overview
Kadant Inc. supplies technologies and engineered systems worldwide through three segments: Flow Control, Industrial Processing, and Material Handling. The company focuses on fluid-handling systems, industrial machinery, and material handling equipment, serving industries such as packaging, tissue, wood products, and alternative fuels. Founded in 1991 and headquartered in Westford, Massachusetts, Kadant operates with 3,500 employees and is listed on the NYSE.
Nano Nuclear Energy Inc Overview
Nano Nuclear Energy Inc. is a microreactor technology company developing solid-core and low-pressure coolant nuclear reactors along with a uranium fabrication facility. Founded in 2021 and based in New York City, the company also engages in fuel transportation and nuclear consultation services. With just 5 employees, Nano Nuclear Energy is listed on the NASDAQ and focuses on innovative nuclear energy solutions.
Key similarities and differences
Both companies operate in the Industrials sector and focus on machinery, but Kadant targets traditional industrial processing and material handling markets with an established global presence. In contrast, Nano Nuclear Energy is a young, niche player specializing in advanced nuclear microreactor technology. Kadant’s workforce and market cap are significantly larger, reflecting its established status versus Nano Nuclear’s early-stage development and higher beta risk profile.
Income Statement Comparison
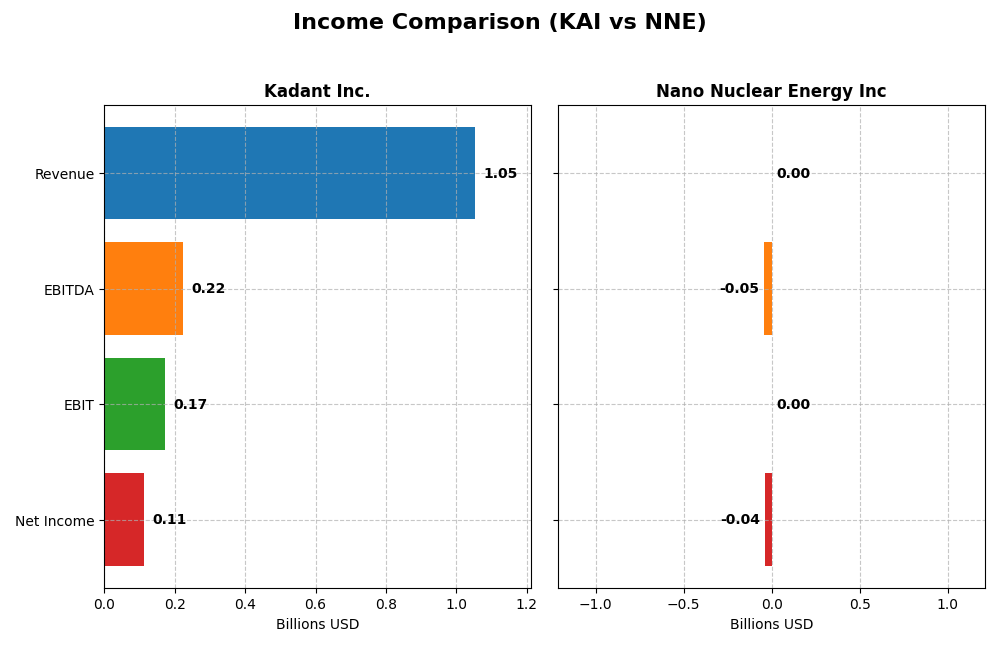
The table below compares the key income statement metrics of Kadant Inc. and Nano Nuclear Energy Inc. for their most recent fiscal years, providing a snapshot of their financial performance.
| Metric | Kadant Inc. (KAI) | Nano Nuclear Energy Inc (NNE) |
|---|---|---|
| Market Cap | 3.76B | 1.33B |
| Revenue | 1.05B | 0 |
| EBITDA | 223M | -46.2M |
| EBIT | 173M | 0 |
| Net Income | 112M | -40.1M |
| EPS | 9.51 | -1.06 |
| Fiscal Year | 2024 | 2025 |
Income Statement Interpretations
Kadant Inc.
Kadant Inc. demonstrated steady revenue growth from $635M in 2020 to $1.05B in 2024, with net income rising from $55.2M to $111.6M over the same period. Margins remained favorable, highlighted by a 44.25% gross margin and 10.59% net margin in 2024. However, net margin and EPS slightly declined last year, indicating some margin pressure despite overall growth.
Nano Nuclear Energy Inc
Nano Nuclear Energy posted zero revenue from 2022 to 2025, reflecting its early-stage development status. Net losses widened from -$1.03M in 2022 to -$40.1M in 2025, with no gross or EBIT margins. Although EPS improved in 2025, the company remains unprofitable, highlighting significant operating expenses without corresponding revenue.
Which one has the stronger fundamentals?
Kadant Inc. shows stronger fundamentals with consistent revenue and net income growth, supported by favorable margins and operating efficiency. In contrast, Nano Nuclear Energy’s lack of revenue and sustained losses mark weaker income statement fundamentals. Kadant’s financial performance suggests stability, whereas Nano Nuclear Energy remains in an early investment risk phase.
Financial Ratios Comparison
The table below presents a side-by-side comparison of key financial ratios for Kadant Inc. (KAI) and Nano Nuclear Energy Inc (NNE) based on their most recent fiscal year data.
| Ratios | Kadant Inc. (KAI) 2024 | Nano Nuclear Energy Inc (NNE) 2025 |
|---|---|---|
| ROE | 13.17% | -18.00% |
| ROIC | 10.08% | -20.51% |
| P/E | 36.9 | -0.0365 |
| P/B | 4.86 | 0.0066 |
| Current Ratio | 2.31 | 53.48 |
| Quick Ratio | 1.55 | 53.48 |
| D/E (Debt-to-Equity) | 0.38 | 0.013 |
| Debt-to-Assets | 22.57% | 1.22% |
| Interest Coverage | 8.55 | 0 |
| Asset Turnover | 0.74 | 0 |
| Fixed Asset Turnover | 6.18 | 0 |
| Payout Ratio | 13.15% | 0 |
| Dividend Yield | 0.36% | 0 |
Interpretation of the Ratios
Kadant Inc.
Kadant Inc. shows a generally favorable financial profile with strong liquidity ratios, low debt levels, and solid returns on invested capital and assets. However, valuation multiples like PE and PB are unfavorable, suggesting the stock might be pricey relative to earnings and book value. Dividend yield is low at 0.36%, indicating modest shareholder returns, supported by steady dividends without excessive buybacks.
Nano Nuclear Energy Inc
Nano Nuclear Energy’s ratios reveal significant challenges, including negative profitability and returns, and a high cost of capital. While valuation multiples like PE and PB appear favorable due to low market prices, operational metrics such as asset turnover and interest coverage are weak. The company does not pay dividends, reflecting its early-stage status and focus on reinvestment and development.
Which one has the best ratios?
Kadant Inc. presents a more favorable ratio profile overall, with balanced leverage, good profitability, and sufficient liquidity. In contrast, Nano Nuclear Energy faces unfavorable profitability and operational metrics, with no dividend payouts and high financial risk. Thus, Kadant’s ratios suggest a stronger and more stable financial standing compared to Nano Nuclear Energy.
Strategic Positioning
This section compares the strategic positioning of Kadant Inc. and Nano Nuclear Energy Inc., focusing on market position, key segments, and exposure to technological disruption:
Kadant Inc.
- Mid-cap industrial machinery firm with moderate beta and stable trading volume.
- Diverse segments: Flow Control, Industrial Processing, Material Handling, supplying engineered systems globally.
- Operates in well-established industrial machinery sectors with low explicit disruption risk mentioned.
Nano Nuclear Energy Inc
- Small-cap microreactor developer with very high beta and volatile trading volume.
- Focused on microreactor technologies and nuclear fuel fabrication, with consulting and transport businesses.
- Developing advanced nuclear reactors, facing potential technological disruption inherent in nuclear innovation.
Kadant Inc. vs Nano Nuclear Energy Inc Positioning
Kadant exhibits a diversified industrial machinery portfolio with steady market presence, while Nano Nuclear Energy concentrates on cutting-edge nuclear microreactors and fuel supply. Kadant’s broader segments reduce dependency risks, Nano Nuclear Energy’s focus offers innovation potential but higher volatility.
Which has the best competitive advantage?
Kadant holds a slightly favorable moat with growing profitability and efficient capital use, whereas Nano Nuclear Energy shows a slightly unfavorable moat despite improving ROIC trends, indicating Kadant currently maintains a stronger competitive advantage.
Stock Comparison
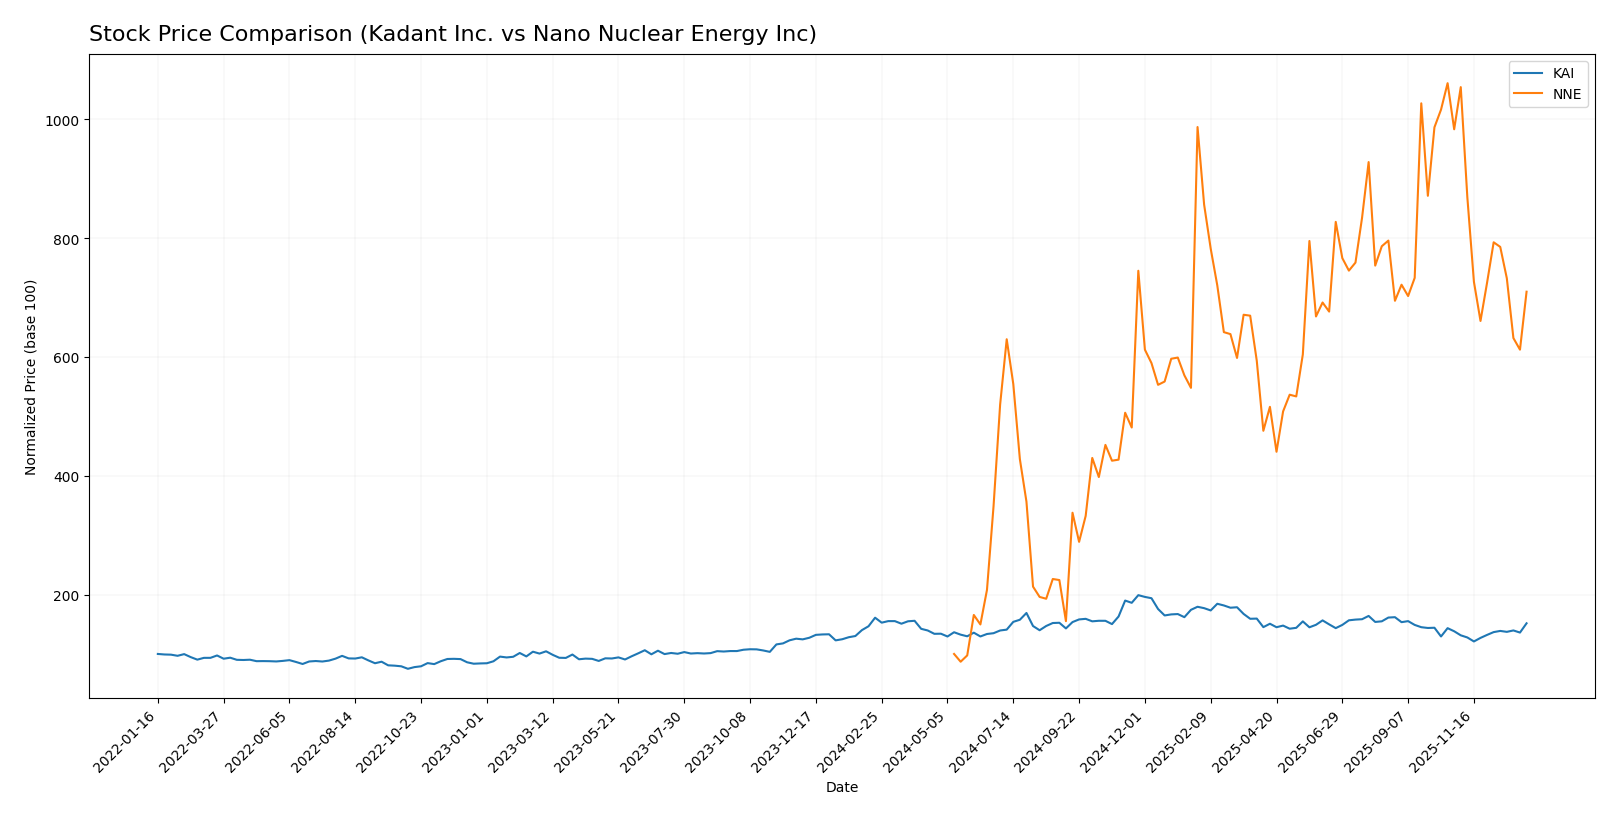
The stock price movements over the past year reveal contrasting trends between Kadant Inc. and Nano Nuclear Energy Inc., with Kadant showing a modest decline and recent recovery, while Nano Nuclear Energy experienced substantial gains followed by a sharp pullback.
Trend Analysis
Kadant Inc. (KAI) exhibited a bearish trend over the past 12 months with a -5.86% price change and accelerating decline, hitting a high of 419.01 and a low of 254.91. Recent months show a 9.69% rebound.
Nano Nuclear Energy Inc. (NNE) showed a strong bullish trend over the past year with a 609.76% increase, though with decelerating momentum. Its recent trend reversed sharply with a -27.81% drop.
Comparing both, Nano Nuclear Energy delivered the highest market performance over the last 12 months despite recent volatility, outperforming Kadant’s overall decline.
Target Prices
The current analyst target consensus provides a clear outlook for the two companies under review.
| Company | Target High | Target Low | Consensus |
|---|---|---|---|
| Kadant Inc. | 410 | 275 | 342.5 |
| Nano Nuclear Energy Inc | 50 | 50 | 50 |
Analysts expect Kadant Inc.’s stock to trade moderately above its current price of 319.22 USD, reflecting confidence in its industrial machinery operations. Nano Nuclear Energy’s target price at 50 USD suggests potential upside from its current price of 32.01 USD, though with higher volatility risk.
Analyst Opinions Comparison
This section compares analysts’ ratings and grades for Kadant Inc. and Nano Nuclear Energy Inc.:
Rating Comparison
Kadant Inc. Rating
- Rating: B, indicating a very favorable outlook.
- Discounted Cash Flow Score: 3, moderate valuation.
- ROE Score: 3, moderate efficiency in equity use.
- ROA Score: 4, favorable asset utilization.
- Debt To Equity Score: 3, moderate financial risk.
- Overall Score: 3, moderate overall financial health.
Nano Nuclear Energy Inc Rating
- Rating: C, also noted as very favorable despite lower scores.
- Discounted Cash Flow Score: 2, moderate valuation.
- ROE Score: 1, very unfavorable equity efficiency.
- ROA Score: 1, very unfavorable asset utilization.
- Debt To Equity Score: 5, very favorable financial risk profile.
- Overall Score: 2, moderate overall financial health.
Which one is the best rated?
Kadant Inc. is better rated overall with a B rating and stronger scores in return on equity and assets, while Nano Nuclear Energy Inc. has a lower C rating and weaker profitability metrics despite a favorable debt to equity score.
Scores Comparison
Here is a comparison of Kadant Inc. and Nano Nuclear Energy Inc. scores:
Kadant Inc. Scores
- Altman Z-Score: 5.59, indicating a safe zone with low bankruptcy risk.
- Piotroski Score: 7, categorized as strong financial health.
Nano Nuclear Energy Inc Scores
- Altman Z-Score: 143.56, well within the safe zone, indicating very low bankruptcy risk.
- Piotroski Score: 2, classified as very weak financial health.
Which company has the best scores?
Based solely on the data, Nano Nuclear Energy Inc. has a much higher Altman Z-Score, indicating very low bankruptcy risk. Kadant Inc. shows a stronger Piotroski Score, reflecting better financial strength. The scores suggest strengths in different areas for each company.
Grades Comparison
Here is the comparison of recent grades and ratings for Kadant Inc. and Nano Nuclear Energy Inc.:
Kadant Inc. Grades
The table below summarizes the most recent grades from reliable grading companies for Kadant Inc.:
| Grading Company | Action | New Grade | Date |
|---|---|---|---|
| Barrington Research | Maintain | Outperform | 2025-10-30 |
| Barrington Research | Maintain | Outperform | 2025-10-29 |
| Barrington Research | Maintain | Outperform | 2025-10-27 |
| Barrington Research | Maintain | Outperform | 2025-10-10 |
| Barrington Research | Maintain | Outperform | 2025-09-23 |
| DA Davidson | Maintain | Neutral | 2025-08-04 |
| Barrington Research | Maintain | Outperform | 2025-07-30 |
| Barrington Research | Maintain | Outperform | 2025-07-29 |
| Barrington Research | Maintain | Outperform | 2025-05-01 |
| DA Davidson | Maintain | Neutral | 2025-05-01 |
Kadant’s grades predominantly show a consistent “Outperform” rating from Barrington Research, with DA Davidson maintaining a “Neutral” stance.
Nano Nuclear Energy Inc. Grades
The following table presents recent grades from reliable grading companies for Nano Nuclear Energy Inc.:
| Grading Company | Action | New Grade | Date |
|---|---|---|---|
| HC Wainwright & Co. | Maintain | Buy | 2025-08-19 |
| Ladenburg Thalmann | Downgrade | Sell | 2025-08-18 |
| HC Wainwright & Co. | Maintain | Buy | 2025-08-15 |
| HC Wainwright & Co. | Maintain | Buy | 2025-03-31 |
| HC Wainwright & Co. | Maintain | Buy | 2025-01-29 |
| HC Wainwright & Co. | Maintain | Buy | 2024-11-27 |
| Benchmark | Maintain | Buy | 2024-11-07 |
| Benchmark | Maintain | Buy | 2024-07-15 |
| Benchmark | Maintain | Buy | 2024-06-25 |
Nano Nuclear Energy’s grades are mostly “Buy” recommendations, but Ladenburg Thalmann issued a recent downgrade to “Sell,” indicating some divergence among analysts.
Which company has the best grades?
Nano Nuclear Energy Inc. has a majority of “Buy” ratings, though with a notable recent downgrade, while Kadant Inc. shows a strong and consistent “Outperform” trend with some neutral views. Investors may interpret Kadant’s steady outperform grades as stable confidence, whereas Nano Nuclear’s mixed signals reflect a more varied analyst outlook.
Strengths and Weaknesses
Below is a comparative overview of Kadant Inc. (KAI) and Nano Nuclear Energy Inc. (NNE) highlighting their key strengths and weaknesses based on diversification, profitability, innovation, global presence, and market share.
| Criterion | Kadant Inc. (KAI) | Nano Nuclear Energy Inc. (NNE) |
|---|---|---|
| Diversification | Moderate – strong focus on parts and consumables, some capital equipment | Limited – emerging company with narrow product range |
| Profitability | Favorable – positive net margin (10.59%), ROIC (10.08%) above WACC (9.23%) | Unfavorable – negative net margin (0%), ROIC (-20.51%) below high WACC (14.46%) |
| Innovation | Steady growth in ROIC indicating improving efficiency and profitability | Growing ROIC trend but still destroying value, indicating early-stage innovation challenges |
| Global presence | Established with diversified customer base in papermaking and fiber products | Small or limited global footprint due to nascent stage |
| Market Share | Solid in niche market segments, steady revenue growth in parts and capital segments | Small market share; still building presence and recognition |
Kadant demonstrates moderate diversification and steady profitability with a favorable financial profile, reflecting operational efficiency and market stability. Nano Nuclear Energy shows promising ROIC growth but remains unprofitable and value-destructive at present, signaling higher risk and a need for cautious evaluation before investment.
Risk Analysis
Below is a comparison table highlighting key risk factors for Kadant Inc. (KAI) and Nano Nuclear Energy Inc. (NNE) based on the most recent data from 2024-2025.
| Metric | Kadant Inc. (KAI) | Nano Nuclear Energy Inc (NNE) |
|---|---|---|
| Market Risk | Moderate (Beta 1.25) | High (Beta 7.49) |
| Debt level | Low (Debt-to-Equity 0.38, 22.57%) | Very Low (Debt-to-Equity 0.01, 1.22%) |
| Regulatory Risk | Moderate industrial regulations | High nuclear energy regulation risk |
| Operational Risk | Established operations, moderate | High, early-stage tech, small team (5 employees) |
| Environmental Risk | Moderate, industrial footprint | Potentially high due to nuclear operations |
| Geopolitical Risk | Moderate, US-based manufacturing | High, nuclear sector sensitive to policy |
Kadant (KAI) shows manageable market and debt risks with stable operations, but moderate exposure to regulations and industrial environmental impact. Nano Nuclear (NNE) carries significant market volatility and operational risks due to its early-stage nuclear technology and regulatory hurdles, despite low debt. The most impactful risks for NNE are regulatory and operational, while KAI’s greatest concerns lie in market fluctuations and environmental compliance.
Which Stock to Choose?
Kadant Inc. (KAI) shows a favorable income evolution with revenue growth of 9.99% in 2024 and an overall 65.88% increase over five years. Financial ratios are mostly favorable, including a strong current ratio (2.31) and low debt-to-assets (22.57%). Profitability metrics like net margin (10.59%) and ROIC (10.08%) are positive, though valuation ratios such as P/E (36.9) are less attractive. The company carries moderate debt (net debt to EBITDA 1.02) and holds a very favorable B rating.
Nano Nuclear Energy Inc (NNE) reveals an unfavorable income statement with zero net margin and declining net income over the period. Financial ratios indicate weak profitability, with negative ROE (-18.0%) and ROIC (-20.51%), despite very low debt levels (debt-to-assets 1.22%). The current ratio is abnormally high (53.48), signaling potential operational issues. The firm’s rating is C but shows very unfavorable scores on profitability and valuation metrics.
Investors focused on quality and consistent profitability may find Kadant’s stable income growth, solid financial ratios, and favorable rating more aligned with their profile. Conversely, those with a high risk tolerance or a growth-oriented strategy might interpret Nano Nuclear Energy’s rapid stock price increase and improving ROIC trend as signals of potential upside, despite its current unfavorable financials.
Disclaimer: Investment carries a risk of loss of initial capital. The past performance is not a reliable indicator of future results. Be sure to understand risks before making an investment decision.
Go Further
I encourage you to read the complete analyses of Kadant Inc. and Nano Nuclear Energy Inc to enhance your investment decisions: