Kadant Inc. and Columbus McKinnon Corporation are two prominent players in the industrial machinery sector, each specializing in innovative material handling and processing solutions. Kadant focuses on fluid control and industrial processing technologies, while Columbus McKinnon excels in intelligent motion and lifting systems. Their overlapping markets and commitment to innovation make them ideal candidates for comparison. In this article, I will help you decide which company offers the most compelling investment opportunity.
Table of contents
Companies Overview
I will begin the comparison between Kadant Inc. and Columbus McKinnon Corporation by providing an overview of these two companies and their main differences.
Kadant Inc. Overview
Kadant Inc. operates globally supplying technologies and engineered systems in the industrial machinery sector. Its business is divided into three segments: Flow Control, Industrial Processing, and Material Handling. Kadant develops fluid-handling systems, industrial automation, recycling equipment, and biodegradable absorbent granules. Founded in 1991 and headquartered in Westford, Massachusetts, the company employs about 3,500 people and is listed on the NYSE with a market cap of approximately 3.37B USD.
Columbus McKinnon Corporation Overview
Columbus McKinnon Corporation designs and manufactures intelligent motion solutions primarily for material handling in agricultural machinery and other industries. Its product range includes hoists, cranes, rigging equipment, actuators, and power and motion technology products. Founded in 1875 and based in Buffalo, New York, the company serves diverse market verticals with about 3,515 employees. It trades on NASDAQ with a market cap of roughly 494M USD.
Key similarities and differences
Both companies operate in the industrial sector with a focus on machinery and engineered systems, employing around 3,500 staff each. Kadant emphasizes fluid-handling and industrial processing technologies, while Columbus McKinnon specializes in motion solutions and material handling equipment. Kadant’s market cap is significantly larger, reflecting its broader product segmentation versus Columbus McKinnon’s concentrated focus on lifting and positioning systems.
Income Statement Comparison
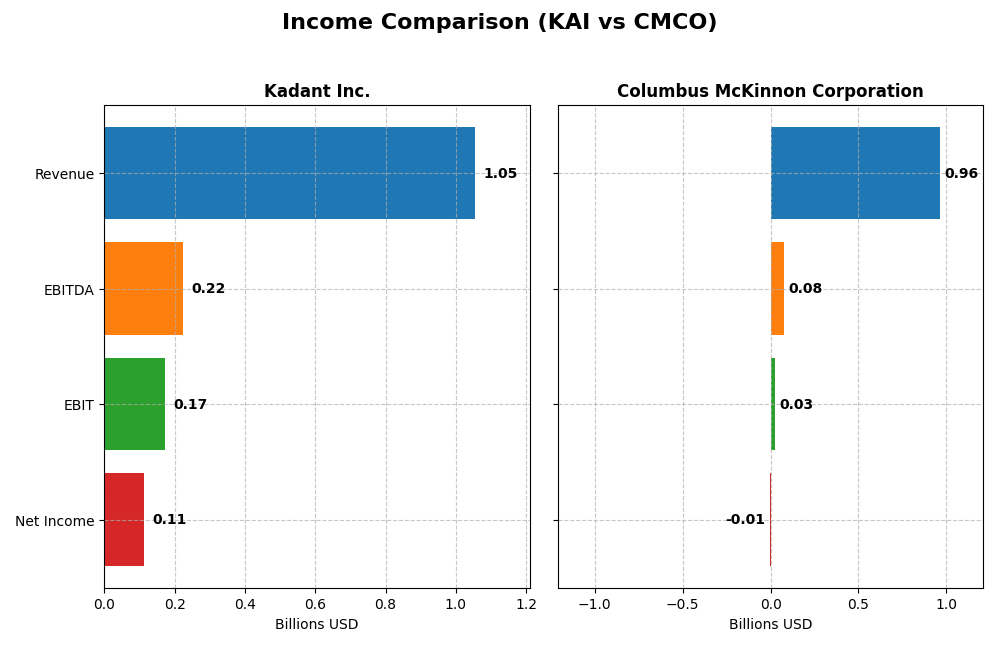
This table presents a side-by-side comparison of key income statement metrics for Kadant Inc. and Columbus McKinnon Corporation for their most recent fiscal year.
| Metric | Kadant Inc. (KAI) | Columbus McKinnon Corporation (CMCO) |
|---|---|---|
| Market Cap | 3.37B | 494M |
| Revenue | 1.05B | 963M |
| EBITDA | 223M | 75.1M |
| EBIT | 173M | 26.9M |
| Net Income | 112M | -5.14M |
| EPS | 9.51 | -0.18 |
| Fiscal Year | 2024 | 2024 |
Income Statement Interpretations
Kadant Inc.
Kadant Inc. has shown consistent revenue growth from 635M in 2020 to over 1.05B in 2024, with net income doubling from 55M to 112M in the same period. Margins have remained favorable, with gross margin at 44.25% and net margin improving overall despite a slight decline in the latest year. The 2024 performance saw revenue and gross profit growth near 10-12%, while net margin and EPS declined slightly.
Columbus McKinnon Corporation
Columbus McKinnon’s revenue increased from 650M in 2020 to 963M in 2024 but declined by nearly 5% in the last year. Net income deteriorated significantly, ending with a loss of 5M in 2024 after earlier profits. Margins weakened with net margin turning negative and EBIT margin remaining low. The latest year showed steep declines in EBIT (-73%) and EPS (-111%), signaling operational challenges.
Which one has the stronger fundamentals?
Kadant Inc. exhibits stronger fundamentals with sustained revenue and net income growth, favorable margins, and a positive overall income statement evaluation. Columbus McKinnon faces declining profits, negative net margins, and unfavorable growth metrics, reflecting weaker income statement health over the period and recent year. The contrast highlights Kadant’s more resilient profitability and margin stability.
Financial Ratios Comparison
The table below presents key financial ratios for Kadant Inc. (KAI) and Columbus McKinnon Corporation (CMCO) based on their most recent fiscal year data, facilitating a direct comparison.
| Ratios | Kadant Inc. (KAI) 2024 | Columbus McKinnon Corp. (CMCO) 2024 |
|---|---|---|
| ROE | 13.17% | -0.58% |
| ROIC | 10.08% | 3.30% |
| P/E | 36.9 | -94.7 |
| P/B | 4.86 | 0.55 |
| Current Ratio | 2.31 | 1.81 |
| Quick Ratio | 1.55 | 1.04 |
| D/E (Debt-to-Equity) | 0.38 | 0.61 |
| Debt-to-Assets | 22.57% | 31.09% |
| Interest Coverage | 8.55 | 1.68 |
| Asset Turnover | 0.74 | 0.55 |
| Fixed Asset Turnover | 6.18 | 9.07 |
| Payout ratio | 13.1% | -156.5% |
| Dividend yield | 0.36% | 1.65% |
Interpretation of the Ratios
Kadant Inc.
Kadant Inc. shows a generally favorable financial profile with strong liquidity ratios (current ratio 2.31, quick ratio 1.55) and sound leverage metrics (debt to equity 0.38, interest coverage 8.64). Profitability ratios such as net margin (10.59%) and ROIC (10.08%) are positive, though valuation multiples like P/E (36.9) and P/B (4.86) are less attractive. The company pays dividends, but with a modest yield of 0.36%, indicating cautious shareholder returns.
Columbus McKinnon Corporation
Columbus McKinnon exhibits weaker profitability with negative net margin (-0.53%) and ROE (-0.58%), despite favorable liquidity (current ratio 1.81) and valuation multiples (P/B 0.55). Interest coverage is notably low at 0.83, signaling potential risk from debt servicing. The dividend yield is moderate at 1.65%, but the company’s financial health reflects some challenges, with a slightly favorable overall ratio assessment.
Which one has the best ratios?
Kadant Inc. presents a more favorable set of financial ratios overall, with stronger profitability, better liquidity, and manageable leverage. Columbus McKinnon’s ratios signal operational and profitability difficulties, despite some strong valuation and liquidity measures. Thus, Kadant’s ratios appear more balanced and robust compared to Columbus McKinnon’s slightly favorable but riskier profile.
Strategic Positioning
This section compares the strategic positioning of Kadant Inc. and Columbus McKinnon Corporation, focusing on Market position, Key segments, and Exposure to technological disruption:
Kadant Inc.
- Mid-cap industrial machinery firm facing competitive pressure from diversified industrial sectors.
- Operates through Flow Control, Industrial Processing, and Material Handling segments, supplying engineered systems globally.
- Exposure to technological disruption is moderate, centered on industrial automation and control systems integration.
Columbus McKinnon Corporation
- Smaller market cap agricultural machinery company facing pressure from specialized industrial markets.
- Designs and markets intelligent motion solutions with diverse products including hoists, cranes, and power delivery systems.
- Faces technological disruption from advanced automation and digital power control in material handling and crane systems.
Kadant Inc. vs Columbus McKinnon Corporation Positioning
Kadant shows a diversified approach across three industrial segments with broad global reach, while Columbus McKinnon focuses on intelligent motion and material handling solutions serving varied verticals. Kadant’s segments are more product engineering-driven; Columbus McKinnon emphasizes integrated digital and mechanical systems.
Which has the best competitive advantage?
Both companies are shedding value but show growing profitability trends. Kadant’s slightly favorable moat suggests a marginally better competitive position compared to Columbus McKinnon’s slightly unfavorable moat, indicating more efficient capital use at Kadant.
Stock Comparison
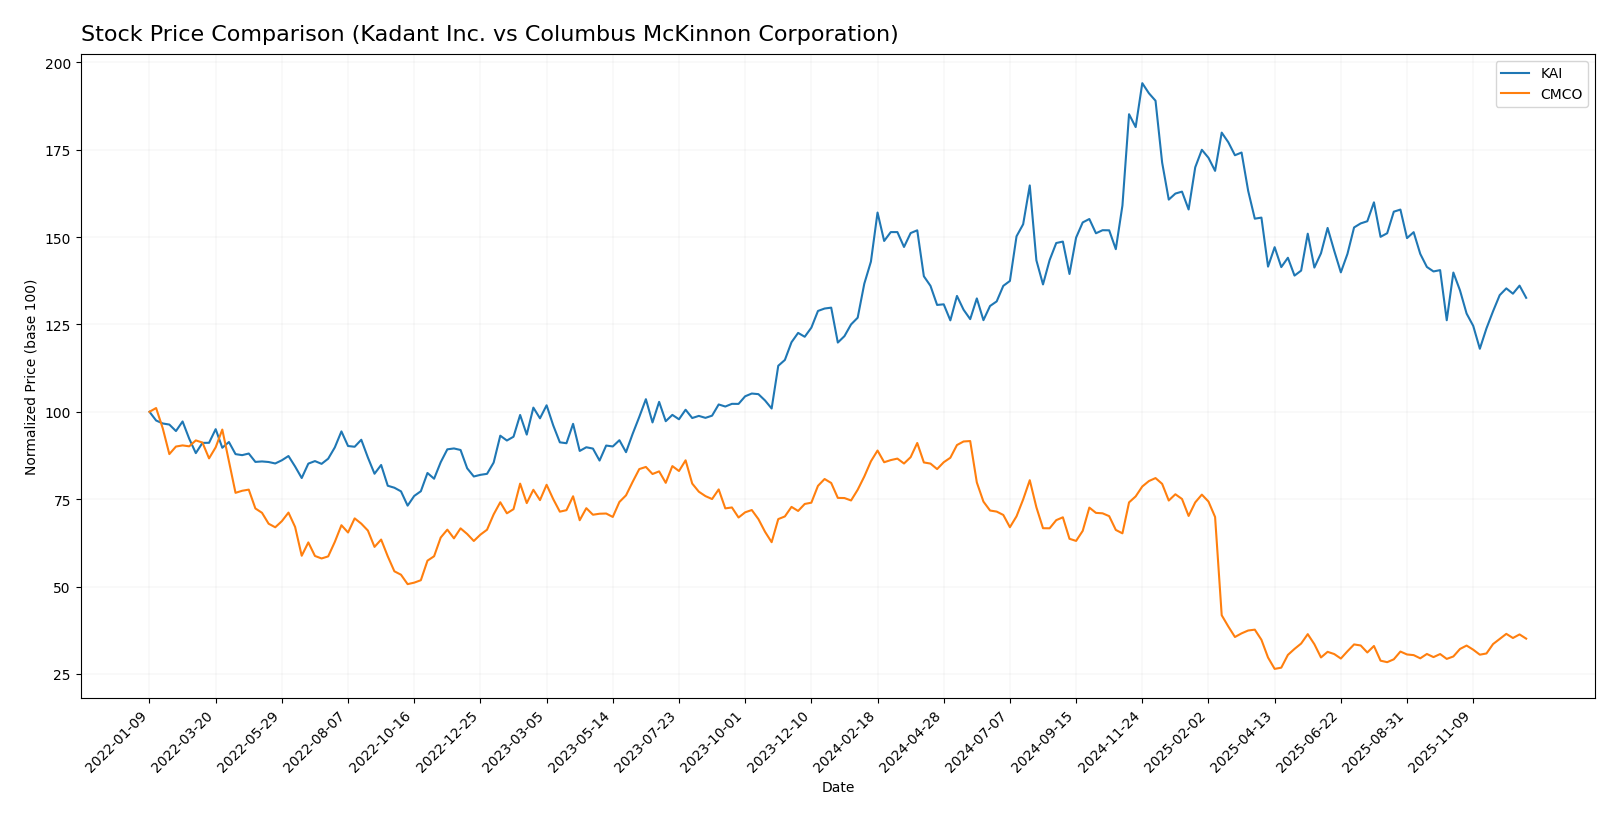
The stock price chart highlights divergent trading dynamics over the past year, with Kadant Inc. (KAI) experiencing a moderate bearish trend marked by accelerated decline, while Columbus McKinnon Corporation (CMCO) shows a steep overall bearish trend but recent positive momentum.
Trend Analysis
Kadant Inc. (KAI) recorded a 7.24% price decline over the past 12 months, confirming a bearish trend with accelerating downward momentum and significant price volatility reflected in a 34.46 standard deviation.
Columbus McKinnon Corporation (CMCO) faced a sharp 59.11% drop overall, indicating a strong bearish trend with acceleration; however, recent months show a 17.01% gain, signaling a potential recovery phase.
Comparing both, CMCO delivered the lowest market performance over the year despite recent gains, whereas KAI’s decline was less severe but consistent, reflecting differing recovery prospects and volatility profiles.
Target Prices
The current analyst consensus presents a clear range of target prices for Kadant Inc. and Columbus McKinnon Corporation.
| Company | Target High | Target Low | Consensus |
|---|---|---|---|
| Kadant Inc. | 410 | 275 | 342.5 |
| Columbus McKinnon Corporation | 50 | 48 | 49 |
Analysts expect Kadant Inc.’s stock to appreciate significantly above its current price of 286.4 USD, while Columbus McKinnon’s targets suggest modest upside from its current 17.2 USD, indicating differing growth expectations.
Analyst Opinions Comparison
This section compares analysts’ ratings and financial scores for Kadant Inc. and Columbus McKinnon Corporation:
Rating Comparison
Kadant Inc. Rating
- Rating: B+ indicating a very favorable outlook.
- Discounted Cash Flow Score: 4, favorable valuation.
- ROE Score: 3, moderate efficiency in equity use.
- ROA Score: 4, favorable asset utilization.
- Debt To Equity Score: 3, moderate financial risk.
- Overall Score: 3, moderate financial standing.
Columbus McKinnon Corporation Rating
- Rating: B indicating a very favorable outlook.
- Discounted Cash Flow Score: 5, very favorable valuation.
- ROE Score: 1, very unfavorable efficiency in equity use.
- ROA Score: 2, moderate asset utilization.
- Debt To Equity Score: 2, moderate financial risk.
- Overall Score: 3, moderate financial standing.
Which one is the best rated?
Kadant holds a higher rating (B+) with stronger ROE and ROA scores, while Columbus McKinnon excels in discounted cash flow and price-to-book metrics but suffers from weaker profitability measures. Overall, Kadant is better rated based on the provided data.
Scores Comparison
Here is a comparison of the Altman Z-Score and Piotroski Score for Kadant Inc. and Columbus McKinnon Corporation:
Kadant Inc. Scores
- Altman Z-Score: 5.59, indicating a safe zone status
- Piotroski Score: 7, classified as strong
Columbus McKinnon Corporation Scores
- Altman Z-Score: 1.40, indicating distress zone status
- Piotroski Score: 8, classified as very strong
Which company has the best scores?
Kadant Inc. has a significantly better Altman Z-Score, placing it in the safe zone, while Columbus McKinnon is in distress. However, Columbus McKinnon has a higher Piotroski Score, indicating stronger financial strength.
Grades Comparison
Here is a comparison of the latest stock grades issued by recognized grading companies for the two companies:
Kadant Inc. Grades
This table shows recent grades assigned to Kadant Inc. by reliable grading companies.
| Grading Company | Action | New Grade | Date |
|---|---|---|---|
| Barrington Research | Maintain | Outperform | 2025-10-30 |
| Barrington Research | Maintain | Outperform | 2025-10-29 |
| Barrington Research | Maintain | Outperform | 2025-10-27 |
| Barrington Research | Maintain | Outperform | 2025-10-10 |
| Barrington Research | Maintain | Outperform | 2025-09-23 |
| DA Davidson | Maintain | Neutral | 2025-08-04 |
| Barrington Research | Maintain | Outperform | 2025-07-30 |
| Barrington Research | Maintain | Outperform | 2025-07-29 |
| Barrington Research | Maintain | Outperform | 2025-05-01 |
| DA Davidson | Maintain | Neutral | 2025-05-01 |
The overall trend shows a strong and consistent Outperform rating from Barrington Research, with DA Davidson maintaining a Neutral view.
Columbus McKinnon Corporation Grades
This table shows recent grades assigned to Columbus McKinnon Corporation by reliable grading companies.
| Grading Company | Action | New Grade | Date |
|---|---|---|---|
| DA Davidson | Downgrade | Neutral | 2025-02-11 |
| DA Davidson | Maintain | Buy | 2024-02-05 |
| DA Davidson | Maintain | Buy | 2022-10-04 |
| DA Davidson | Maintain | Buy | 2022-10-03 |
| Barrington Research | Maintain | Outperform | 2022-07-29 |
| Barrington Research | Maintain | Outperform | 2022-07-28 |
| JP Morgan | Downgrade | Neutral | 2022-05-26 |
| Barrington Research | Maintain | Outperform | 2022-05-26 |
| Barrington Research | Maintain | Outperform | 2022-05-25 |
| JP Morgan | Downgrade | Neutral | 2022-05-25 |
Grades for Columbus McKinnon reflect a shift from Buy and Outperform ratings toward Neutral, indicated by recent downgrades from DA Davidson and JP Morgan.
Which company has the best grades?
Kadant Inc. holds more recent and consistently positive grades, predominantly Outperform, compared to Columbus McKinnon’s trend toward Neutral ratings. This suggests Kadant’s stock is viewed more favorably by analysts, potentially indicating stronger confidence in its prospects.
Strengths and Weaknesses
Below is a comparison of key strengths and weaknesses for Kadant Inc. (KAI) and Columbus McKinnon Corporation (CMCO) based on recent financial and operational data.
| Criterion | Kadant Inc. (KAI) | Columbus McKinnon Corporation (CMCO) |
|---|---|---|
| Diversification | Moderate: Focus on capital and parts/consumables segments | High: Diverse product range including hoists, conveyors, cranes, and digital controls |
| Profitability | Favorable net margin (10.59%) and ROIC (10.08%) | Unfavorable net margin (-0.53%) and low ROIC (3.3%) |
| Innovation | Growing ROIC trend indicates improving efficiency and innovation | Growing ROIC trend but currently destroying value, innovation impact limited |
| Global presence | Solid with increasing parts and consumables revenue globally | Strong global footprint with broad industrial product lines |
| Market Share | Strong in papermaking systems and consumables | Significant share in hoists and precision conveyor markets |
Key takeaways: Kadant Inc. demonstrates solid profitability with a focused product portfolio and improving returns, suggesting efficient capital use. Columbus McKinnon shows broader diversification but struggles with profitability, though its growing ROIC trend hints at potential recovery. Investors should weigh Kadant’s stable profitability against Columbus McKinnon’s growth potential and current risk.
Risk Analysis
Below is a comparative risk assessment table for Kadant Inc. (KAI) and Columbus McKinnon Corporation (CMCO) based on the most recent data from 2024:
| Metric | Kadant Inc. (KAI) | Columbus McKinnon Corp. (CMCO) |
|---|---|---|
| Market Risk | Beta 1.26, moderate volatility | Beta 1.29, slightly higher volatility |
| Debt level | Low debt-to-assets 22.57% (favorable) | Moderate debt-to-assets 31.09% (neutral) |
| Regulatory Risk | Moderate, industrial sector | Moderate, industrial sector |
| Operational Risk | Favorable operational efficiency | Operational challenges with negative net margin |
| Environmental Risk | Moderate, industrial processing | Moderate, manufacturing impact |
| Geopolitical Risk | US-based, limited exposure | US-based, limited exposure |
Kadant (KAI) presents lower financial risk due to its strong balance sheet and favorable debt metrics, while Columbus McKinnon (CMCO) faces higher operational and financial stress with a negative net margin and distress-zone Altman Z-score, signaling elevated bankruptcy risk. Market volatility is similar for both.
Which Stock to Choose?
Kadant Inc. (KAI) shows favorable income growth over 2020-2024 with a 65.9% revenue increase and 102.2% net income growth. Its financial ratios are mostly favorable, including a 10.6% net margin and solid liquidity. Debt levels and interest coverage are also positive, supported by a B+ rating and a slightly favorable moat due to growing ROIC.
Columbus McKinnon Corporation (CMCO) experienced an unfavorable income trend with declining net income and margins despite 48.2% revenue growth over the period. Its financial ratios reveal weaknesses in profitability and coverage, with a high net debt to EBITDA ratio and mixed rating components. The company has a B rating and a slightly unfavorable moat despite improving ROIC.
For risk-averse or quality-focused investors, KAI’s stronger profitability, financial stability, and very favorable rating might appear more attractive, while risk-tolerant or value-seeking investors could see potential in CMCO’s improving ROIC and favorable valuation metrics despite current challenges.
Disclaimer: Investment carries a risk of loss of initial capital. The past performance is not a reliable indicator of future results. Be sure to understand risks before making an investment decision.
Go Further
I encourage you to read the complete analyses of Kadant Inc. and Columbus McKinnon Corporation to enhance your investment decisions: