Home > Comparison > Financial Services > JPM vs WFC
The strategic rivalry between JPMorgan Chase & Co. and Wells Fargo & Company shapes the landscape of diversified banking. JPMorgan operates a broad, integrated financial services model, balancing investment banking with wealth management. Wells Fargo emphasizes consumer and commercial banking with a focus on retail lending. This analysis pits JPMorgan’s scale and innovation against Wells Fargo’s traditional banking strengths, aiming to identify which offers superior risk-adjusted returns for a balanced portfolio.

Table of contents
Companies Overview
JPMorgan Chase & Co. and Wells Fargo & Company are two pillars of the diversified banking sector in the US.
JPMorgan Chase & Co.: Global Financial Powerhouse
JPMorgan Chase dominates as a financial services giant with a market cap of 833B. Its core revenue stems from four segments: consumer banking, corporate and investment banking, commercial banking, and asset & wealth management. In 2026, JPMorgan’s strategic focus centers on expanding digital banking and enhancing cross-border financing solutions, reinforcing its competitive advantage in global financial integration.
Wells Fargo & Company: Diversified Banking Leader
Wells Fargo excels as a diversified financial services provider valued at 284B. It generates revenue from consumer banking and lending, commercial banking, corporate and investment banking, and wealth management. The firm’s 2026 strategy emphasizes strengthening consumer banking products and boosting personalized wealth management services, carving out a distinctive market position focused on retail and affluent clients.
Strategic Collision: Similarities & Divergences
Both banks operate diversified models but differ in strategic emphasis: JPMorgan pursues a global, technology-driven approach, while Wells Fargo prioritizes consumer-centric, relationship-driven banking. Their primary battleground is retail and commercial lending, where digital innovation meets traditional service. These contrasts define their unique investment profiles—JPMorgan as a global growth engine, Wells Fargo as a retail-focused financial stalwart.
Income Statement Comparison
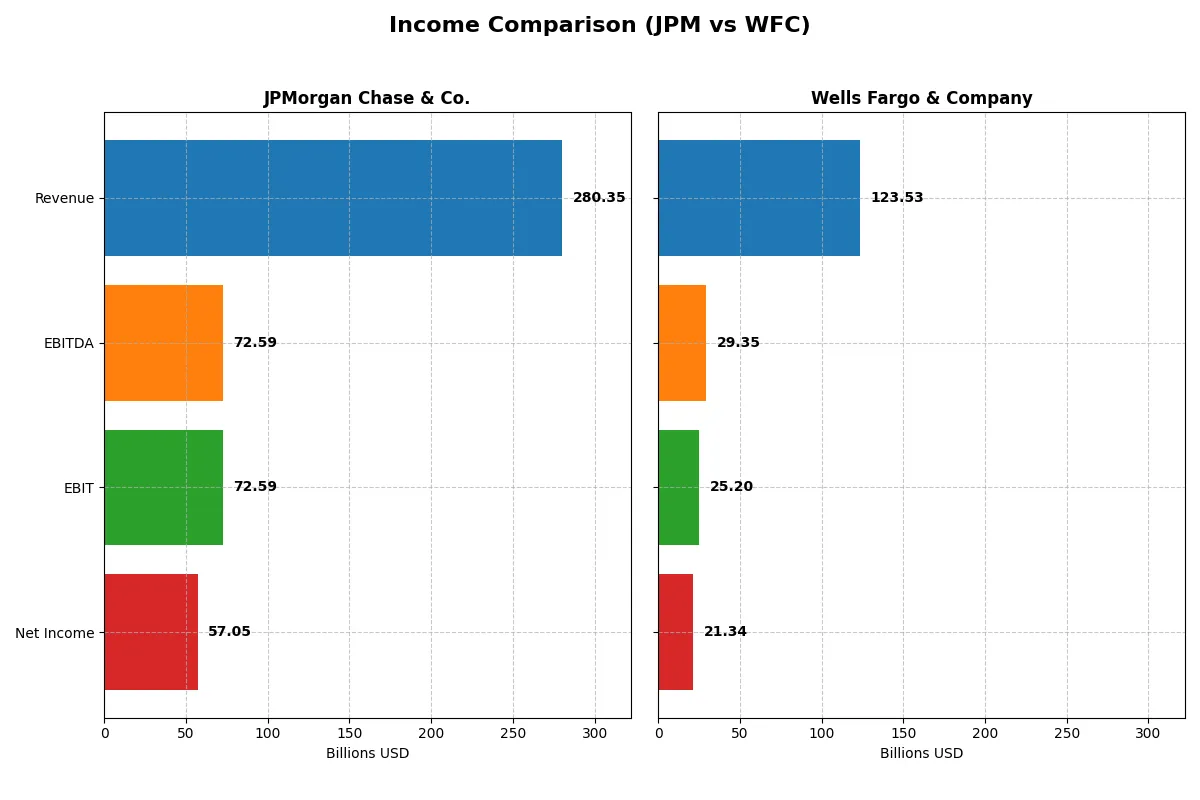
This data dissects the core profitability and scalability of both corporate engines to reveal who dominates the bottom line:
| Metric | JPMorgan Chase & Co. (JPM) | Wells Fargo & Company (WFC) |
|---|---|---|
| Revenue | 280.3B | 123.5B |
| Cost of Revenue | 112.1B | 43.5B |
| Operating Expenses | 95.6B | 54.8B |
| Gross Profit | 168.2B | 80.0B |
| EBITDA | 72.6B | 29.3B |
| EBIT | 72.6B | 25.2B |
| Interest Expense | 97.9B | 39.8B |
| Net Income | 57.0B | 21.3B |
| EPS | 20.09 | 6.39 |
| Fiscal Year | 2025 | 2025 |
Income Statement Analysis: The Bottom-Line Duel
This income statement comparison reveals how efficiently JPMorgan Chase and Wells Fargo convert revenue into profits and sustain margin strength.
JPMorgan Chase & Co. Analysis
JPMorgan’s revenue grew steadily from 127B in 2021 to 280B in 2025, with net income rising from 46.5B to 56B. Gross margins remain strong at 60%, while net margins hold firm near 20%. Despite slight EBIT and net margin declines in 2025, JPMorgan sustains impressive scale and solid profitability momentum.
Wells Fargo & Company Analysis
Wells Fargo’s revenue expanded from 83B in 2021 to 124B in 2024 but dipped to 123B in 2025. Net income peaked near 22B in 2021 and declined to 20.5B by 2025. Its gross margin exceeds JPMorgan at 64.8%, yet net margin trails at 17.3%. Wells Fargo shows improving EBIT and net margin growth in 2025, reflecting enhanced operational efficiency.
Margin Strength vs. Revenue Momentum
JPMorgan leads in revenue scale and net income growth, delivering stable margins despite recent margin compression. Wells Fargo boasts higher gross margins and improving profitability ratios but lags in revenue growth and absolute net income. For investors, JPMorgan’s robust scale and consistent earnings growth offer a more compelling fundamental profile.
Financial Ratios Comparison
These vital ratios act as a diagnostic tool to expose the underlying fiscal health, valuation premiums, and capital efficiency of the companies compared below:
| Ratios | JPMorgan Chase & Co. (JPM) | Wells Fargo & Company (WFC) |
|---|---|---|
| ROE | 15.7% | 11.8% |
| ROIC | 1.29% | 6.47% |
| P/E | 15.75 | 13.89 |
| P/B | 2.48 | 1.64 |
| Current Ratio | 14.85 | 13.79 |
| Quick Ratio | 14.85 | 13.79 |
| D/E | 1.38 | 1.07 |
| Debt-to-Assets | 11.3% | 9.0% |
| Interest Coverage | 0.74 | 0.63 |
| Asset Turnover | 0.063 | 0.057 |
| Fixed Asset Turnover | 7.73 | 10.84 |
| Payout Ratio | 27.1% | 25.3% |
| Dividend Yield | 1.72% | 1.82% |
| Fiscal Year | 2025 | 2025 |
Efficiency & Valuation Duel: The Vital Signs
Financial ratios act as a company’s DNA, exposing operational strengths and hidden risks crucial for investor decisions.
JPMorgan Chase & Co.
JPMorgan delivers a robust 15.74% ROE and a strong 20.35% net margin, signaling solid profitability. The P/E ratio at 15.75 suggests a fairly valued stock, neither cheap nor stretched. Dividend yield stands at a moderate 1.72%, balancing shareholder returns with reinvestment in growth. However, its high current ratio (14.85) signals an unusual liquidity profile.
Wells Fargo & Company
Wells Fargo shows a respectable 11.78% ROE and a 17.27% net margin, indicating decent profitability. The P/E ratio of 13.89 marks it as slightly undervalued compared to JPM. Dividend yield is marginally higher at 1.82%, maintaining shareholder income while preserving capital for operational efficiency. The current ratio of 13.79 also raises questions about short-term asset management.
Balanced Valuation Meets Operational Nuance
JPMorgan offers stronger profitability but trades at a neutral valuation, while Wells Fargo presents a more attractive P/E with slightly weaker returns. JPM’s profile suits investors prioritizing earnings power, whereas Wells Fargo appeals to those seeking value with steady dividends.
Which one offers the Superior Shareholder Reward?
I compare JPMorgan Chase & Co. (JPM) and Wells Fargo & Company (WFC) on shareholder rewards through dividends and buybacks. JPM yields 1.72% with a 27% payout ratio and steady buybacks totaling $5.55/share in dividends for 2025. WFC offers a similar yield at 1.82%, paying out 25% of earnings and $1.70/share dividends in 2025, but with weaker buyback activity. JPM’s payout is more conservative yet well-covered by free cash flow, supporting sustainable returns. WFC’s higher leverage and lower cash cushions raise risk on dividends and buybacks. JPM’s balanced dividend and aggressive buyback approach delivers superior long-term shareholder value in 2026.
Comparative Score Analysis: The Strategic Profile
The radar chart reveals the fundamental DNA and financial trade-offs of JPMorgan Chase & Co. and Wells Fargo & Company:
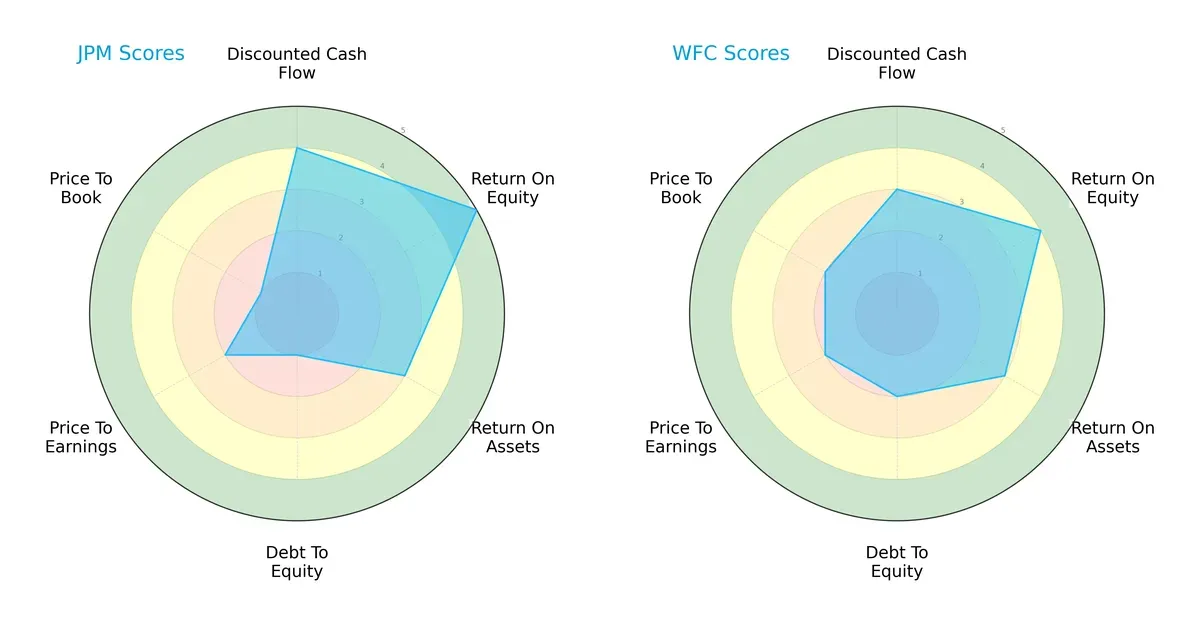
JPM leads with a stronger ROE (5 vs. 4) and DCF score (4 vs. 3), showcasing superior profitability and cash flow valuation. Wells Fargo shows a more balanced debt-to-equity profile (2 vs. 1), implying less financial risk. Both firms score moderately on overall and ROA metrics. JPM relies heavily on high returns but carries significant leverage risks compared to Wells Fargo’s steadier capital structure.
Bankruptcy Risk: Solvency Showdown
Both JPM and Wells Fargo fall in the distress zone with Altman Z-Scores below 1.8, signaling elevated bankruptcy risk in this cycle:
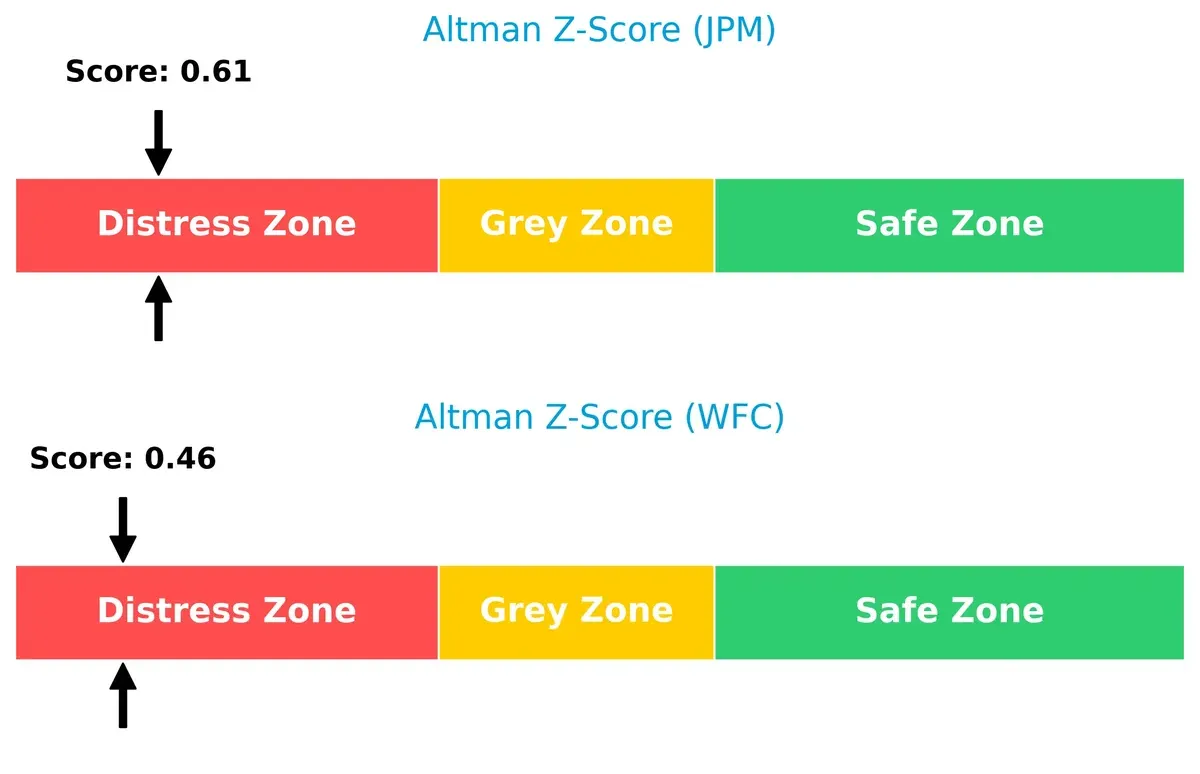
JPM’s score of 0.61 slightly outperforms Wells Fargo’s 0.46 but neither offers comfort for long-term solvency. This suggests both banks face critical financial stress amid current market conditions.
Financial Health: Quality of Operations
JPM and Wells Fargo exhibit average Piotroski F-Scores of 4 and 5 respectively, indicating moderate operational health without clear red flags:
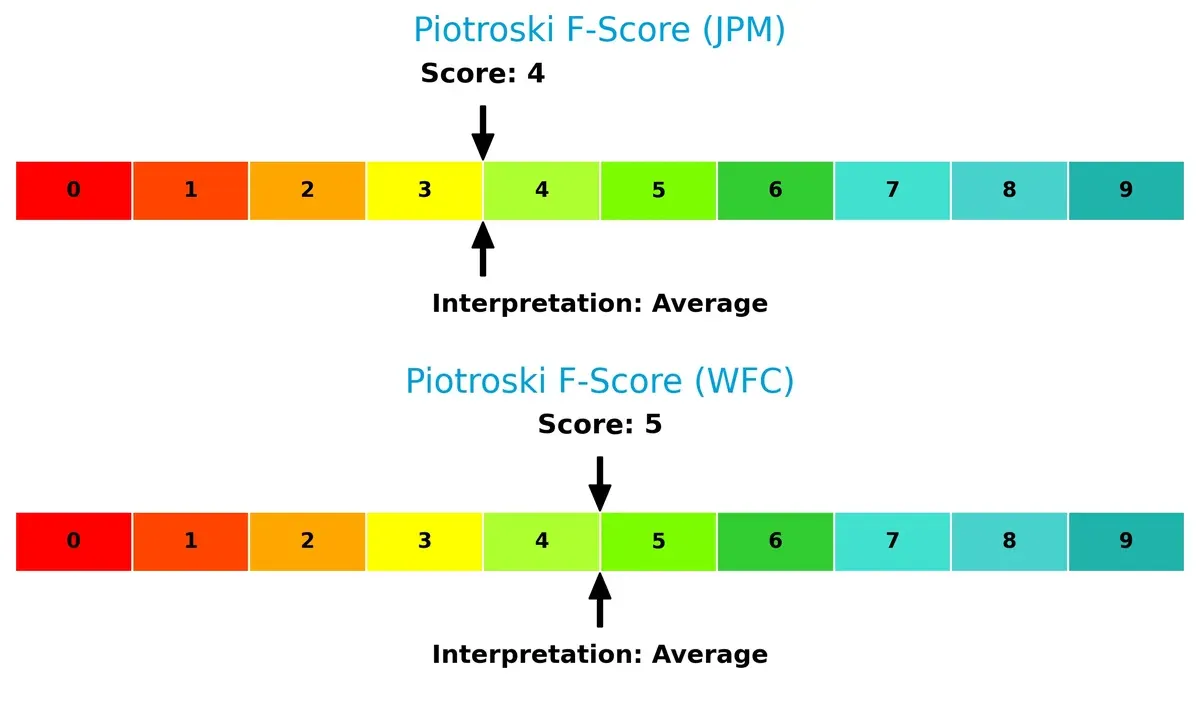
Neither company demonstrates strong internal financial robustness. Wells Fargo’s marginally higher score hints at slightly better profitability and efficiency, but both remain vulnerable to operational headwinds. Investors should monitor these metrics closely.
How are the two companies positioned?
This section dissects JPMorgan Chase & Co. and Wells Fargo’s operational DNA by comparing revenue distribution and internal strengths and weaknesses. It confronts their economic moats to reveal which model offers the most resilient, sustainable competitive advantage today.
Revenue Segmentation: The Strategic Mix
This comparison dissects how JPMorgan Chase & Co. and Wells Fargo diversify income streams and highlights their primary sector bets:
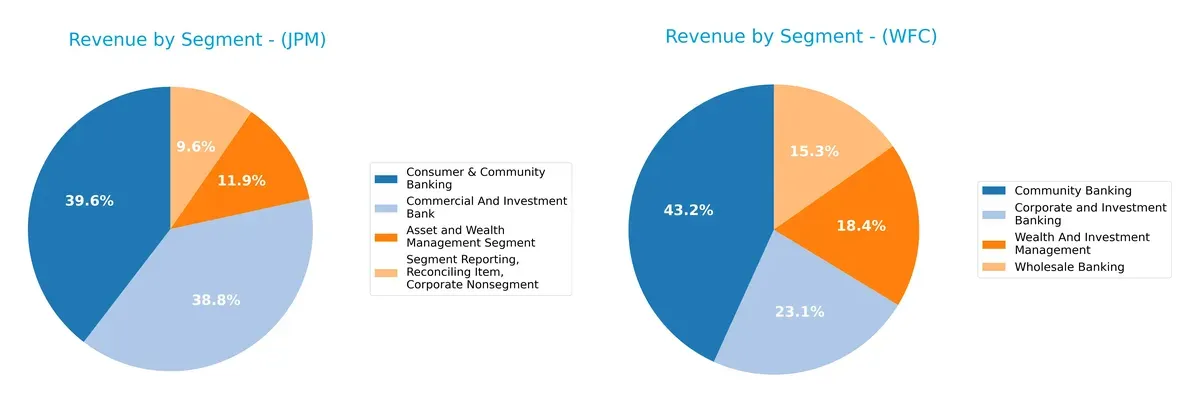
JPMorgan Chase anchors revenue heavily in Consumer & Community Banking ($71.5B) and Corporate & Investment Bank ($70.1B), showing a balanced but concentrated approach. Wells Fargo leans more on Community Banking ($36.2B) but displays a diversified mix with Corporate & Investment Banking ($19.3B) and Wealth & Investment Management ($15.4B). JPMorgan’s scale in key segments dwarfs Wells Fargo, indicating stronger ecosystem lock-in but also higher concentration risk.
Strengths and Weaknesses Comparison
This table compares the Strengths and Weaknesses of JPMorgan Chase & Co. and Wells Fargo & Company:
JPMorgan Chase & Co. Strengths
- Strong diversification across Consumer, Corporate & Investment Banking, and Wealth Management
- High net margin at 20.35%
- Favorable ROE of 15.74%
- Low debt to assets at 11.3%
- High fixed asset turnover at 7.73
- Solid global presence with $139B revenue from North America alone
Wells Fargo & Company Strengths
- Diversified revenue in Community Banking, Wholesale, Corporate and Wealth Management
- Favorable net margin at 17.27%
- Neutral ROIC at 6.47% above WACC
- Favorable P/E of 13.89
- Low debt to assets at 8.98%
- Higher fixed asset turnover at 10.84
JPMorgan Chase & Co. Weaknesses
- Unfavorable ROIC below WACC (1.29% vs 11.34%)
- Unfavorable current ratio at 14.85, signaling liquidity concerns
- Debt to equity at 1.38 higher than WFC
- Low interest coverage ratio at 0.74
- Low asset turnover at 0.06
- Slightly unfavorable overall ratio profile
Wells Fargo & Company Weaknesses
- Unfavorable WACC at 12.27% exceeding ROIC
- Unfavorable current ratio at 13.79
- Debt to equity at 1.07 still elevated
- Low interest coverage ratio at 0.63
- Low asset turnover at 0.06
- Neutral overall ratio profile
JPMorgan demonstrates stronger profitability and global revenue diversification but faces challenges in capital efficiency and liquidity. Wells Fargo shows more balanced capital returns relative to cost but has weaker profitability metrics. Both must address asset efficiency and interest coverage to improve financial resilience.
The Moat Duel: Analyzing Competitive Defensibility
A structural moat is the only true shield protecting a firm’s long-term profits from relentless competitive erosion:
JPMorgan Chase & Co.: Scale and Diversification Moat
JPMorgan leverages vast scale and diversification, driving margin stability and a 20%+ net margin. However, declining ROIC signals pressure. Expansion in Asia-Pacific could deepen its moat in 2026.
Wells Fargo & Company: Improving Profitability Amid Legacy Challenges
Wells Fargo relies on cost advantage and operational efficiency, showing improving ROIC trends despite shedding value. Its narrower geographic footprint contrasts with JPM’s global reach but offers focused growth potential.
Scale and Efficiency: Which Bank Builds the Stronger Moat?
JPMorgan’s broader diversification offers a wider moat, but its declining ROIC warns of eroding returns. Wells Fargo’s improving profitability suggests a deeper, though narrower, moat. JPMorgan remains better positioned to defend market share globally.
Which stock offers better returns?
Over the past year, both JPMorgan Chase & Co. and Wells Fargo & Company showed strong price appreciation, with distinct momentum shifts and volume patterns shaping their trading dynamics.
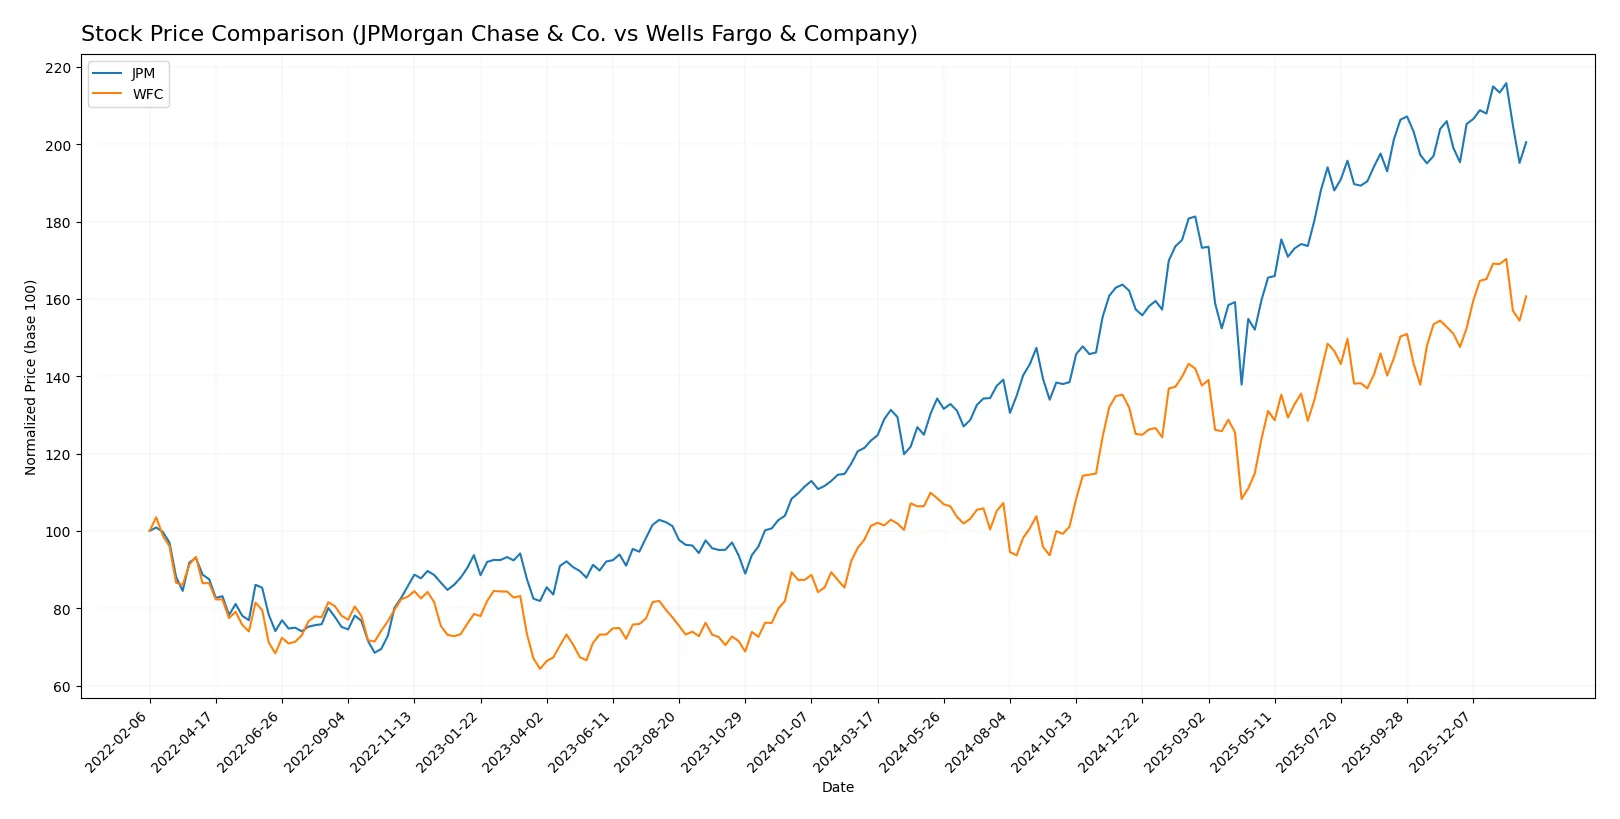
Trend Comparison
JPMorgan Chase’s stock rose 62.52% over the past 12 months, marking a bullish trend with decelerating momentum and high volatility, peaking at 329.19 and bottoming at 182.79.
Wells Fargo’s stock gained 58.56% in the same period, also bullish but with accelerating momentum and lower volatility, reaching a high of 95.95 and a low of 52.76.
JPMorgan Chase delivered marginally higher returns than Wells Fargo, despite a recent slowdown, while Wells Fargo’s accelerating trend suggests growing investor enthusiasm.
Target Prices
Analysts show a positive outlook with clear upside potential for both JPMorgan Chase and Wells Fargo.
| Company | Target Low | Target High | Consensus |
|---|---|---|---|
| JPMorgan Chase & Co. | 245 | 391 | 326.33 |
| Wells Fargo & Company | 74 | 113 | 98.88 |
The consensus target prices for JPM and WFC exceed their current prices, suggesting expected appreciation. JPM’s consensus at 326.33 implies a 6.8% upside versus its 305.89 price. WFC’s 98.88 target implies a 9.3% gain from 90.49.

Don’t Let Luck Decide Your Entry Point
Optimize your entry points with our advanced ProRealTime indicators. You’ll get efficient buy signals with precise price targets for maximum performance. Start outperforming now!
How do institutions grade them?
Here is a summary of recent institutional grades for JPMorgan Chase & Co. and Wells Fargo & Company:
JPMorgan Chase & Co. Grades
The table below lists recent grades from reputable financial firms for JPMorgan Chase & Co.:
| Grading Company | Action | New Grade | Date |
|---|---|---|---|
| Truist Securities | Maintain | Hold | 2026-01-06 |
| Barclays | Maintain | Overweight | 2026-01-05 |
| Truist Securities | Maintain | Hold | 2025-12-18 |
| Keefe, Bruyette & Woods | Maintain | Outperform | 2025-12-17 |
| Wells Fargo | Maintain | Overweight | 2025-11-03 |
| Morgan Stanley | Maintain | Equal Weight | 2025-10-15 |
| Barclays | Maintain | Overweight | 2025-10-15 |
| UBS | Maintain | Buy | 2025-10-07 |
| Evercore ISI Group | Maintain | Outperform | 2025-09-30 |
| Morgan Stanley | Maintain | Equal Weight | 2025-09-29 |
Wells Fargo & Company Grades
Below is a list of recent institutional grades for Wells Fargo & Company from recognized firms:
| Grading Company | Action | New Grade | Date |
|---|---|---|---|
| RBC Capital | Maintain | Outperform | 2026-01-15 |
| Evercore ISI Group | Maintain | Outperform | 2026-01-15 |
| TD Cowen | Maintain | Hold | 2026-01-15 |
| Truist Securities | Maintain | Buy | 2026-01-15 |
| Argus Research | Maintain | Buy | 2026-01-15 |
| TD Cowen | Maintain | Hold | 2026-01-07 |
| Baird | Downgrade | Underperform | 2026-01-06 |
| Truist Securities | Maintain | Buy | 2026-01-06 |
| Barclays | Maintain | Overweight | 2026-01-05 |
| Truist Securities | Maintain | Buy | 2025-12-18 |
Which company has the best grades?
Wells Fargo holds more “Buy” and “Outperform” ratings from recent grading firms, indicating stronger institutional confidence. JPMorgan shows a mix of “Hold” and “Overweight” grades, suggesting a more cautious stance. Investors might view Wells Fargo’s higher grades as signaling better near-term potential but should weigh risks including recent downgrades.
Risks specific to each company
The following categories identify the critical pressure points and systemic threats facing both firms in the 2026 market environment:
1. Market & Competition
JPMorgan Chase & Co.
- Dominates diversified banking with strong global footprint but faces intense fintech disruption.
Wells Fargo & Company
- Strong U.S. consumer banking presence but lags in innovation and digital transformation.
2. Capital Structure & Debt
JPMorgan Chase & Co.
- Debt-to-equity ratio at 1.38 signals elevated leverage; interest coverage below 1 is a red flag.
Wells Fargo & Company
- Slightly lower leverage at 1.07 but still high; interest coverage also below 1, indicating risk.
3. Stock Volatility
JPMorgan Chase & Co.
- Beta of 1.07 shows moderate sensitivity to market swings, reflecting sector volatility.
Wells Fargo & Company
- Beta of 1.09 suggests marginally higher volatility; stock more reactive to market changes.
4. Regulatory & Legal
JPMorgan Chase & Co.
- Faces ongoing scrutiny from global regulators due to size and complexity.
Wells Fargo & Company
- Recent legal challenges have damaged reputation; regulatory pressures remain significant.
5. Supply Chain & Operations
JPMorgan Chase & Co.
- Operates large, complex operations with advanced risk controls; operational risk still material.
Wells Fargo & Company
- Streamlining efforts underway but operational inefficiencies and legacy systems persist.
6. ESG & Climate Transition
JPMorgan Chase & Co.
- Committed to ESG investments but exposed to transition risks in fossil fuel financing.
Wells Fargo & Company
- ESG initiatives growing but reputational risk heightened by past compliance issues.
7. Geopolitical Exposure
JPMorgan Chase & Co.
- Global presence increases exposure to geopolitical tensions and cross-border regulatory risks.
Wells Fargo & Company
- Primarily U.S.-focused, limiting geopolitical risk but increasing domestic policy sensitivity.
Which company shows a better risk-adjusted profile?
JPMorgan’s biggest risk is its high leverage paired with weak interest coverage, threatening financial flexibility. Wells Fargo’s top risk lies in regulatory and legal pressures that impair trust and growth. JPMorgan’s global scale offers diversification but also complexity risks. Wells Fargo trades at lower multiples with moderate leverage, showing a slightly better risk-adjusted profile given fewer operational inefficiencies. However, both firms remain in financial distress zones per Altman Z-scores, demanding caution. Recent data confirms JPM’s weaker interest coverage as a critical vulnerability.
Final Verdict: Which stock to choose?
JPMorgan Chase & Co. demonstrates a superpower in strong income generation and market resilience, reflected in its robust net margin and equity returns. Its point of vigilance lies in declining ROIC and stretched balance sheet ratios, signaling caution. JPM fits well in aggressive growth portfolios seeking established financial engines.
Wells Fargo & Company’s strategic moat is its improving ROIC trajectory and efficient capital use, offering a safer harbor compared to JPM’s value destruction. Its valuation metrics and moderate growth align with GARP portfolios, appealing to investors balancing growth with reasonable risk.
If you prioritize aggressive growth and can tolerate some capital efficiency challenges, JPMorgan outshines with superior income strength. However, if you seek better stability and improving profitability amid moderate valuation, Wells Fargo offers a more measured path forward. Both require careful monitoring of leverage and cash flow dynamics.
Disclaimer: Investment carries a risk of loss of initial capital. The past performance is not a reliable indicator of future results. Be sure to understand risks before making an investment decision.
Go Further
I encourage you to read the complete analyses of JPMorgan Chase & Co. and Wells Fargo & Company to enhance your investment decisions: