Home > Comparison > Healthcare > JNJ vs PFE
The strategic rivalry between Johnson & Johnson and Pfizer Inc. shapes the future of the healthcare sector globally. Johnson & Johnson operates as a diversified healthcare titan, focusing on innovative medicine and advanced medical devices. Pfizer Inc. concentrates on biopharmaceutical innovation with a broad portfolio of vaccines and therapeutics. This analysis pits diversification against specialization to identify which path offers superior risk-adjusted returns for a balanced investment portfolio.
Table of contents
Companies Overview
Johnson & Johnson and Pfizer Inc. excel as titans in the global pharmaceutical industry, shaping healthcare markets worldwide.
Johnson & Johnson: Innovation-Driven Healthcare Leader
Johnson & Johnson dominates the healthcare sector with a diversified portfolio spanning Innovative Medicine and MedTech. Its core revenue derives from prescription drugs targeting complex diseases and advanced medical devices. Since 2023, the company has strategically exited Consumer Health to sharpen focus on high-growth, innovation-led segments, reinforcing its commitment to cutting-edge healthcare technologies.
Pfizer Inc.: Biopharma Powerhouse with Broad Therapeutic Reach
Pfizer Inc. stands out as a global biopharmaceutical innovator with extensive product lines across vaccines, immunotherapies, and small molecules. Its revenues stem from a wide array of medicines and vaccines addressing cardiovascular, infectious, and rare diseases. In 2026, Pfizer emphasizes collaboration and pipeline diversification, leveraging partnerships to sustain growth in a competitive therapeutic landscape.
Strategic Collision: Similarities & Divergences
Both companies emphasize pharmaceutical innovation but diverge in scope and structure. Johnson & Johnson pursues a dual-segment model combining drugs and medical devices, while Pfizer focuses purely on biopharma products and alliances. Their primary battleground is prescription drug development and market penetration. Investors will note Johnson & Johnson’s balanced diversification versus Pfizer’s concentrated biopharma specialization defines distinct risk and growth profiles.
Income Statement Comparison
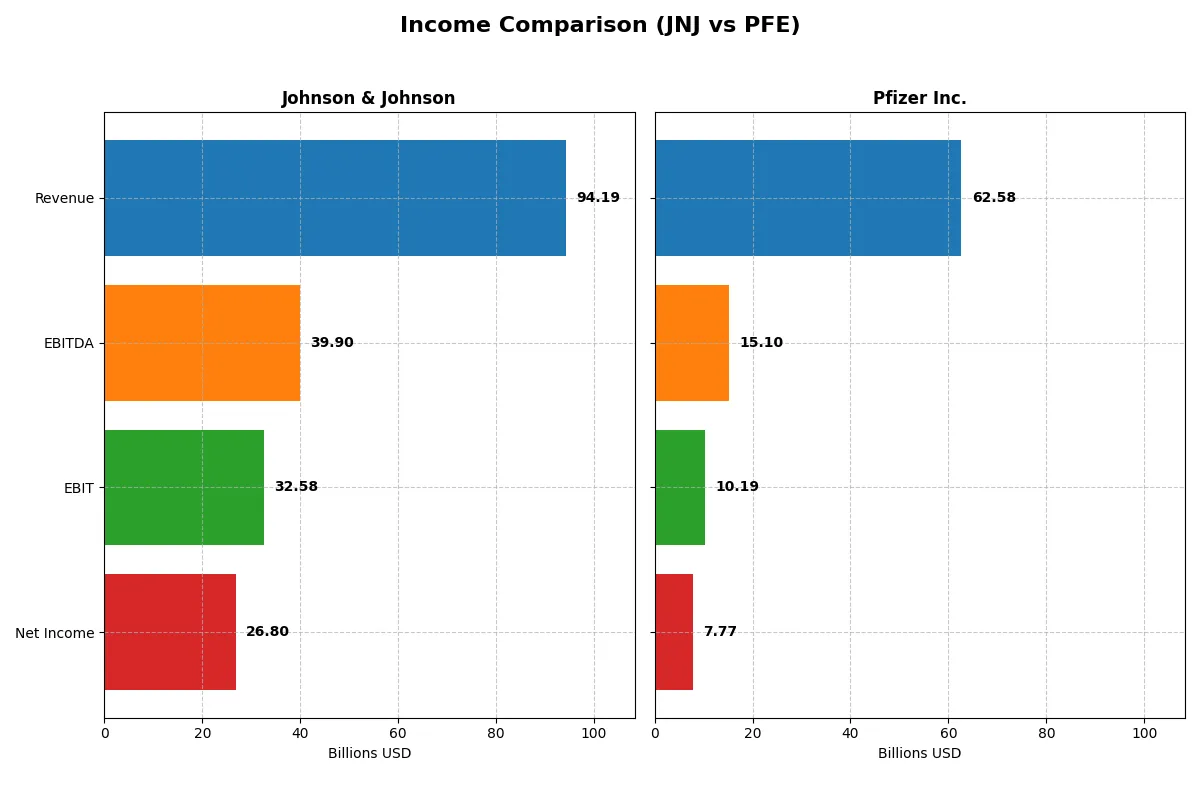
This data dissects the core profitability and scalability of both corporate engines to reveal who dominates the bottom line:
| Metric | Johnson & Johnson (JNJ) | Pfizer Inc. (PFE) |
|---|---|---|
| Revenue | 94.2B | 62.6B |
| Cost of Revenue | 25.6B | 18.6B |
| Operating Expenses | 42.9B | 28.6B |
| Gross Profit | 68.6B | 44.0B |
| EBITDA | 39.9B | 15.1B |
| EBIT | 32.6B | 10.2B |
| Interest Expense | 971M | 2.67B |
| Net Income | 26.8B | 7.77B |
| EPS | 11.03 | 1.36 |
| Fiscal Year | 2025 | 2025 |
Income Statement Analysis: The Bottom-Line Duel
This income statement comparison reveals which company operates its business more efficiently and delivers stronger profitability.
Johnson & Johnson Analysis
Johnson & Johnson’s revenue rose steadily to $94.2B in 2025, with net income surging to $26.8B. Gross and net margins remain robust at 72.8% and 28.5%, respectively. Its 2025 results show impressive momentum with an 87% jump in EBIT and nearly 80% net margin growth, reflecting superior operating efficiency and improving profitability.
Pfizer Inc. Analysis
Pfizer’s 2025 revenue declined slightly to $62.6B, with net income dropping to $7.7B. Gross margin stands healthy at 70.3%, but net margin lags at 12.4%. The latest year showed negative growth in revenue, EBIT, and net margin, indicating challenges in sustaining profitability and operational efficiency compared to prior years.
Margin Strength vs. Revenue Decline
Johnson & Johnson outperforms Pfizer with stronger margin expansion and consistent revenue growth. Its efficient cost management drives superior EBIT and net income growth. Pfizer’s declining revenue and weaker margins highlight profitability pressures. Investors seeking stability and margin resilience will find Johnson & Johnson’s profile more compelling.
Financial Ratios Comparison
These vital ratios act as a diagnostic tool to expose the underlying fiscal health, valuation premiums, and capital efficiency of the companies compared below:
| Ratios | Johnson & Johnson (JNJ) | Pfizer Inc. (PFE) |
|---|---|---|
| ROE | 32.9% | 8.3% |
| ROIC | 13.7% | — |
| P/E | 18.8 | 18.2 |
| P/B | 6.18 | 1.52 |
| Current Ratio | 1.03 | 0 |
| Quick Ratio | 0.77 | 0 |
| D/E | 0.59 | 0 |
| Debt-to-Assets | 24.1% | 0 |
| Interest Coverage | 26.4 | 5.78 |
| Asset Turnover | 0.47 | 0 |
| Fixed Asset Turnover | 4.07 | 0 |
| Payout ratio | 46.2% | 126% |
| Dividend yield | 2.46% | 6.91% |
| Fiscal Year | 2025 | 2025 |
Efficiency & Valuation Duel: The Vital Signs
Financial ratios act as a company’s DNA, uncovering hidden risks and operational strengths that shape investor decisions.
Johnson & Johnson
Johnson & Johnson demonstrates robust profitability with a 32.87% ROE and a strong 28.46% net margin, signaling operational excellence. Its P/E ratio of 18.81 suggests a fairly valued stock, though a 6.18 P/B ratio indicates some premium pricing. The company rewards shareholders with a 2.46% dividend yield, balancing income with steady reinvestment in R&D.
Pfizer Inc.
Pfizer posts a modest 8.35% ROE and a solid 12.42% net margin, reflecting moderate profitability. Its P/E of 18.21 aligns with sector norms, while a low 1.52 P/B ratio points to reasonable valuation. Pfizer’s dividend yield stands at 6.91%, offering strong income, though several liquidity and efficiency ratios remain weak or unreported, raising caution.
Premium Valuation vs. Dividend Strength: Balancing Profit and Payout
Johnson & Johnson’s higher profitability and solid operational metrics justify its premium valuation, providing a stable growth profile. Pfizer offers a compelling dividend yield but shows weaker profitability and liquidity signals. Investors seeking growth with income might prefer Johnson & Johnson, while income-focused investors may lean toward Pfizer’s payout profile.
Which one offers the Superior Shareholder Reward?
I compare Johnson & Johnson (JNJ) and Pfizer Inc. (PFE) based on their 2025 dividend yields, payout ratios, and buyback intensity. JNJ yields 2.46% with a 46% payout, supported by strong free cash flow of 8.1B per share, and maintains steady buybacks enhancing shareholder value. PFE pays a higher dividend yield of 6.91% but with an unsustainable 126% payout ratio and no free cash flow, signaling risk. Pfizer’s buyback activity is minimal, limiting total return. I find JNJ’s balanced dividends and buybacks more sustainable for long-term gains in 2026.
Comparative Score Analysis: The Strategic Profile
The radar chart reveals the fundamental DNA and trade-offs of Johnson & Johnson and Pfizer Inc., highlighting their financial strengths and valuation differences:
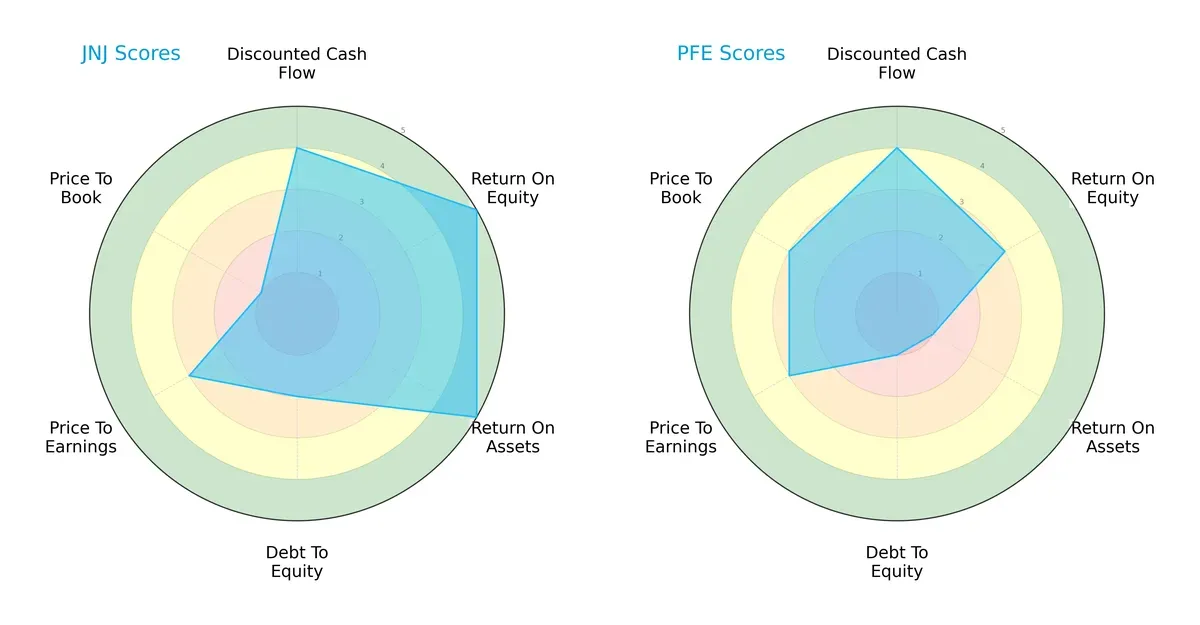
Johnson & Johnson boasts superior profitability metrics with ROE and ROA both rated 5, signaling excellent asset and equity efficiency. Pfizer trails with moderate ROE (3) and very weak ROA (1), indicating less effective asset use. Johnson & Johnson’s debt-to-equity score (2) suggests higher leverage risk compared to Pfizer’s weaker 1, indicating Pfizer maintains a more conservative balance sheet. Valuation scores show Pfizer with better price-to-book (3) than Johnson & Johnson’s poor 1, reflecting relative undervaluation potential. Overall, Johnson & Johnson offers a more balanced profile anchored in operational efficiency, while Pfizer relies on conservative capital structure and valuation appeal.
—
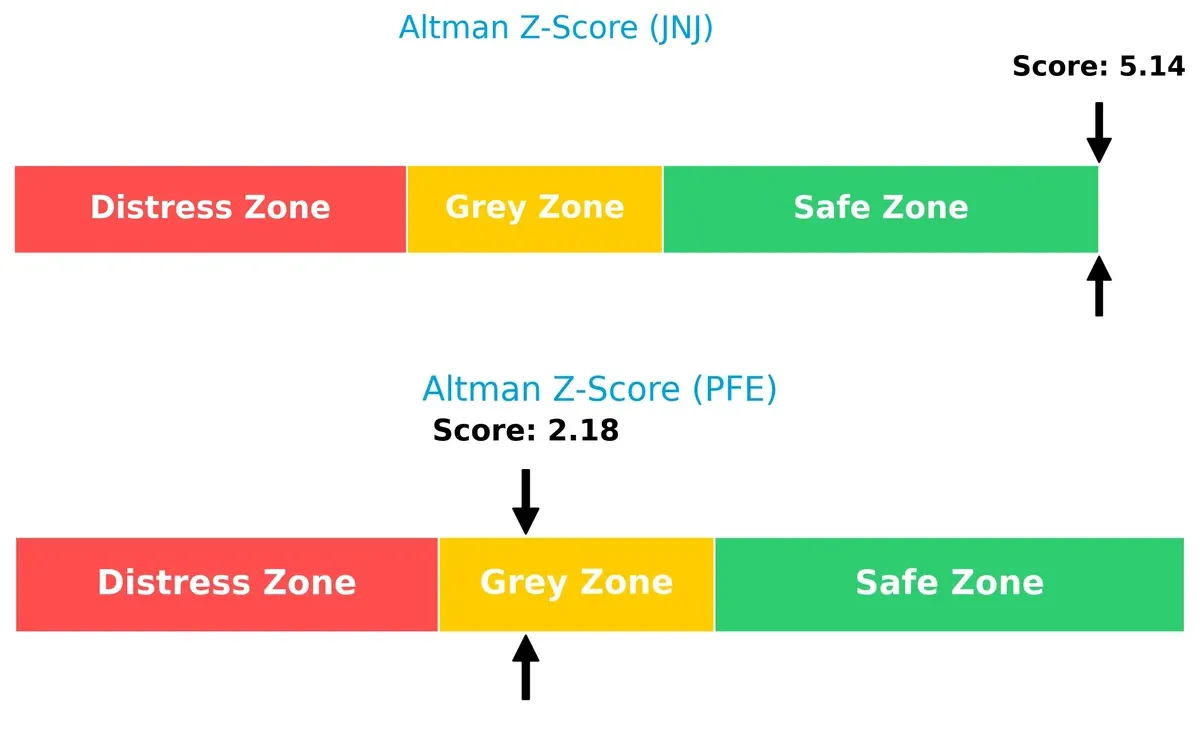
Bankruptcy Risk: Solvency Showdown
Johnson & Johnson’s Altman Z-Score at 5.18 places it firmly in the safe zone, signaling strong long-term solvency. Pfizer’s score is unavailable, limiting direct comparison but raising caution:
—
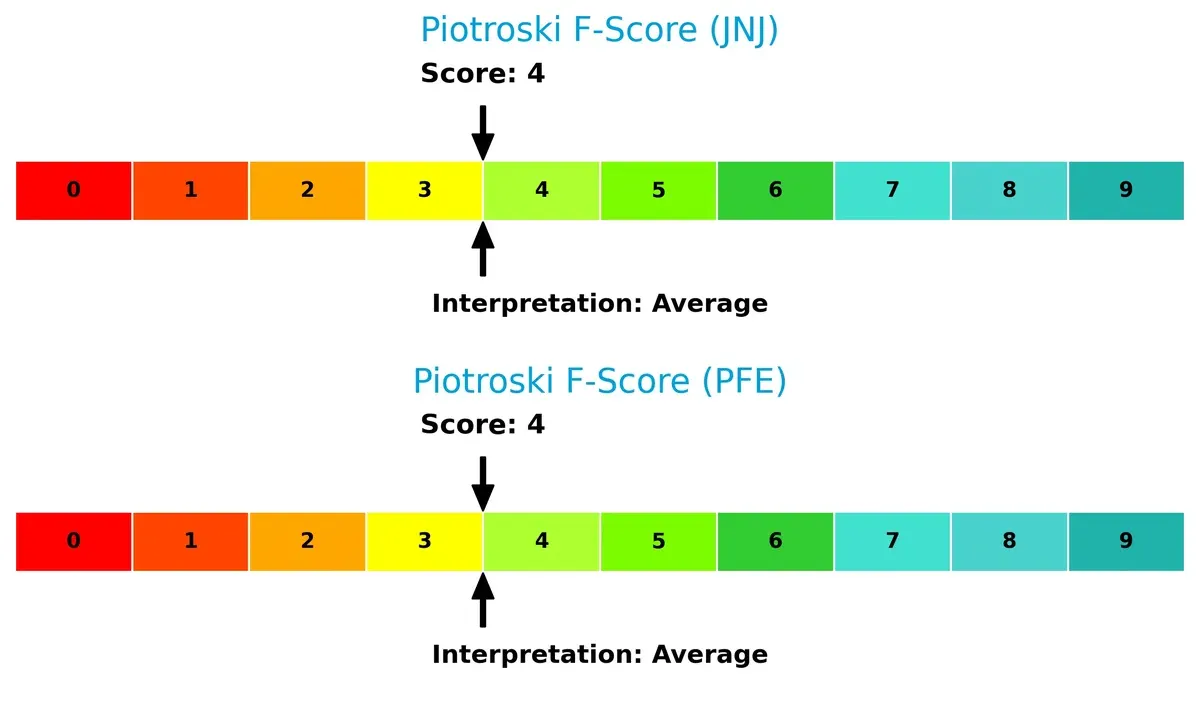
Financial Health: Quality of Operations
Both firms score a 4 on the Piotroski F-Score, indicating average financial health. Neither company shows red flags, but neither stands out as exceptionally strong either:
How are the two companies positioned?
This section dissects JNJ and PFE’s operational DNA by comparing revenue distribution and internal dynamics. The goal is to confront their economic moats to reveal which model offers the most resilient, sustainable advantage today.
Revenue Segmentation: The Strategic Mix
This visual comparison dissects how Johnson & Johnson and Pfizer diversify their income streams and where their primary sector bets lie:
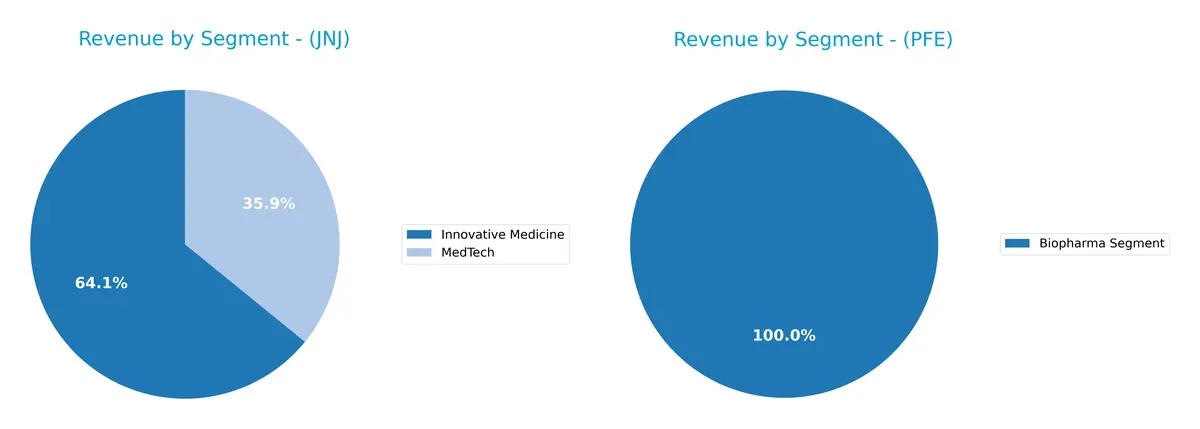
Johnson & Johnson pivots on a balanced mix with $60.4B in Innovative Medicine and $33.8B in MedTech, showcasing true diversification. Pfizer, by contrast, dwarfs others with a $62.4B Biopharma Segment, anchoring most revenue in one dominant segment. J&J’s strategy reduces concentration risk and leverages ecosystem lock-in across healthcare verticals, while Pfizer’s focus signals high dependency on biopharma innovation and market cycles.
Strengths and Weaknesses Comparison
This table compares the strengths and weaknesses of Johnson & Johnson and Pfizer Inc. based on key financial and market metrics:
Johnson & Johnson Strengths
- Strong profitability with 28.46% net margin
- High ROE at 32.87%
- Favorable ROIC of 13.71% above WACC
- Diverse revenue streams including Innovative Medicine and MedTech
- Global presence with significant US and Europe sales
Pfizer Inc. Strengths
- Favorable net margin at 12.42%
- WACC at 5.69% supports capital efficiency
- Large Biopharma segment revenue
- Favorable debt-to-assets ratio
- Higher dividend yield at 6.91% compared to peers
Johnson & Johnson Weaknesses
- Unfavorable quick ratio at 0.77 signals liquidity caution
- High PB ratio at 6.18 may indicate overvaluation
- Asset turnover low at 0.47
- Neutral current ratio at 1.03
- Moderate leverage (D/E 0.59) limits flexibility
Pfizer Inc. Weaknesses
- Unfavorable ROE at 8.35% and zero ROIC raise returns concerns
- Zero current and quick ratios imply liquidity risk
- Unfavorable asset and fixed asset turnover
- Neutral interest coverage at 3.82 times
- High proportion of unfavorable financial ratios (42.86%)
Overall, J&J exhibits robust profitability and diversified revenue, underpinning its favorable financial health. Pfizer shows solid margin and capital cost control but faces challenges in returns and liquidity, which may affect its strategic options.
The Moat Duel: Analyzing Competitive Defensibility
A structural moat protects long-term profits from relentless competition erosion. Only the strongest moats survive market cycles and sustain value creation:
Johnson & Johnson: Innovation and Diversification Moat
JNJ’s moat stems from its diversified healthcare portfolio and strong intangible assets. Its 8.6% ROIC above WACC signals efficient capital use and margin stability. New MedTech and Innovative Medicine products in 2026 could deepen this moat despite a slight ROIC decline.
Pfizer Inc.: Patent-Driven Innovation Moat
PFE relies heavily on patent-protected blockbuster drugs, contrasting JNJ’s broader base. Its negative ROIC spread indicates value erosion and weak reinvestment capacity. However, ongoing vaccine and biopharma launches in emerging markets offer limited upside for moat restoration.
Innovation Breadth vs. Patent Reliance: Who Defends Better?
JNJ’s diversified innovation moat is wider and more resilient than PFE’s narrow patent-driven moat. I see JNJ better positioned to sustain profits and defend market share amid evolving healthcare dynamics.
Which stock offers better returns?
The past year shows Johnson & Johnson’s stock rising sharply with accelerating momentum, while Pfizer’s price increased modestly amid steady trading dynamics.
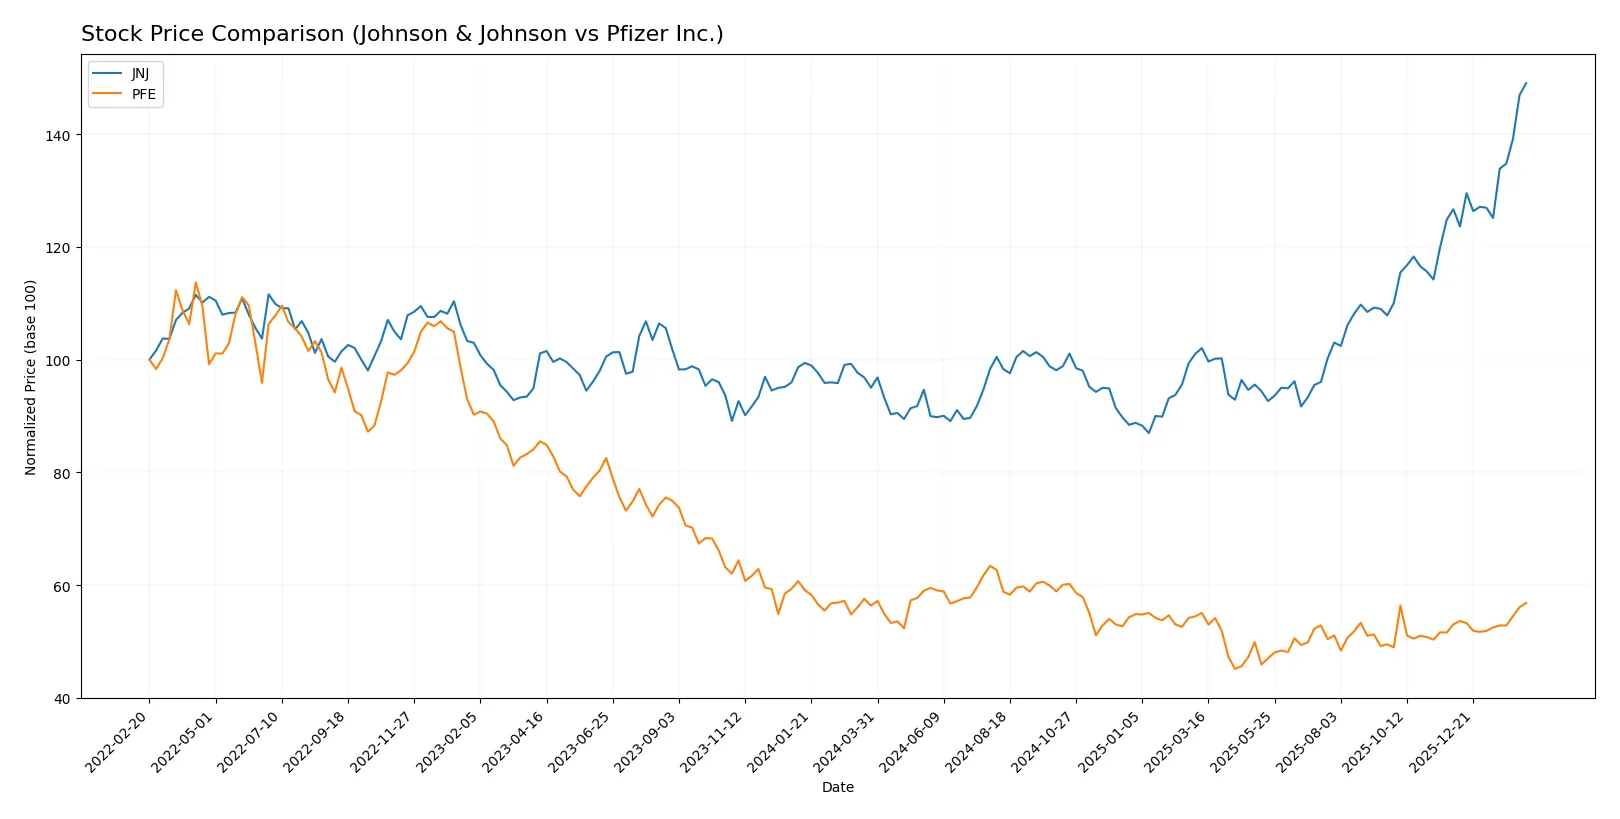
Trend Comparison
Johnson & Johnson’s stock surged 56.83% over the last 12 months, reflecting a bullish trend with acceleration and high volatility, peaking at 243.45 and bottoming at 142.06.
Pfizer’s stock gained 0.8% over the same period, indicating a neutral trend despite acceleration, with low volatility and a price range between 21.91 and 30.77.
Johnson & Johnson outperformed Pfizer significantly, delivering the highest market return and stronger price momentum over the past year.
Target Prices
Analysts present a moderately optimistic target consensus for Johnson & Johnson and Pfizer Inc.
| Company | Target Low | Target High | Consensus |
|---|---|---|---|
| Johnson & Johnson | 190 | 265 | 229.33 |
| Pfizer Inc. | 24 | 35 | 27.89 |
The consensus target for Johnson & Johnson is slightly below its current price of $243.45, signaling cautious optimism. Pfizer’s consensus target of $27.89 slightly exceeds its current $27.58 price, reflecting moderate upside potential.

Don’t Let Luck Decide Your Entry Point
Optimize your entry points with our advanced ProRealTime indicators. You’ll get efficient buy signals with precise price targets for maximum performance. Start outperforming now!
How do institutions grade them?
The recent institutional grades for Johnson & Johnson and Pfizer Inc. are as follows:
Johnson & Johnson Grades
The table below summarizes recent grades from well-known grading firms for Johnson & Johnson:
| Grading Company | Action | New Grade | Date |
|---|---|---|---|
| RBC Capital | maintain | Outperform | 2026-02-03 |
| Morgan Stanley | upgrade | Overweight | 2026-01-28 |
| Freedom Capital Markets | maintain | Hold | 2026-01-27 |
| Guggenheim | maintain | Buy | 2026-01-23 |
| Citigroup | maintain | Buy | 2026-01-22 |
| Wells Fargo | maintain | Overweight | 2026-01-22 |
| TD Cowen | maintain | Buy | 2026-01-22 |
| Morgan Stanley | maintain | Equal Weight | 2026-01-22 |
| Stifel | maintain | Hold | 2026-01-22 |
| B of A Securities | maintain | Neutral | 2026-01-22 |
Pfizer Inc. Grades
The following table presents recent grades from recognized grading companies for Pfizer Inc.:
| Grading Company | Action | New Grade | Date |
|---|---|---|---|
| Cantor Fitzgerald | maintain | Neutral | 2026-02-04 |
| Cantor Fitzgerald | maintain | Neutral | 2026-01-27 |
| Morgan Stanley | maintain | Equal Weight | 2025-12-17 |
| B of A Securities | maintain | Neutral | 2025-12-15 |
| Morgan Stanley | maintain | Equal Weight | 2025-12-12 |
| Guggenheim | maintain | Buy | 2025-11-24 |
| Morgan Stanley | maintain | Equal Weight | 2025-10-10 |
| B of A Securities | maintain | Neutral | 2025-10-03 |
| B of A Securities | maintain | Neutral | 2025-08-06 |
| Citigroup | maintain | Neutral | 2025-08-06 |
Which company has the best grades?
Johnson & Johnson has received more positive grades including multiple Buy and Overweight ratings. Pfizer’s grades cluster around Neutral and Equal Weight, suggesting less enthusiasm. This contrast may influence investor sentiment toward greater confidence in Johnson & Johnson.
Risks specific to each company
The following categories identify the critical pressure points and systemic threats facing Johnson & Johnson and Pfizer Inc. in the 2026 market environment:
1. Market & Competition
Johnson & Johnson
- Dominates diversified healthcare segments with innovation-driven focus; faces pressure from MedTech and pharma rivals.
Pfizer Inc.
- Competes heavily in biopharma with reliance on blockbuster drugs; faces biosimilar and generic competition risks.
2. Capital Structure & Debt
Johnson & Johnson
- Moderate leverage (D/E 0.59), strong interest coverage (33.55), signaling prudent debt management.
Pfizer Inc.
- Virtually no reported debt; zero leverage metrics suggest conservative capital structure but possible underutilization of financial leverage.
3. Stock Volatility
Johnson & Johnson
- Low beta (0.347) indicates defensive stock behavior, stable in market downturns.
Pfizer Inc.
- Slightly higher beta (0.441) reflects moderate sensitivity to market swings, more volatile than JNJ.
4. Regulatory & Legal
Johnson & Johnson
- Legacy legal challenges post-Kenvue spin-off may persist; regulatory scrutiny on pharmaceuticals remains high.
Pfizer Inc.
- Faces ongoing regulatory reviews on drug approvals and pricing; litigation risks from patent expirations.
5. Supply Chain & Operations
Johnson & Johnson
- Complex global supply chain with diversified operations; operational efficiency challenged by asset turnover below sector norms.
Pfizer Inc.
- Supply chain exposed to vaccine production and contract manufacturing demands; limited asset turnover data poses transparency risk.
6. ESG & Climate Transition
Johnson & Johnson
- Strong ESG initiatives embedded in healthcare innovation; climate risks managed but exposure to environmental regulation remains.
Pfizer Inc.
- ESG efforts growing but less transparent; pressure to align biopharma operations with sustainability goals intensifies.
7. Geopolitical Exposure
Johnson & Johnson
- Global footprint exposes it to trade tensions and regulatory variations, especially in emerging markets.
Pfizer Inc.
- Significant exposure through vaccine distribution and partnerships; geopolitical instability could disrupt supply and sales.
Which company shows a better risk-adjusted profile?
Johnson & Johnson’s prudent leverage and low stock volatility suggest a more stable risk-adjusted profile. Pfizer’s zero leverage minimizes financial risk but raises questions about capital efficiency. JNJ’s broad diversification buffers competitive and geopolitical pressures more effectively than Pfizer’s concentrated biopharma focus. The biggest risk for JNJ is operational efficiency lagging sector peers, while Pfizer’s critical risk lies in regulatory and competitive threats eroding its drug pipeline profitability. JNJ’s Altman Z-Score in the safe zone and robust interest coverage reinforce its stronger financial stability.
Final Verdict: Which stock to choose?
Johnson & Johnson’s superpower lies in its robust value creation, demonstrated by a strong ROIC comfortably above its cost of capital. Its consistent profitability and cash flow generation position it as a dependable engine of growth. A point of vigilance is its declining ROIC trend, which may signal emerging efficiency challenges. It fits well in an Aggressive Growth portfolio seeking resilience with growth potential.
Pfizer’s strategic moat centers on its established pharmaceutical pipeline and recurring revenue from blockbuster drugs, offering a sturdy defensive position. Relative to Johnson & Johnson, Pfizer presents a more conservative risk profile but with slower growth momentum and less efficient capital use. This makes it suitable for a GARP portfolio that favors steady income with moderate appreciation.
If you prioritize dynamic value creation and growth, Johnson & Johnson outshines with superior profitability and cash generation despite some efficiency erosion. However, if you seek safer income streams with a defensive edge, Pfizer offers better stability at a lower growth premium. Each company appeals to distinct investor avatars balancing growth ambition against risk tolerance.
Disclaimer: Investment carries a risk of loss of initial capital. The past performance is not a reliable indicator of future results. Be sure to understand risks before making an investment decision.
Go Further
I encourage you to read the complete analyses of Johnson & Johnson and Pfizer Inc. to enhance your investment decisions: